GBPUSD 4H AnalysisHey Traders, Two 3Drives near HTF Reversal Zone.
Bearish is more probable, as mentioned earlier.
4h

USD-JPYThe USD-JPY pair currently traded at 130.900 and in a 4h timeframe trend line resistance is at 131.300. And support level is at 127.500, showing the downfall in this pair.

GBP-CADThe GBP-CAD pair currently traded on 1.68100 and resistance is at 1.68650. and also creating a rising wedge and breakout. And its fall to 1.65600 mention in chart.

gbpusd 4hbargarde biad to mahdode black be man vorod bede sell mizanam kolan ro mojhaye nozolsh trade scalpe sell anjam midam

nzdusd 4hgheymat be black rozane vakonesh neshon dad va vorod khobiam dade bod injaha age biad paen shayad mojadad stup khobi bara gereftan buy bede ba target haye bozorg tar

NZDCAD - Uptrend to Downtrend?Hi,
Little while since my last fx post!
Here we see NZDCAD has followed an up trend from the 28th of Feb until the 20th March. We can see this as it has continually formed higher highs and higher lows through "Channel A"
I have been trading on these areas, however when a new lower low formed, this signalled that the uptrend had run its course.
The new lower high on the 23rd March was formed, it confirmed a downtrend was beginning. I placed a trend line across the latest higher and lower high to help create an idea of the channel it will follow. This is "Channel B"
Alternatively it may still hit the level of resistance as the previous lower Low did. This could mean it would follow through to channel C with little movement through where A and B cross.
The trade set up on the chart isn't a trade I have placed, it just gives an idea. Once confirmed, I will start trading on the movement!
This is just my own idea, nothing is black and white. Let me know what you think
Thanks

EURCHF Short IdeaPrice hitting off resistance zone, potential Sell position.
TP1 0.9945
TP2 0.9900
TP3 0.9850
SL 1.00035 or according to your equity

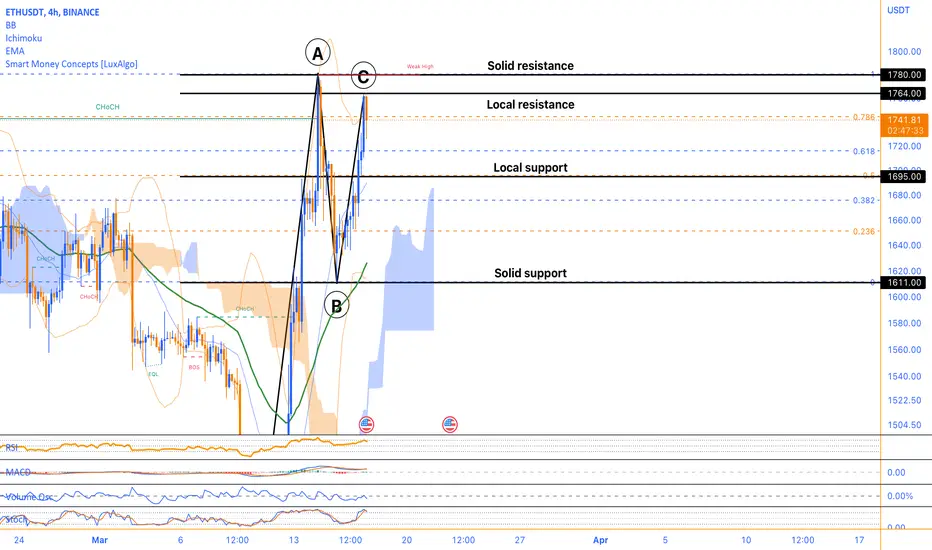
Riding the Bull, Key Support and Resistance LevelsLooking at the Ethereum chart, there are a few key prices that traders should keep an eye on. The current price is $1737, and technical indicators such as the RSI and stochastic oscillator suggest that the asset is currently in a bullish trend. The MACD is also positive, which indicates a strong momentum behind the asset's price movement.
However, there are also potential levels of support and resistance that traders should be aware of. The 0 Fibonacci level at 1611 could be a solid support level for the asset, as it is a significant Fibonacci retracement level. Additionally, the 0.5 Fibonacci level at 1695 could act as a local support level if the price were to experience any dips.
On the other hand, there are also potential levels of resistance to consider. The 1 Fibonacci level at 1780 could act as a solid resistance level for the asset, as it is a significant Fibonacci retracement level and close to the upper Bollinger band at 1764. Additionally, the upper Bollinger band could be a local resistance level to watch.
It is worth noting that the lower Bollinger band at 1615 could provide another level of support for the asset, while the middle Bollinger band at 1689 could provide an indication of the current price range. Furthermore, the volume oscillator is at -10%, which is not a strong indicator either way but is still worth considering.
In conclusion, traders should keep an eye on the potential levels of support and resistance, as well as the technical indicators, to make informed trading decisions. As always, risk management should be a priority to minimize potential losses.

US30, YM, DOW JONES 4H BUY predictions This is a 4H BUY Analysis of the Dow Jones:
Price can:
-Reach 32239 @ End of Tokyo.
-Fly to 32980 @ London open.
Happy Trading

Gold 4hAgar to time kochik polback be mahdode zard didim va kandel ha neshangar souod dashtan to time frem paen mamele long baz mikonim

SasanSeifi 💁♂️🟡 GOLD / 4H 🔻$1820/$1823/$1830❗❗LET'S SEE ...HI Everyone✌The possible scenario of XAUUSD is specified.
After a correction from the 1859 range, Gold is currently trading in the 1813 range. We can expect the price to correct as liquidity gathers from the desired ranges, $1820/$1823/$1830 levels. We have to see how the price will react.
❎ (DYOR)...⚠⚜
WHAT DO YOU THINK ABOUT THIS ANALYSIS? I will be glad to know your idea 🙂✌
IF you like my analysis please LIKE and comment 🙏✌

SasanSeifi 💁♂️🟡 GOLD / 4H UPDATE 🔼 186 PIP FROM $1830✌🔥HI TRADERS ✌ As you can see, XAUUSD it was mentioned in the previous analysis that if it stabilizes above the range of $1830, the possibility of growth again up to the range of $1840 can be considered.
The price was able to grow by 186 pips from the range of $1830. Currently, the price is trading in the supply zone of $1847 / $1843.
The scenario we can expect is that if it stabilizes above the range of $1847,we will see the price grow up to the range of 1850. Otherwise, the possibility of price correction can be considered. We have to see how the price will react...
let's see...
❎ (DYOR)...⚠⚜
WHAT DO YOU THINK ABOUT THIS ANALYSIS? I will be glad to know your idea 🙂✌
IF you like my analysis please LIKE and comment 🙏✌

SasanSeifi 💁♂️ DOWJONES / 4H ⏭ 33400 ?HI TRADERS ✌
As you can see, the desired scenario of the DowJones index is specified on the chart.Currently, it is trading in the range of 33246. I expect the trend to grow to the liquidity range of 33400. Then it will be corrected by collecting liquidity from the 33400 range, we have to see how it will react. If it stabilizes above the range of 33400, the target of 33700 can be considered. Keep in mind that maintaining the 32,900 range is important for the continuation of the positive swing.
let's see...
❎ (DYOR)...⚠⚜
WHAT DO YOU THINK ABOUT THIS ANALYSIS? I will be glad to know your idea 🙂✌
IF you like my analysis please LIKE and comment 🙏✌

SasanSeifi 💁♂️🟡 #XAUUSD / 4H UPDATE 🔻150 PIP FROM $1843✌🔥
HI TRADERS ✌
As you can see, XAUUSD ; according to the latest price analysis, it was able to correct about 150 pips from the $1843 supply area mentioned in the previous analysis. It is currently trading in the range of 1835 in the time frame of 4 hours .I think the price will continue to correct up to 1820 range .We have to see how the price will react to the range of $1830. If the price stabilizes above the range of 1830, we can expect the price to grow again up to the range of 1840. Otherwise, if the price breaks below the 1830 range and stabilizes, further price correction to the fvg range of $1825/$1823/$1820/$1817 can be considered.
let's see...
❎ (DYOR)...⚠⚜
WHAT DO YOU THINK ABOUT THIS ANALYSIS? I will be glad to know your idea 🙂✌
IF you like my analysis please LIKE and comment 🙏✌

SasanSeifi💁♂️ #RLCUSDT /4H HI TRADERS ✌ The possible scenario of RLCUSDT is specified. As you can see, the price is currently trading in the range of $2 . According to the behavior of the candles, we can expect the price to grow to the range of $2.077 / $2.13 / $2.21.We have to see how the price will react to the 2.077 range. In case of stabilization above the range of 2.077, the target of 2.21 can be considered.
❎ (DYOR)...⚠⚜
WHAT DO YOU THINK ABOUT THIS ANALYSIS? I will be glad to know your idea 🙂✌
IF you like my analysis please LIKE and comment 🙏✌

SasanSeifi 💁♂️EUR/USD 4H / 1.072 _1.074 ? 🤔HI TRADERS ✌The Possible trends of #EUR/USD are shown on the chart.As you can see, the price faced buying pressure from the order block range of 1.053 and was able to grow up to the range of 1.069. Currently, the price is trading in the range of 1.067. Due to the breaking of the dynamic resistance, if it stabilizes above the range of 1.062, we can expect the price to grow up to the range of 1.072/1.074.
Targets are in the range of 1.072/1.074.
❎ (DYOR)...⚠⚜
WHAT DO YOU THINK ABOUT THIS ANALYSIS? I will be glad to know your idea 🙂✌
IF you like my analysis please LIKE and comment 🙏✌

SasanSeifi 💁♂️🟡 #XAUUSD / 4H / 1847 ???🤔HI TRADERS ✌The Possible trends of #XAUUSD are shown on the chart. As you can see, it faced buying pressure from the range of 1804 and was able to grow up to the range of 1838. Currently, the price is trading in the range of 1838.
The scenario that can be considered is the possibility of price correction from the range of 1843/1847. Otherwise, if the price penetrates above the range of 1847 and stabilizes, the target of 1854/1858 can be considered.We have to see how the price will react to the 1847 range.
let's see...
❎ (DYOR)...⚠⚜
WHAT DO YOU THINK ABOUT THIS ANALYSIS? I will be glad to know your idea 🙂✌
IF you like my analysis please LIKE and comment 🙏✌

SasanSeifi💁♂️ BTCUSDT / 4H HI TRADERS ✌ The Possible scenarios of #BTC is specified on the chart,After correction from the important resistance range of 25200, the price faced correction to the range of 20800. Currently, as you can see, the price is trading in the range of 23,700.We can expect the price to grow to the 24,200/24,300 range and then a minor correction to the $25,000 range again. We have to see how the price will react. Maintaining the $23,500/$23,300 support range is important for a positive swing.
❎ (DYOR)...⚠⚜
WHAT DO YOU THINK ABOUT THIS ANALYSIS? I will be glad to know your idea 🙂✌
IF you like my analysis please LIKE and comment 🙏✌

SasanSeifi💁♂️EUR/AUD .4h Update 175 pip✔🔥🔥😍✌HI TRADERS ✌According to the latest analysis, as I expected, after a slight correction from the 1.55200 range mentioned in the previous analysis, the price faced buying pressure and was able to grow by about 175 pips.🔥✌The first target was touched at 1.56500.✔ It is currently trading in the range of 1.56700. We can still expect price growth up to the second target range of 1.57500. The previous analysis is still valid.
❎ (DYOR)...⚠⚜
What Do you think about this analysis? I will be glad to know your idea 🙂✌
IF you like my analysis please LIKE and comment 🙏✌

Buying Opportunity on 4H timeframeAs it is evident that on weekly timeframe market is in an uptrend. It has taken breath in some weeks. On the daily timeframe the market has come to clear support. If we further come down lower on the 4H timeframe we can expect a break of structure to go longer having 1:1 to 1:1.5 Risk to reward ratio.

Who takes the power, the buyer or the seller?We are in a place where decision-making power is difficult, but due to the failure of the trend line and strong return to the trend line, the price must undergo its correction and then decide to grow and reach the goal.
⚠️ This Analysis will be updated ...
👤 Banipal : @hosseinbakrani
📅 02.20.2023
⚠️(DYOR)
❤️ If you apperciate my work , Please like and comment , It Keeps me motivated to do better ❤️

SasanSeifi💁♂️EUR/AUD 👉 4HHI TRADERS ✌As You can see The price has faced buying pressure from the range of 1.53500. Currently, it is trading in the range of 1.55900. The scenario that can be considered is that after a minor correction, if the support range of 1.55200/1.54800 is maintained, the price can be expected to grow up to the targets in the range of 1.56500/1.57500. Otherwise, if the price penetrates below the range of 1.54800/1.58300, the possibility of further correction can be considered.
❎ (DYOR)...⚠⚜
What Do you think about this analysis? I will be glad to know your idea 🙂✌
IF you like my analysis please LIKE and comment 🙏✌
