4h

1D SMITH WESSON TRENDLINE BREAKOUTTrend Line Trading: The Trend Breaker Strategy
This trendline breakout trading strategy uses three indicators, which are the following:
MACD- The inputs for this indicator are: Fast Length= 12 (represents the previous 12 bars of the faster moving average), Slow Length= 26 (Represents the previous 26 bars of the slower moving average), and Signal Smoothing= 9 ( represents the previous 9 bars of the difference between the two moving averages. This is plotted by vertical lines called a histogram).
Simple Moving Average- The inputs for this indicator are: Length 8, Offset 0. (Red line)
Exponential Moving Average-The inputs for this indicator are: Length 20, Offset 0. (Blue line)
This Trend Breaker strategy also uses three different time frames. They are the 4 hour, the 1 hour, and 15 minute time frames. This top-down approach uses these time frames to identify a trend, find a breakout point, determine an entry point, and execute the trade.
Step One to trend line trading: Identify a trend
The first thing you need to do is identify an upward, downward, or sideways trend by switching to a 4-hour and 1 hour time frames. The reason both are used is that it will give you the best perspective in determining a trend according to this strategy. Draw a trend-line so that 3 points of resistance or support was touched. We created this trendline trading system so that you could easily enter trades without a lot of guesswork on your part. Here You can see a funny video about trading levels.
Since this strategy focuses on trends, a trend line will be drawn on the support or resistance lines of the trend. The criteria for a trend is that there needs to be at least three points of resistance or support.
As you can see on the 4- hour time frame this clearly is a downtrend.
Below is the same chart only this is a 1-hour time frame. This is just to get another perspective of this downtrend. It is good to do this to completely confirm this trend by identifying 3 levels of resistance. Trading with trend lines is not easy, that is why it is important to have a clear system of step by step rules to make it easy for you to follow.
Step Two: Identify a Breakout point Trendline Trading System
In order to find a breakout point of the trend that was identified in step one, the strategy will use a combination of the three indicators (MACD, 15 minute SMA, EMA) to identify a break out on the 15-minute time frame. This time frame is used because a trend was already identified in step one on the 4 hours and 1 hour time frames.
As you can see in the chart above on the 15-minute time frame, the MACD lines were crossed. When the crossover of the fast length and slow length occurs, this will signal a new trend. This gave an indication that a trend was breaking. The moving average and exponential moving average lines also crossed. So when the MACD lines cross and the simple moving average/ exponential lines cross wait until the candlesticks go above/below trend line that was drawn in step one, then identify a point of entry into the trade. One of the reasons we like trend line trading so much is that it is straight forward and simple and we recommend all traders have something simple.
So looking at our example above the criteria was met to go to step three because the SMA and EMA crossed and the MACD lines crossed. Also, the trend went upwards and hit our trend line. This is a signal to go to step three.
If neither of the indicators crosses before the candlesticks close and hit the trend line then do not go any further because the trade does not meet the criteria of the rules. The indicators need to show that the trend broke before it touched the trend line.
Note* When our indicators are crossing, the trend needs to be heading toward the trend line that was drawn in step one. This is because the trend is breaking and a breakout is about to occur. When the breakout happens we will discuss when to make an entry.
Step Three: Trend Line Trading Identify a point of entry
Here is a list of the entry criteria:
These 4 things must happen to enter a trade with this Trend Breaker Strategy.
Simple Moving Average Must Cross below the Exponential moving average.
Macd Must Cross
The price must break below or above the trend line.
After the break of the trendline, you must wait for 3 candles to close on the 15-minute chart before taking your entry.
Now we need to identify a point of entry. To identify a point of entry always use the 15 minute time frame in this strategy.
So in our example below, we see that there is an obvious stand-off between buyers and sellers on the trend line.
Once there are at least three candlesticks above or below the trend line, you execute the trade.
In this example, there are three candlesticks that fell above the trend line after our indicators signaled that the trend was broken. At this point, you want to make an entry. Also, read about Trader's Tech and Installing MT4 EAs with Indicators.
Step four: How to Trade with Trend Lines: Determine where to place a stop loss. 1 Use Pong Position Icon on left side toolbar. Adjust Top Prifit line until center text says 1 to 3 risk reward. This will show you where SL should be placed. OR
Place a stop loss past the last support and resistance levels in the trend itself. Again, use the 15 minute time frame to find this point of resistance/ support level.
In the example shown below, place the stop loss below the last support level. This will ensure that if there was a bearish move, it will hit the last point of support and make a bullish move upwards.
You can clearly see that there are two levels of support in the above example. Use the support levels to determine the stop loss. The rules were to place the stop loss below the last support level which is why you see the stop loss below these levels.
Step five: Trendline Trading System Exit Strategy
The plan clearly identified a trend, a breakout point, point of entry, and determined a stop loss. The final step is to determine the exit point. This Trend Breaker strategy uses 1 risk to 3 reward ratio.
What that means is you have the potential to make 3 times more than you are risking.
Use the Long Position Icon on the left side toolbar. Adjust top profit level until the center text says 1 to 3 risk reward.
Conclusion
This Trend Breaker Strategy is simple and yet effective. There is no need to stress and worry that you made the wrong trade. You follow the rules and do not let anything else make you back out of a trade. If it follows the rules, execute the trade with confidence.
Always remember to only be risking no more than 2% of your account!
This will help you identify daily trends and points where they break. There is no need to force yourself into a trade. If it does not follow your rules and guidelines then search for another pair to trade. Feel free to check out one of our other trading strategies.

$PLTR Pennant Forming On Multi-Time Frames (D, 4H, 1H)Continuation pattern, Bullish, Confirmed on multiple time frames. Only down side if it loses support at Red Line (25.33-25.69) could drop down to test 21 ma (Yellow Line)

XAUUSD DropGold is still moving in a downtrend channel overall, new lower highs are being created, but what's interesting is this last touch. On the 4H chart we can see clearly that a H&S pattern has formed and if we scale down to the smaller time frame we can see that more lower highs are being made in the right shoulder, the moment price breaks structure, pullbacks and creates a nice entry signal we can enter. The drop could see some pressure on the untested demand zone and if it breaks it we can see a lot of liquidity there and a possible drop to for a new lower low.

ETH needs to bearish Hi , I think ETH should have a turnaround to support 530 in the 4-hour time frame according to the channel above. And then start its upward movement for targets 601 and 620. The closest support can be seen in the SMA 200 area.now the first resistance is 570.
Good luck

AUDUSD | December 11, 2020Hey Guys I'm Amir.
Just analysis on AUDUSD , we have 4 signal for selling AUDUSD.
I have been learning Forex for 2 month now.


EUR/USD | December 2, 2020hey guys, this is EUR/USD analysis that i expect the price will grown up again after a pull back, but we have to wait for the confirmation on touching the strong Support level... in monthly time frame we can see the big and old resistance level that broken and it's now gonna be a good support zone.
in weekly time frame we can see that resistance level on 1.23456.
in daily time frame i found a strong support zone.
in 4 hour time frame:
Good luck guys, this is just my analysis, i'm new in Forex and there's a lot of things that i have to learn.
I have been learning Forex for 1 month now.


EURGBP OutlookContiuation Bullish after retest support trendline and up impulsive. Potential to make bullish flag and will be up to harmonic cluster in ressistance trendline


Bearish Deep Crab (4H)This Deep Crab entry is around the area of TP2 for the Daily Bullish Butterfly, see the comments below for further details.

XRP 4H Fib RetracmentsJust a cleaner version of my previous chart published.
December should be a good month 👍

LTCUSD 4H , Ideal path for a nice bullish runLTCUSD trapped in a resistance zone but to achieve a nice and safe bullish movement to higher lever and stabilize there, another touch to support is expected.

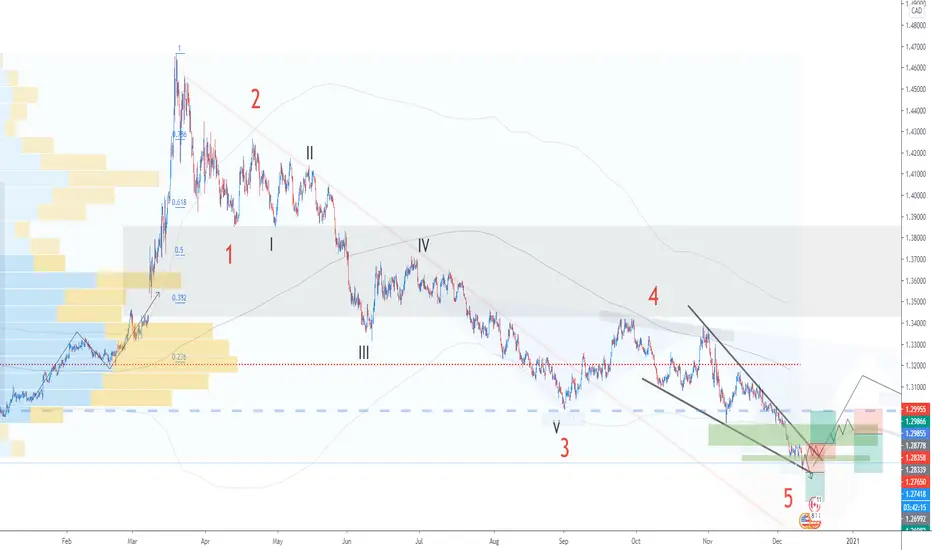
USDCAD premarket analysis :DStrong support lets see what happens in the next week!
Give me the like is free! xD

XRP Potential bear flagThe bear flag formation is underlined from a strong move down, followed by a consolidation channel & a significant decrease in volume within the channel range as shown. I believe XRP could see another drop to around the 0.4 range within the next few days.

XRPUSD 1h November Close / December OpenSame as BTC really:
Dec 3rd 123 Day - 12/3/2020
See what happens to Bitcoin

SPX500 is going to be in favor of bulls s&p500 in 4h time frame is bull related and the cup formation is getting completed while the classic indicators are also confirm its bullish trend
we have to wait for trend to cross the plotted resistance

XRP/USDT 4h is going to be bullish in trenddue to mountain formation indicated in the following chart, XRP/USDT is going to be bullish in trend soon
