NZDUSD SELL SETUPOANDA:NZDUSD My overall bias on NAZDUSD is bearish, 4H structure is bearish with it making a retest at the Daily AOI (Area of Interest) and rejecting with a bearish engulfing variation patterning which was my confirmation to go short on NZDUSD
4h

SOL 4H RANGESOLANA is down -40% from making a new ATH to the bottom of the crash wick @ $175. Looking at the chart, unless BTC decides to gap down again from a TA standpoint SOL looks good here.
A triple tap of the bottom with a reclaim of the bullish orderblock that coincides with the golden pocket zone from local LTF high to low, followed by a strong reaction from that zone. Q1 is historically good for altcoins and so the all of these points added together the R:R at this level is good IMO.
Profit taking through the range quarters.
The idea is invalid once price accepts below the triple tap bottom under $170.

FARTCOIN 4H After selling off heavily from the high FARTCOIN is starting look stronger at these areas.
Price has broken out of the diagonal downtrend resistance after sweeping the KEY S/R LEVEL demand zone. Now retesting the breakout for support, if it holds then a move towards the LOCAL HIGH BEARISH OB is the next aim for bulls.
After that a progressive HL & HH structure is needed to work up to the TP targets at significant levels later on.
Overall good R:R at this level from a chart TA perspective, my worry is that currently memecoins are out of favor because of the sell off so keeping an eye on sentiment would be important.

AUDCAD SELL IDEAOANDA:AUDCAD Overall bias is bearish. Price made a retest into the Daily AOI, awaiting a 4h bearish engulfing to confirm bearish bias to the downside on AUDCAD

EURJPY SELL IDEAOANDA:EURJPY
Overall bias on EURJPY is bearish. price made a retest into the Daily AOI. Anticipating a move towards the downside

etc longterm buy"🌟 Welcome to Golden Candle! 🌟
We're a team of 📈 passionate traders 📉 who love sharing our 🔍 technical analysis insights 🔎 with the TradingView community. 🌎
Our goal is to provide 💡 valuable perspectives 💡 on market trends and patterns, but 🚫 please note that our analyses are not intended as buy or sell recommendations. 🚫
Instead, they reflect our own 💭 personal attitudes and thoughts. 💭
Follow along and 📚 learn 📚 from our analyses! 📊💡"

CADJPY SELL IDEAOANDA:CADJPY Overall bias on CADJPY is bearish. Price making a retest into the daily area of interest (AOI). If a 4H bearish engulfing candlestick is formed on the 4H. I will be looking to short CADJPY.

XRP 4H PennantBullish Pennant formed on the 4H as a continuation pattern.
It can still break to the downside side but my bias is expecting the bullish continuation.
More likely for bullish continuation to occur due to pattern following an uptrend.

PEPE Eyes $0.00002000: Bullish Momentum Builds Above!PEPE/USDT 4H Chart Analysis
Equilibrium established: PEPE is stabilizing at $0.00001867 after a bounce from the discount zone, showing signs of bullish momentum supported by RSI.
Current price: $0.00001867.
Key levels:
Support:
POL (Point of Loss): $0.00001700.
POH (Point of Hold): $0.00001750 (key level for continued bullish structure).
Resistance: $0.00002100 (premium zone, key breakout target).
Momentum shift: RSI indicates a bullish reversal, aligning with the recent bounce from the discount zone.
Trade setup:
Entry: Current level ($0.00001867) or on a pullback near $0.00001750 (POH).
Target: $0.00002000 (short-term resistance level).
Stop loss: Below $0.00001700 (POL) to minimize risk.
Risk-to-reward: Favorable setup, especially if price holds above POH.
Confidence level: 7/10 for bullish continuation.
Considerations:
Support test: Ensure price holds above POH ($0.00001750) to validate bullish continuation.
Momentum confirmation: Monitor RSI and volume for sustained upward pressure.
Resistance reaction: Be cautious around $0.00002100; strong resistance could trigger a pullback.
This setup suggests a potential upside to $0.00002000, provided support levels hold. Tight risk management is essential near volatile zones.

EURJPY SELL IDEAOANDA:EURJPY
Overall bias on EURJPY is bearish, thus I am looking for sells. Price just made a retest at the Daily AOI, and what I am looking for next is a bearish engulfing candlestick on the 4H timeframe to go short on this pair

GBPUSD SELL IDEAOANDA:GBPUSD Overall bearish bias on GBPUSD. price currently making a retest at the Daily/key area of interest. Currently awaiting a 4H bearish engulfing candlestick on the 4H

Powerful Signal for Buy On ZB1As you can see from the chart, the price right now is in a strong support zone, with a Red squeeze candle (spring box). And we are likely to see a significant explosion in price to the 119 levels.

BTC Long Idea on 4H based on fibonacciExpecting some pull back till we jump in. Probably 61.8 or 78.6 because 78.6 like a legit pullback point nowadays. That's why i put some space for my stop loss. Risk Rewards 1:3. Let's see how it goes. Cheers! Happy Weekends and i am drinking beer chilling !

#TON. TON IS ON ITS WAY TO $6. 11/19/24Toncoin continues to rise in price. I believe that all related tokens will follow its lead, so I expect sharp and significant pumps from them. First and foremost, I'm looking forward to a pump for #NOT.
The nearest target for #TON is the $6 resistance level. We are 100% reaching this target this week!
Thus, I anticipate the asset's price will continue to grow and may reach $6, where it will face some resistance that will need to be broken for further growth.
We'll monitor the situation closely. If there are any changes, I will definitely provide updates.

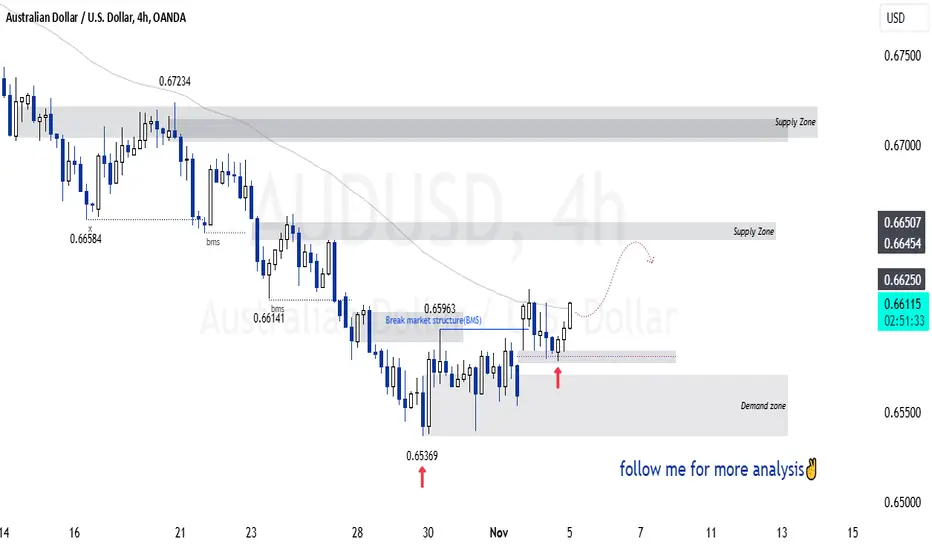
SasanSeifi| Will the Price Continue Its Short-Term Rise?In the 4-hour timeframe, as observed, the price entered a consolidation (range) phase after correcting around the 0.65500 price zone. It then broke previous highs at 0.65950. Following this structural break, the price returned to the gap zone and, supported at the 0.65800 level, experienced positive fluctuations with slight growth, currently trading at the 0.66000 level.
In the short term, it’s expected that the price could reach levels of 0.66250, 0.66450, and 0.66500, continuing this short-term upward trend toward these target zones. A possible scenario for the next price movement is that if it consolidates above 0.66000, the price may move upward in the short term towards the mentioned areas and supply zones.
To assess the continuation of this uptrend and anticipate future price behaviour, it’s essential to closely monitor price reactions at these levels. Key support areas in the 4-hour timeframe include 0.65800 and 0.65650.
💢This analysis is my personal viewpoint and not financial advice. If you found this helpful, please like and comment – I’d love to hear your thoughts! Happy trading! ✌😊
SasanSeifi| NZD/USD,4-Hour Hey there, ✌ In the short-term 4-hour timeframe, we’ve observed a bearish trend starting from the 0.63700 price range. The recent breakdown below the 0.62500 level has pushed the price down to the 0.62000 zone, showing some corrective movement.
Currently, the price is trading around 0.62000.my short-term outlook leans toward further downside towards targets at 0.61700 and the demand zone below.
However, if we see signs of weakening momentum around 0.62000, there is a possibility that the market could enter a ranging phase. In such a scenario, potential pullbacks could bring the price up to levels of 0.62350, 0.62500, and 0.62750 as a corrective move before resuming the bearish trend.
To better understand the market's direction, it’s crucial to monitor price reactions in these zones.
Alternative Scenario: Price Correction Another scenario to consider is continued price correction. In this case, we expect the price to make a corrective move towards our targets. If the market enters a range and confirms the price action, we could then see positive fluctuations from the specified targets and the demand zone.
This analysis is my personal viewpoint and not financial advice. If you found this helpful, please like and comment – I’d love to hear your thoughts! Happy trading! ✌😊

SasanSeifi| Can We Expect Short-Term Corrections?Hey there, ✌ In the short-term timeframe, we've observed that Bitcoin has surged from the $60,000 range to a high of $69,000. However, following this peak, the price has shown a negative reaction, undergoing a minor correction down to the $67,000 levels after a brief period of fluctuations.
Currently, the price has remained in a range after encountering the Exponential Moving Average (EMA) at the $67,000 mark. The significant resistance level ahead in the 4-hour timeframe lies between $67,750 and $68,500.
Analysing the chart in the lower timeframes, it appears that the price may be inclined to experience further corrections. If a candle closes below the $66,950 to $66,850 levels, we might witness a price correction down to the demand levels at $65,500, and potentially further to $64,250 to $63,000. Understanding how the price reacts to these levels will be crucial for assessing the ongoing trend. Additionally, if the price faces increased demand and breaks above the established resistance levels, the corrective scenario could be reconsidered. The potential trend is clearly outlined in the chart above.
💢 This is just my personal analysis, not financial advice. If you found this helpful, feel free to like and comment – I'd love to hear your thoughts! Happy trading! ✌😊

SasanSeifi| Key Levels to Watch in the 4-Hour TimeframeHey there, ✌ In the 4-hour timeframe, as observed on the chart OANDA:XAUUSD , gold's price has seen a minor rise after reaching the $2,600 level and is currently trading around $2,657.
In the short-term outlook, one possible scenario is that after encountering the $2,668 supply zone, the price may enter a consolidation phase, with a slight pullback toward the $2,650 and $2,646 levels. If we receive the necessary confirmation signals at this stage, we could potentially see a price rebound and continuation of the upward trend. To maintain this upward momentum, holding the support levels between $2,646 and $2,640 is crucial.
In case of further correction, it’s essential to monitor the price’s reaction to these support zones. If the price finds support at these levels, a new upward move towards the mentioned targets could start. However, if these supports fail, there is a possibility of prolonged consolidation or even a further price decline.
On the other hand, if sufficient buying pressure emerges and the price manages to stabilize above $2,670 and $2,675, the chances of further growth towards targets like $2,700, $2,710, and $2,720 will increase.
This analysis is my personal viewpoint and not financial advice. If you found this helpful, please like and comment – I’d love to hear your thoughts! Happy trading! ✌😊

SasanSeifi|Will 0.66800 - 0.66500 Support the Price Movement?Hey there, ✌ In the 4-hour timeframe, a downward trend is evident from the level of 0.69400. Currently, due to the breakdown of the significant support level at 0.68, the price has corrected to the liquidity zone of 0.67. If the momentum weakens in this price range and the level of 0.67 is maintained, we may witness a ranging trend with minor positive fluctuations. To better understand the continuation of the trend, attention should be given to the price's reaction at levels 0.67500, 0.67800, and 0.68.
Overall, our outlook leans more towards a decline and correction towards the target of 0.66800 and the demand zone at 0.66500. It is expected that the price will be able to correct to the desired support levels. Subsequently, if the price maintains the ranges between 0.66800 and 0.66500 and confirms it, we will enter a ranging phase with positive fluctuations. The potential trends are also illustrated in the image above.
⭕The important support levels are 0.66500–0.66.
💢 This is just my personal analysis, not financial advice. If you found this helpful, feel free to like and comment – I'd love to hear your thoughts! Happy trading! ✌😊

Bullish move to resume. 4Htoday the market was collecting liquidity to start moving up. given the cease fire in the conficts we heard. Watch this area for breakout. IF IT GETS REJECTED we shall be looking for a new all time high.

Gold 4H Pennant4H Bullish Pennant Pattern
Expecting NFP News to push Gold to new highs.
Fundamental & Technical Confluence.

DOUBLE TOP ON 4H and Stick sandwitch on dailyright now london is making the accumulation plhase. newyork is expected to distribut bearish supported by the technical analysis
trendline on 4h is broken as wellretesting as
20 ma crosed below 100

BTCUSDT Key Resistance ZoneBTCUSDT has recently reached a KEY RESISTANCE level on the 4 hour timeframe.
We've seen multiple rejections from this zone in past data, showing strength in the SHORT trade, where it may look to initiate a BEARISH trend.
The key to this movement is waiting for a definitive move via BIG VOLUME CANDLES, price could reject off the zone temporarily and retrace back to the resistance zone where it could break.
We need undeniable big volume indicating a rejection or breakout.
