Bitcoin Technical 4H - technical 2020/5/26there is a bullish divergence in 4H chart and we expect a rise in BTC price afterward.
4h

#JP225 Watch out for this Pump and Dump Move!OANDA:JP225USD Is setting up one more move to the upside targeting around 21300, where it is anticipate to be a pump and dump move.
Follow for more setups...
#AHMEDMESBAH

#AUDCAD [4H] Short Setup.SAXO:AUDCAD Might draw a pull back approaching last May's close.
#AHMEDMESBAH

#[BITCOIN] [W1+4H] 80% : 20% Short Anticipation Odd...BITSTAMP:BTCUSD Is inclined to a drop after an anticipated rise next week "Retest", Looking at this as it si heading back to Approx. 6500 again.
If this to work, then a head and shoulder pattern on weekly chart could be formed again for another push to the upside again.
Follow for more setups...
#AHMEDMESBAH

EURUSD looking for long entry 4H EURUSD is at critical level of daily support which also align with Fibonacci level of 78.6%. If this level holds we can expect move beck to recent highs of 1.1 area. Stops below recent lows.

EURUSD 1.0980 HOLDSThe euro currency has started to stabilize above the 1.0900 level against the US dollar after the pair found strong resistance from the 1.0980 level. Technical analysis shows that repeated failure to move price above the 1.0980 resistance level will generate a bearish signal for the EURUSD. In the near-term, buyers remain in control while price trades above the 1.0940 level.
The EURUSD pair is only bullish while trading above the 1.0900 level, key resistance is found at the 1.0940 and 1.0980 levels.
The EURUSD pair is only bearish while trading below the 1.0900 level, key support is found at the 1.0800 and 1.0770 levels.
Do your own analysis ...
Dont Forget Moving StopLoss At Breakeven
Disclaimer!
This post does not provide financial advice. It is for educational purposes only! You can use the information from the post to make your own trading plan for the market. You must do your own research and use it as the priority. Trading is risky, and it is not suitable for everyone. Only you can be responsible for your trading.

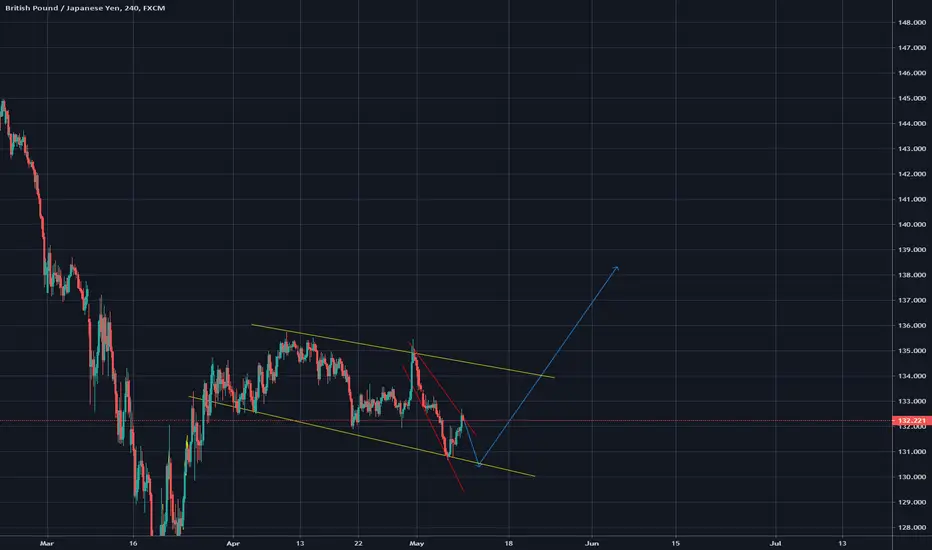
GBPJPY short tradeGood morning, GBPJPY rejected 132.00 , so now we are looking for short opportunities. i´m waiting for a clear confirmation pattern, I would like to see a retest of 132.00 before opening short, all the way down to 130.00/129.00/128.00; closing 1/3 lot size on each TP
This is my first published analysis, so thank you for spending you time on me
“Instead of wondering when your next vacation is, maybe you should set up a life you don't need to escape from.” Seth Godin

CADJPY 4H SHORT - 200 PIPS POSSIBLE MOVECurrently waiting for a 4H candle to close, looking to enter short at price above 77.00
SL 77.51
TP 75.00
may take some profits at 75.70
R:R - 1:4.3
200+ pips potentially to be made on this trade.

EURUSD - LONG 4HHoping for EURUSD to spike through the resistance level and reach 1.11500 as a long target. However, this also may retrace to 1.07000 if a reversal pattern occurs after this big bullish move.

Bitcoin Technical Analysis - 4H - 2020-05-18There seems to be a divergence between MACD histogram and bitcoin price in 4H chart. we can expect a decline in price to the specified levels.

#AUDJPY [4H] Risk-OFF Alert. [85% : 15%] A fall Anticipated...SAXO:AUDJPY Has failed several times last couple of weeks to break through the 70 mark. As risk aversion kicks in including recent tensions between US and China. A risk off mode might be brought into the market. This can reflex in a big way into SAXO:AUDJPY as AUD is 4th most expensive currency at the moment and kind of over bought considering the slow economy looming.
Here is a short setup for the upcoming week with a ratio of 85% to 15% in favor of short over long.
Follow for more ideas...
AHMEDMESBAH

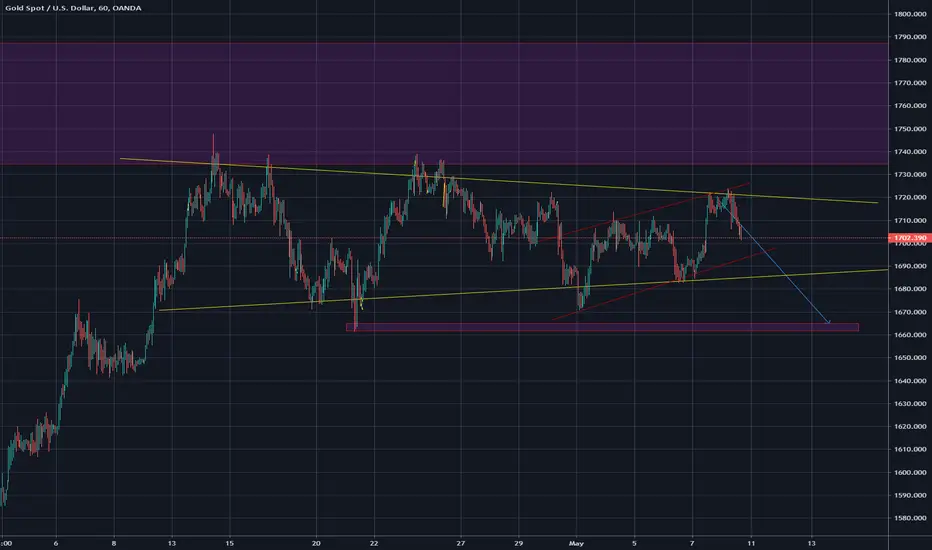
Ascending triangle Gold 4HThere is a clear ascending triangle on Gold right now with a strong resistance zone. Now we play the waiting game and see if there will be a breakout and retest. After that, we can take a long position.

#AUDNZD [4H] 95% : 5% Odd to The Downside from 1.085SAXO:AUDNZD Is trading within its maximum quarterly range when it is anticipated to fall as indicated on the chart. High potential fall from 1.08500 if it's spiked.
Follow for more setups...
#AHMEDMESBAH

Overview of the situation on Ethereum in the medium termAt the moment, the bearish wedge pattern is being formed on the 4-hour and 1-day timeframes (marked on the chart). I expect that the bears will be able to keep the price below the resistance level of 193.40-203.20$ and the correction will continue. I will look for an entry to the short based on what I have said, but it is also worth taking into account the local situation.

EURGBP BULLISH BATRSI is oversold, CSI is on the middle, but EUR is a bit sold more than GBP. The green line represent a historic support of the previous wave. 113xa as stoploss and a gold zone formed for 50 and 61 of fibonacci.

#AUDNZD [4H] 70% : 30% Odds. Q2 Goal Range Almost Reached...SAXO:AUDNZD Is now trading almost at the top of the current quarter goal. A bounce can be anticipated if today's unemployment didn't meet consensus.
#AHMEDMESBAH

#AUDSGD [4H] RISK-OFF May kick it downwards again...SAXO:AUDSGD Is sitting below a cluster of Weekly, Monthly and Annually Supply zones as well as a monthly downtrend extended since July 2017. If Risk-Off kicks in again then we might see a potential fall in this pair sliding smoothly to the nearest weekly demand zone @ 0.8700
Follow for more setups...
AHMEDMESBAH

XRP 4H LongWedge Forming On The Intraday Timeframes
Fibonacci From Daily, Await Retracements For Confirmation To Enter

Long GBPAUD - 4HOANDA:GBPAUD GBPAUD is currently on strong support, and it seems like it's going to have a trend reversal. RSI also indicates a support level, I am looking for an uptrend from here onwards, with multiple Take Profits. If it goes as per my prediction i will keep taking intermediate profits and keep moving stop losses upside.


Great NEOUSDT short trade opportunity on both 4h & D TFGreat NEOUSDT short trade opportunity on both 4h & D TF
Entry range (D): 9.070 - 9.698
Suggested risk: 3.5% capital
TP1 (D): 8.765 - 8.465
TP2 (D): 7.673 - 7.975
Stop Loss (D): 10.31
Entry range (4h): 9.271 - 9.493
Suggested risk: 2% capital
TP1 (4h): 9.046 - 8.944
TP2 (4h): 8.660 - 8.552
Stop Loss (4h): 9.848
Powered by BreakFree Trading
