Daily review of BTC interval 4HHello everyone, let's take a look at the BTC to USDT chart over the 4 hour timeframe. As you can see, the price is moving above the local uptrend line.
Let's start with the designation of the support line and as you can see the first support in the near future is $ 23,945, if the support breaks down, the next support is $ 23,754, $ 23,578 and $ 23,422.
Now let's move from the resistance line as you can see the first resistance is $ 24,258, if you can break it the next resistance will be $ 24,493, $ 24,690 and $ 24,882.
Looking at the CHOP indicator, we can see that in the 4-hour interval we have a lot of energy and the MACD indicator shows a local downward trend.
4hrchart

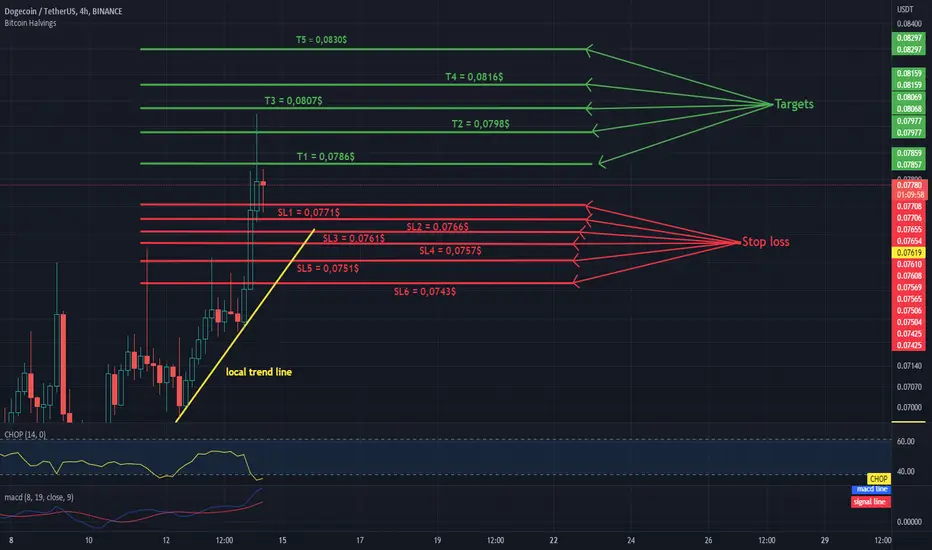
DOGEUSDT - review of the chart on the 4H intervalHello everyone, let's take a look at the 4H DOGE to USDT chart as you can see the price is moving above the local uptrend line.
Let's start by setting goals for the near future that we can consider:
T1 = $ 0.0786
T2 = $ 0.0798
T3 = $ 0.0807
T4 = $ 0.0816
and
T5 = $ 0.0830
Now let's move on to the stop loss in case of further market declines:
SL1 = $ 0.0771
SL2 = $ 0.0766
SL3 = $ 0.0761
SL4 = $ 0.0757
SL5 = $ 0.0751
and
SL6 = $ 0.0743
Looking at the CHOP indicator, we can see that in the 4H range the energy was used and the MACD indicator confirms the local upward trend.
Daily review of BTC interval 4HHello everyone, let's take a look at the BTC to USDT chart on a 4 hour timeframe. As you can see, the price is moving above the local uptrend line marked with the yellow line.
Let's start with the designation of the support line and as you can see the first support in the near future is $ 23,804, if the support breaks, the next support is $ 23,518, $ 23,292 and $ 23,077.
Now let's move from the resistance line as you can see the first resistance is $ 24,211, if you can break it the next resistance will be $ 24,713 and $ 26,168.
Looking at the CHOP indicator, we can see that in the 4-hour interval the energy has been used, and the MACD indicator shows a local upward trend.

USDCAD Local Buy from Support Welcome back! Let me know your thoughts in the comments!
**USDCAD - Listen to video!
We recommend that you keep this pair on your watchlist and enter when the entry criteria of your strategy is met.
Please support this idea with a LIKE and COMMENT if you find it useful and Click "Follow" on our profile if you'd like these trade ideas delivered straight to your email in the future.
Thanks for your continued support!
Brian & Kenya Horton, BK Forex Academy

USDCHF It will return to support Welcome back! Let me know your thoughts in the comments!
**USDCHF - Listen to video!
We recommend that you keep this pair on your watchlist and enter when the entry criteria of your strategy is met.
Please support this idea with a LIKE and COMMENT if you find it useful and Click "Follow" on our profile if you'd like these trade ideas delivered straight to your email in the future.
Thanks for your continued support!
Brian & Kenya Horton, BK Forex Academy

ETH rebounds after the last correction!Hello everyone, let's take a look at the 4H ETH to USDT chart as you can see the price is moving in the uptrend channel.
Let's start by setting goals for the near future that we can consider:
T1 - $ 1,679
T2 - $ 1,898
and
T3 - $ 2,175
Now let's move on to the stop loss in case of further market declines:
SL1 - $ 1,478
SL2 - $ 1,366
SL3 - $ 1272
SL4 - $ 1178
and
SL5 - $ 1,049
Looking at the CHOP indicator, we can see that in the 4H range, the energy we recovered was used for growth, while the MACD indicator clearly confirmed the change in the local trend.

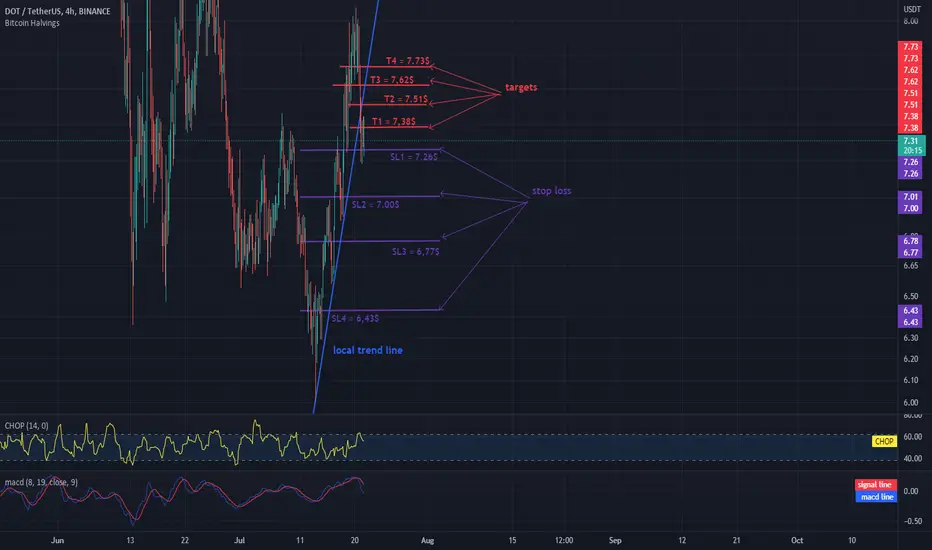
DOT SHORT 4H INTERVALHello everyone, let's take a look at the 4H DOT vs. USDT chart. As you can see, the price has dropped below the local uptrend line.
Let's start by setting goals for the near future that we can consider:
T1 = $ 7.38
T2 = $ 7.51
T3 = $ 7.62
and
T4 = $ 7.73
Now let's move on to the stop loss in case of further market declines:
SL1 = $ 7.26
SL2 = $ 7.00
SL3 = $ 6.77
and
SL4 = $ 6.43
Looking at the CHOP indicator, we can see that in the 4H range we still have a lot of energy, while the MACD indicator shows a local downward trend.
ETH / USDT 4HChart - Targets And StopLossHello everyone, let's take a look at the 4H ETH to USDT chart as you can see the price is moving above the local downtrend line.
Let's start by setting goals for the near future that we can consider:
T1 - $ 1,405
T2 - $ 1,527
and
T3 - $ 1704
Now let's move on to the stop loss in case of further market declines:
SL1 - $ 1,452
SL2 - $ 1,345
SL3 - $ 1,257
SL4 - $ 1167
and
SL5 - $ 1,038
Looking at the CHOP indicator, we can see that in the 4H range we have a lot of energy and the MACD indicator indicates entering a local downward trend.

ADA/USDT TARGETS AND STOPLOSS 4HHello everyone, let's take a look at the 4H ADA to USDT chart as you can see the price is moving above the local downtrend line.
Let's start by setting goals for the near future that we can consider:
T1 - $ 0.5362
T2 - $ 0.5672
T3 - $ 0.6126
and
T4 - $ 0.6695
Now let's move on to the stop loss in case of further market declines:
SL1 - $ 0.5151
SL2 - $ 0.4939
SL3 - $ 0.4763
SL4 - $ 0.4587
and
SL5 - $ 0.4333
Looking at the CHOP indicator, we can see that in the 4H range most of the energy has been used, and the MACD indicator shows a local upward trend.

DOT / USDT 4H CHART - fight the resistance!Hello everyone, let's take a look at the 4H DOT to USDT chart as you can see the price broke above the local downtrend channel and started a local uptrend.
Let's start by setting goals for the near future that we can consider:
T1 = $ 7.96
T2 = $ 8.49
T3 = $ 9.10
and
T4 = $ 9.94
Now let's move on to the stop loss in case of further market declines:
SL1 = $ 7.55
SL2 = $ 7.26
SL3 = $ 7.00
SL4 = $ 6.77
and
SL5 = $ 6.43
Looking at the CHOP indicator, we can see that in the 4H range we still have energy to continue the movement and the MACD indicator confirms the local upward trend.

BTC / USDT - 4HChartHello everyone, let's take a look at the BTC to USDT chart over the 4 hour timeframe. As you can see, the price is moving below the local uptrend line.
Let's start with the designation of the support line and as you can see the first support in the near future is $ 19,515, if the support breaks down, the next support is $ 18,675 and $ 17,619.
Now let's move on from the resistance line, as you can see, the first resistance that BTC is currently struggling with is $ 19,764, if you manage to break it, the next resistance will be $ 20,281 and $ 20,727.
Looking at the CHOP indicator, we can see that in the 4-hour interval the energy is slowly increasing and the MACD indicator shows that we have entered the local upward trend.

4 HR ETH/USDT Bottom Is InWe see a very similar setup on ETH as we do with SOL. RSI fed into to buy zone, at historical support, lower bollinger needs relief, etc.

4 HR SOL/USDT Bottom Is InJust wanted to post a basic beginner style chart for people to easily be able to identify with.
4 hr SOL/USDT chart shows us the RSI has made it into my buy zone and is currently making a bullish turn. We have been on following lower bollinger bands for 16 straight candles with only 6 confirmed bullish candles in this same span. Bottomed RSI, bounce near local support should cause a bounce to test historical resistance.

BTC on a 4 hour interval SHORT!Hello everyone, let's take a look at the BTC to USDT chart over the 4 hour timeframe. As you can see, price is moving above the local uptrend line.
Let's start with the designation of the support line and as you can see the first support in the near future is $ 19,599, if the support breaks down, the next support is $ 18,803.
Now let's move from the resistance line as you can see the first resistance is $ 20,263, if you can break it the next resistance will be $ 20,699, $ 55,2,040, $ 21,423 and $ 21,919.
Looking at the CHOP indicator, we can see that in the 4-hour interval the energy has been used and the MACD indicator shows that we are continuing the local downward trend.

XRP / USDT SHORT 4HHello everyone, let's take a look at the 4H XRP to USDT chart as you can see the price is moving below the local downtrend line.
Let's start by setting goals for the near future that we can consider:
T1 - $ 0.3199
T2 - $ 0.3275
T3 - $ 0.3335
T4 - $ 0.3393
and
T5 - $ 0.3481
Now let's move on to the stop loss in case of further market declines:
SL1 - $ 0.3079
SL2 - $ 0.3039
SL3 - $ 0.2976
and
SL4 - $ 0.2912
Looking at the CHOP indicator, we can see that in the 4H range the energy is slowly rising, while the MACD indicator shows a local downward trend, however the blue line is approaching the red line, if it crosses it from the bottom, it may confirm the upward trend change.

BTC SHORT 4H INTERVALHello everyone, let's take a look at the BTC to USDT chart over the 4 hour timeframe. As you can see, price is moving above the local uptrend line.
Let's start with the designation of the support line and as you can see the first support in the near future is $ 21,558, if the support breaks down, the next support is $ 21,397 and $ 21,187.
Now let's move from the resistance line as you can see the first resistance is $ 21853, if you can break it the next resistance will be $ 22,018, $ 22,018 and $ 22,244.
Looking at the CHOP indicator, we can see that in the 4-hour interval we have a lot of energy and the MACD indicator shows that we are in a local upward trend.

BTC in a local downtrendHello everyone, let's take a look at the BTC to USDT chart over the 4 hour timeframe. As you can see, price is moving above the local uptrend line.
Let's start with the designation of the support line and as you can see the first support in the near future is $ 19,639, if the support breaks down, the next support is $ 19,441 and $ 19,150.
Now let's move from the resistance line as you can see the first resistance is $ 19,755, if you can break it the next resistance will be $ 19,886, $ 20,022 and $ 20,230.
Looking at the CHOP indicator, we can see that in the 4-hour interval the energy is slowly increasing and the MACD indicator indicates entering a local downward trend.

BTC DAY SHORT 4HHello everyone, let's take a look at the BTC to USDT chart over the 4 hour timeframe. As you can see, the price moves in the channel marked with the blue lines.
Let's start with the designation of the support line and as you can see the first support in the near future is $ 18551, if the support breaks down, the next support is $ 17,634.
Now let's move from the resistance line, as you can see, the first resistance is $ 19394, if you can break it, the next resistance will be $ 19,880, $ 20,264 and $ 20,643.
Looking at the CHOP indicator, we can see that we have a lot of energy in the 4-hour interval, and the MACD indicator shows a local uptrend.

DOGE/USDT TARGETS AND STOPLOSSHello everyone, let's take a look at the 4H DOGE to USDT chart as you can see the price is moving below the local uptrend line.
Let's start by setting goals for the near future that we can consider:
T1 = $ 0.06843
T2 = $ 0.07035
T3 = $ 0.07241
T4 = $ 0.07513
and
T5 = $ 0.07849
Now let's move on to the stop loss in case of further market declines:
SL1 = $ 0.06391
SL2 = $ 0.06040
SL3 = $ 0.05544
and
SL4 = $ 0.04919
Looking at the CHOP indicator, we can see that in the 4H range we have a lot of energy for the next move, while the MACD indicator shows a local upward trend.

BTC SHORT 4HHello everyone, let's take a look at the BTC to USDT chart over the 4 hour timeframe. As you can see, the price is above the local downtrend line.
Let's start with the designation of the support line and as you can see the first support in the near future is $ 19,116, if the support breaks down, the next support is $ 18,615.
Now let's move from the resistance line as you can see the first resistance is $ 19,433, if you can break it the next resistance will be $ 19,719 and $ 19,951.
Looking at the CHOP indicator, we can see that in the 4-hour interval some energy has been used, but we have some to continue the movement, and the MACD indicator shows a local uptrend.

SHIB/USDT SHORT 4HHello everyone, let's take a look at the 4H SHIB to USDT chart as you can see the price is moving below the local downtrend line.
Let's start by setting goals for the near future that we can consider:
T1 - $ 0.00001016
T2 - $ 0.00001055
T3 - $ 0.00001084
T4 - $ 0.00001116
and
T5 - $ 0.00001160
Now let's move on to the stop loss in case of further market declines:
SL1 - $ 0.00000987
SL2 - $ 0.00000964
SL3 - $ 0.00000925
SL4 - $ 0.00000904
and
SL5 - $ 0.00000820
Looking at the CHOP indicator, we can see that in the 4H range we have a lot of energy, and the MACD indicator shows a local upward trend, but the blue line is close to the red line, if it crosses it from the top, it can confirm the trend change.

BTC SHORT INTERVAL 4HHello everyone, let's take a look at the BTC to USDT chart over the 4 hour timeframe. As you can see, the price is moving below the local downtrend line.
Let's start with the designation of the support line and as you can see the first support in the near future is $ 19,121, if the support breaks down, the next support is $ 18,629.
Now let's move from the resistance line as you can see the first resistance is $ 19,443, if you can break it the next resistance will be $ 19,716, $ 19,943 and $ 20,167.
Looking at the CHOP indicator, we can see that in the 4-hour interval we are slowly starting to regain energy and the MACD indicator indicates entering the local upward trend.

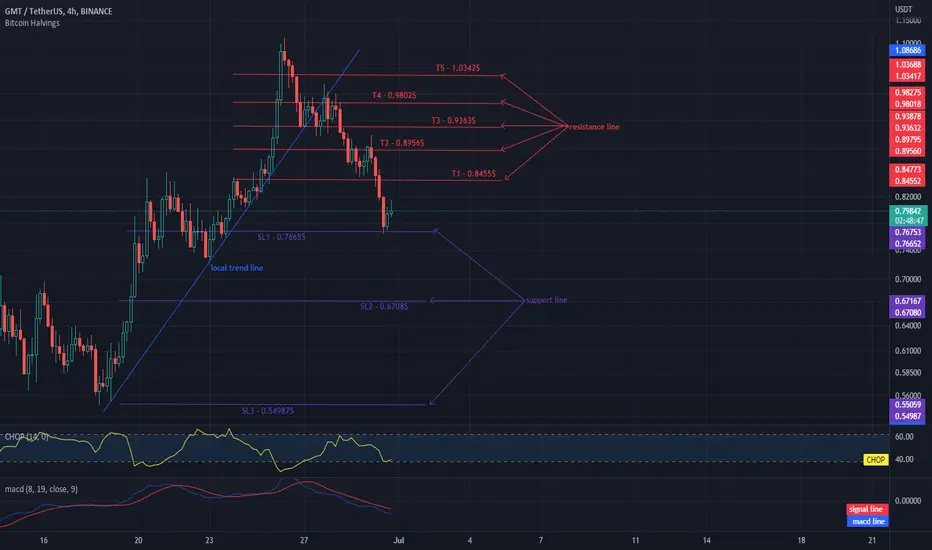
GMT - TARGETS AND STOPLOSS 4HHello everyone, let's take a look at the 4H GMT to USDT chart as you can see the price is moving below the local uptrend line.
Let's start by setting goals for the near future that we can consider:
T1 - $ 0.8455
T2 - $ 0.8956
T3 - $ 0.9363
T4 - $ 0.9802
and
T5 - $ 1.0342
Now let's move on to the stop loss in case of further market declines:
SL1 - $ 0.7665
SL2 - $ 0.6708
and
SL3 - $ 0.54987
Looking at the CHOP indicator, we can see that in the 4H range the energy is depleted and the MACD indicator shows a downward trend.