EURJPY Potential Symmetry 4h1. Fib Channel - price action potentially inside of fib channel
2. AB=CD - potential AB=CD structure inside of channel. AB handle of 95 bars, potential symmetry with CD handle of 95 bars
3. Fib Projection - AB handle with 100% fib projection, CD handle potential 100% fib projection
4. Date & Price Range - symmetry between the 2 bearish moves within AB handle (25 bars/6days + 526 point drops). Potential symmetry between 2 bearish moves in CD handle
5. Price Target - watching bearish push down to resistance turned support and all of the above CD handle projections at 137.20 - 138.00 range
4hrchart

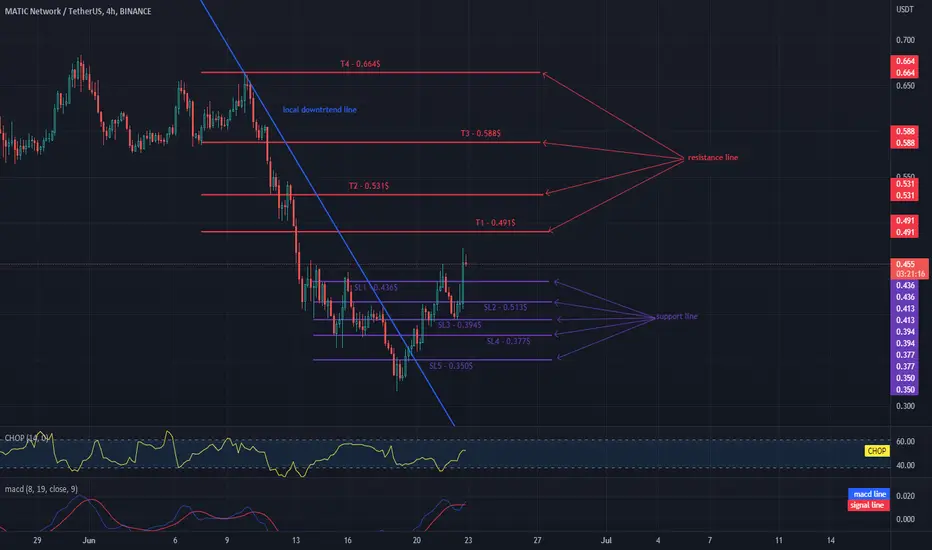
MATIC in the local uptrend!Hello everyone, let's take a look at the 4H MATIC to USDT chart as you can see the price has come above the downtrend line.
Let's start by setting goals for the near future that we can consider:
T1 - $ 0.491
T2 - $ 0.531
T3 - $ 0.588
and
T4 - $ 0.664
Now let's move on to the stop loss in case of further market declines:
SL1 - $ 0.436
SL2 - $ 0.513
SL3 - $ 0.394
SL4 - $ 0.377
and
SL5 - $ 0.350
Looking at the CHOP indicator, we can see that in the 4H range we collect more and more energy, and the MACD indicator shows that we are in a local upward trend
The BTC price has returned above ATH from the bull marketHello everyone, let's take a look at the BTC to USDT chart over the 4 hour timeframe. As you can see, the price broke above the local downtrend line.
Let's start with the designation of the support line and as you can see the first support in the near future is $ 20,763, if the support collapses, the next ones are $ 20,208, $ 19,671 and $ 19,169.
Now let's move from the resistance line as you can see the first resistance is $ 21,176, if you can break it the next resistance will be $ 22,121 and $ 23,361.
Looking at the CHOP indicator, we can see that in the 4-hour period we have more and more energy for a new move, and the MACD indicates that we are in a local uptrend.

WILL LUNC / BUSD BEAT THE TARGETSHello everyone, let's take a look at the 4H LUNC to BUSD chart as you can see the price is approaching exiting the channel marked with the blue lines.
Let's start by setting goals for the near future that we can consider:
T1 = $ 0.00005988
T2 = $ 0.00006536
T3 = $ 0.00006958
T4 = $ 0.00007394
and
T5 = $ 0.00008027
Now let's move on to the stop loss in case of further market declines:
SL1 = $ 0.00005115
and
SL2 = $ 0.00004089
Looking at the CHOP indicator, we can see that in the 4H range we still have some energy, while the MACD indicates that we are maintaining the local upward trend.

BTC returns to around $ 20,000Hello everyone, let's take a look at the BTC to USDT chart over the 4 hour timeframe. As you can see, the price is moving below the local downtrend line.
Let's start with the designation of the support line and as you can see the first support in the near future is $ 19,761, if the support breaks down, the next ones are $ 19,345, $ 18,945, $ 18,345 and $ 17,606.
Now let's move from the resistance line as you can see the first resistance is $ 20,961, if you can break it the next resistance will be $ 21,869 and $ 23,007.
Looking at the CHOP indicator, we can see that in the 4-hour interval we still have energy for the next move, and the MACD indicator shows a local uptrend.

EURUSD I Key Levels to Watch this Week!Welcome back! Here's an analysis of this pair!
**EURUSD - Listen to video!
We recommend that you keep this pair on your watchlist and enter when the entry criteria of your strategy is met.
Please support this idea with a LIKE and COMMENT if you find it useful and Click "Follow" on our profile if you'd like these trade ideas delivered straight to your email in the future.
Thanks for your continued support!
Brian & Kenya Horton, BK Forex Academy

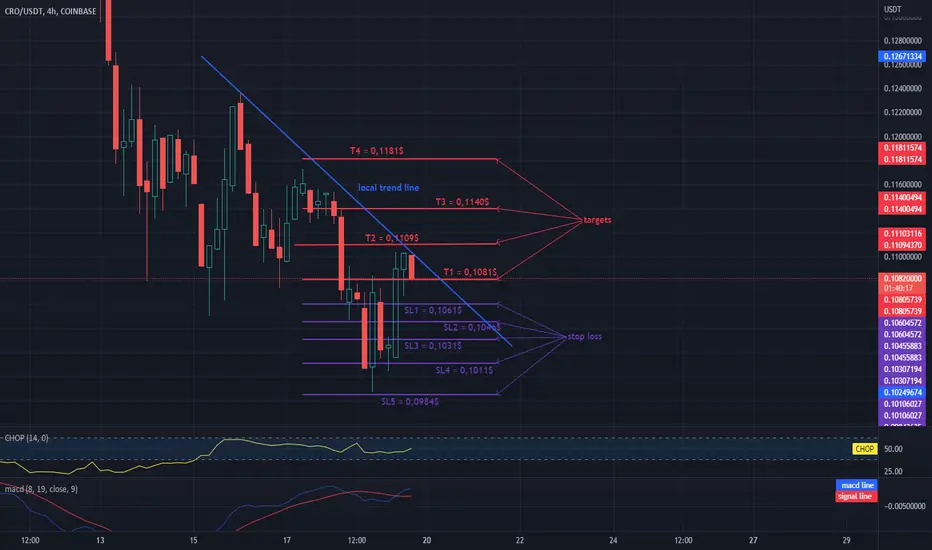
LOCAL REFUND OF THE PRICE CROHello everyone, let's take a look at the 4H CRO to USDT chart as you can see the price is moving below the local downtrend line.
Let's start with setting targets for the near future that we can take into account:
T1 = $ 0.1081
T2 = $ 0.1109
T3 = $ 0.1140
and
T4 = $ 0.1181
Now let's move on to the stop loss in case of further market declines:
SL1 = $ 0.1061
SL2 = $ 0.1046
SL3 = $ 0.1031
SL4 = $ 0.1011
and
SL5 = $ 0.0984
Looking at the CHOP indicator, we can see that at the 4H interval, the energy slowly begins to increase, while the MACD indicator indicates a local upward trend.
ETH at lower and lower levels, before support.Hello everyone, let's take a look at the ETH to USDT chart over the 4 hour timeframe. As you can see, the price is moving below the downtrend line.
Let's start with the designation of the support line and as you can see the first support in the near future is $ 1509, if the support breaks down, the next one is $ 1181 and $ 864.
Now let's move from the resistance line as you can see the first resistance is $ 1694, if you can break it the next resistance will be $ 1784, $ 1859, $ 1929 and $ 2043.
Looking at the CHOP indicator, we can see that in the 4-hour interval the energy has been used, while the MACD indicator shows a downward trend.

FTM/USDT - SHORT!Hello everyone, let's take a look at the FTM to USDT chart over the 4 hour timeframe. As you can see, the price is approaching the exit of the designated channel.
Let's start with the support line and as you can see the first support which is currently trading at $ 0.3000, if the support breaks down, the next one is $ 0.2395.
Now let's move from the resistance line as you can see the first resistance is $ 0.3570, if you manage to break it the next resistance will be $ 0.3883, $ 0.4133 and $ 0.4389.
Looking at the CHOP indicator, we can see that in the 4-hour range most of the energy has been used, and the MACD indicator shows that we have entered a local downward trend.

DOT in a local downtrend!Hello everyone, let's take a look at the DOT to USDT chart over the 4 hour timeframe. As you can see, the price is moving on the local channel.
Let's start with the line of support, and as you can see, the first support that is currently trading at is $ 8.58, if the support breaks down, the next is $ 8.27 and $ 7.31.
Now let's move from the resistance line as you can see the first resistance is $ 9.34, if you can break it the next resistance will be $ 9.83, $ 10.21 and $ 10.61.
Looking at the CHOP indicator, we can see that in the 4-hour interval some energy has been used, and the MACD indicator clearly shows when we entered the local downward trend (where the red line crossed the blue line from above).

BTC correction stops with support!Hello everyone, let's take a look at the BTC to USDT chart over the 4 hour timeframe. As you can see, the price is moving in the sideways trend channel.
Let's start with the designation of the support line and as you can see the first support where the price is currently at is $ 28,890, if the support breaks down, the next one is $ 27,885 and $ 26,665.
Now let's move from the resistance line as you can see the first resistance is $ 29,698, if you can break it the next resistance will be $ 30,209, $ 30,621, $ 31,049 and $ 31,643.
Looking at the CHOP indicator, we can see that in the 4-hour interval most of the energy has already been used, while the MACD indicator shows a local downward trend.

SOL moves below the downtrend lineHello everyone, let's take a look at the SOL versus USDT chart over the 4 hour timeframe. As you can see, the price is moving below the local downtrend line.
Let's start with the designation of the support line and as you can see the first support in the near future is $ 39.26, if the support breaks down, the next one is $ 37.66 and $ 35.69.
Now let's move from the resistance line as you can see the first resistance is $ 40.57, if you can break it the next resistance will be $ 42.06, $ 43.49 and $ 45.69.
Looking at the CHOP indicator, we can see that in the 4-hour interval we have a lot of energy, while despite the price fluctuations, the MACD indicator shows a local upward trend.

BTC continues the sideways trendHello everyone, let's take a look at the BTC to USDT chart over the 4 hour timeframe. As you can see, price is moving above the local uptrend line.
Let's start with the designation of the support line and as you can see the first support in the near future is $ 29,554, if the support breaks down, the next one is $ 28,889 and $ 27,922.
Now let's move from the resistance line as you can see the first resistance is $ 29,977, if you can break it the next resistance will be $ 30,430, $ 30,823 and $ 31,186.
Looking at the CHOP indicator, we see that in the 4-hour interval the energy has been used up and we start to collect new energy.

BTC accumulates with supportHello everyone, let's take a look at the BTC to USDT chart over the 4 hour timeframe. As you can see, price is moving above the local uptrend line.
Let's start with the designation of the support line and as you can see the first support in the near future is $ 29,683, if the support breaks down, the next one is $ 28,968 and $ 28,004.
Now let's move from the resistance line as you can see the first resistance is $ 30009, if you can break it the next resistance will be $ 30,476, $ 30,833, $ 31,222 and $ 31,751.
Looking at the CHOP indicator we can see that in the 4-hour interval some energy has been used up, but we have a little bit to continue the movement. On the other hand, the MACD indicator shows a local upward trend.

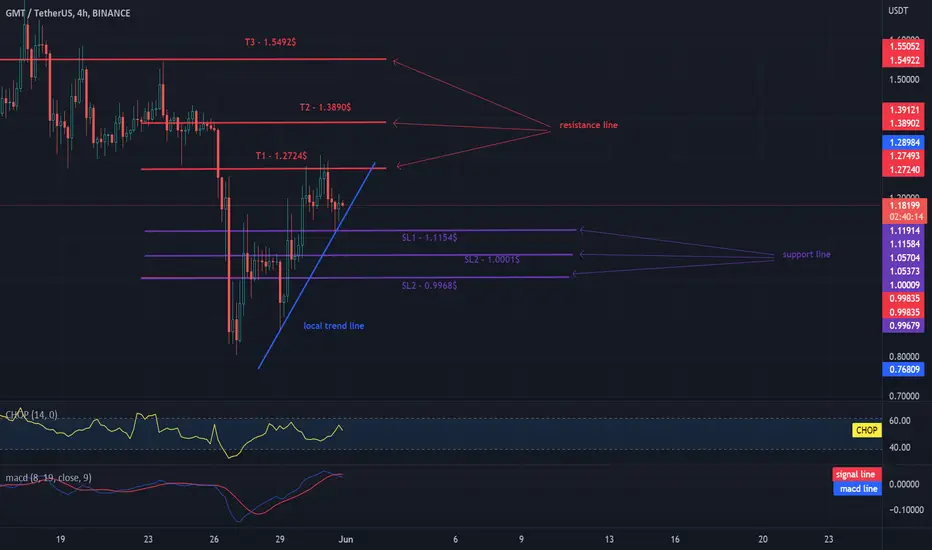
GMT has rebounded from resistance and is gaining energy. 4HCHARTHello everyone, let's take a look at the GMT to USDT chart over the 4 hour timeframe.
As you can see, the price is moving above the local trendline.
Let's start by identifying the stop loss we have in the near future:
SL1 - $ 1.1154
SL2 - $ 1,0001
SL2 - $ 0.9968
Now let's move on to the goals we may consider:
T1 - $ 1.2724
T2 - $ 1.3890
T3 - $ 1.5492
Looking at the CHOP indicator, we can see that in the 4H interval we have a lot of energy for the next move, while in the MACD indicator we see that the blue line crosses the red one from above, which could potentially lead to a further decline in the price.
Be careful and use stoploss in the short-term game.
BTC broke the resistance.Hello everyone, let's take a look at the BTC to USDT chart over the 4 hour timeframe. As you can see, the price came out of the triangle top.
Let's start with the designation of the support line and as you can see the first support in the near future is $ 31,391, if the support breaks down, the next ones are $ 30,719 and $ 30,249 and $ 29,711.
Now let's move from the resistance line as you can see the first resistance is $ 33,373, if you can break it the next resistance will be $ 34,952 and $ 37,170.
Looking at the CHOP indicator, we can see that in the 4-hour interval most of the energy has been used for the current price increases.

ETH behaves similar to BTCHello everyone, let's take a look at the ETH to USDT chart over the 4 hour timeframe. As you can see, the price is moving in the downtrend channel.
Let's start with the designation of the support line and as you can see the price has remained in the fundamental support zone which is between $ 1,856 and $ 1,694. in the current situation we have support at $ 1883 and then there is a support zone.
Now let's move from the resistance line as the first resistance is $ 1,936, if you can break it the next resistance will be $ 1,990 and $ 2,069.
Looking at the CHOP indicator, we can see that in the 4-hour interval, the collected energy was nicely used to increase the price, and the MACD indicator shows that we are in an uptrend locally.

BTC is dynamically returning to around $ 30,500Hello everyone, let's take a look at the BTC to USDT chart over the 4 hour timeframe. As you can see, the price came out of the triangle you created.
Let's start with the designation of the support line and as you can see the first support in the near future is $ 30,413, if the support breaks, the next one is $ 29,688 and $ 29,114 and $ 28,541.
Now let's move from the resistance line as you can see the first resistance is $ 31,802, if you can break it the next resistance will be $ 33,371 and $ 34,941.
Looking at the CHOP indicator, we can see that in the 4-hour interval, the collected energy was nicely used to increase the price, and the MACD indicator shows that we are in an uptrend locally.

BTC is quickly returning to around $ 29,600 after falling to $ 2Hello everyone, let's take a look at the BTC to USDT chart over the 4 hour timeframe. As you can see, the price moves sideways in the channel defined by the blue lines.
Despite the fact that today we saw a decline to around $ 28,000, the price quickly returned to around $ 29,600.
Let's start with the designation of the support line and as you can see the first support in the near future is $ 29,098, if the support breaks down, the next one is $ 28,520 and $ 27,724.
Now let's move from the resistance line as you can see the first resistance is $ 29,677 which price is currently struggling with, if it can be broken the next resistance will be $ 30,372 and $ 31,399.
Looking at the CHOP indicator, we can see that we still have a lot of energy in the 4-hour interval, be careful in the hours ahead.
MATIC on 4H interval, target and stop lossHello everyone, let's take a look at the MATIC to USDT chart over the 4 hour timeframe. As you can see, the price is moving below the local downtrend line.
Let's start with determining the stop loss that we should take into account in the short term and, as you can see, we can set the following stop loss:
SL1 - $ 0.629
SL2 - $ 0.597
SL3 - $ 0.557
Now it is worth going to the targets that we should take into account when playing short-term, we see individual targets:
T1 - $ 0.689
T2 - $ 0.747
T3 - $ 0.804
Looking at the CHOP indicator we can see that in the 4-hour interval some energy has been used up, but we have a little bit to continue the movement.
However, please remember that the market can be dynamic and you should always be careful with the market and analysis.
Will BNB stay above the current support?Hello everyone, let's take a look at the BNB to USDT chart over the 4 hour timeframe. As you can see, the price is moving below the local downtrend line.
Let's start with the designation of the support line and as you can see the first support in the near future is $ 290, if the support breaks down, the next one is $ 277 and $ 266 and $ 255.
Now let's move from the resistance line as you can see the first resistance is $ 317, if you can break it the next resistance will be $ 339 and $ 371 and $ 414.
Looking at the CHOP indicator, we can see that in the 4-hour interval we have a lot of energy, but the MACD indicator shows that the blue line is under the red line, which may result in a downward trend.

US30 4HIn my opinion we will go up in the next weeks ahead us.First target is above 32757 . Second target will be above 34135 and the final target will be 34947 to 35188. So I will go long for swing.

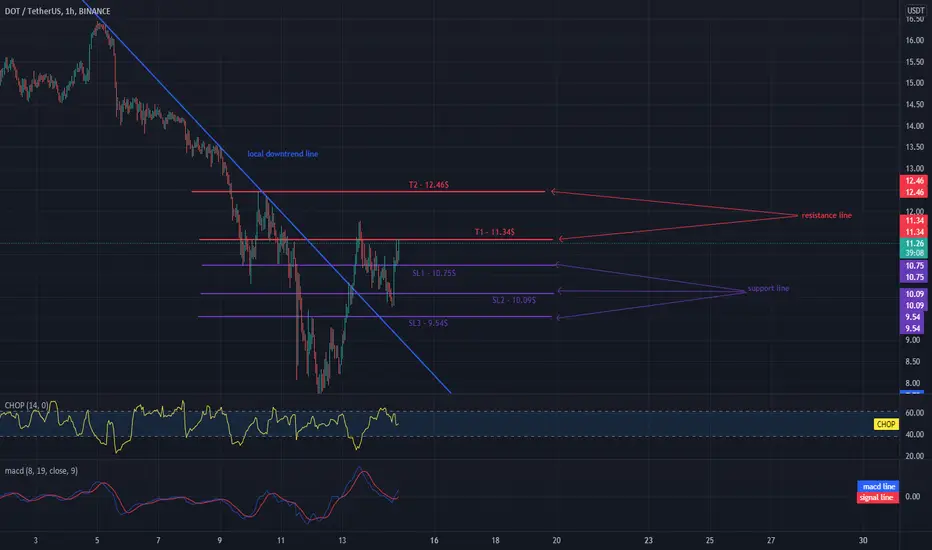
Will DOT handle the first target?Hello everyone, let's take a look at the DOT to USDT chart over the 1 hour timeframe. As you can see, the price broke above the local downtrend line.
It is worth starting with determining the stop loss that we should take into account in the coming hours. As you can see, we chose 3 stop loss: SL1 - $ 10.75, SL2 - $ 10.09, SL3 - $ 9.54.
Now let's move on to determining the targets that the price has in front of it and as you can see, the first one is at T1 - $ 11.34 with which the price is currently fighting, the next one is at T2 - $ 12.46.
Looking at the CHOP indicator we can see that in the 1 hour interval some energy has been used up, but we have a little bit to continue the movement. On the other hand, the MACD indicator shows an upward trend.