Invers H&S in making on 4HHello traders,
by the look on the 4h chart, it seems very likely, we are making inverse Head & Shoulders pattern, which is maybe one of the only patterns bitcoin really follows most of the times. If thats going to work out, we should make another shoulder down to around 8750/8900 area and when price go back up to 9150/9250 and brake the neck area, we should get to at least 9700/9800. Depending on how strong this move gets at that point, if bulls are strong enough, they may try to test the 10k area again. Lets see.
Can it be, what bulls need now? Or bears will take over and take us lower? Let me know, what you think, in comments. Thank you.
This is not a trading advice!
4hrchart

Supply and Demand On EURJPY >>4 Hr ChartThe daily trend go to be a uptrend and trend is changing from downtrend to uptrend so what will happen show up in the chart
the price will retest then go to down support level then after go to uptrend

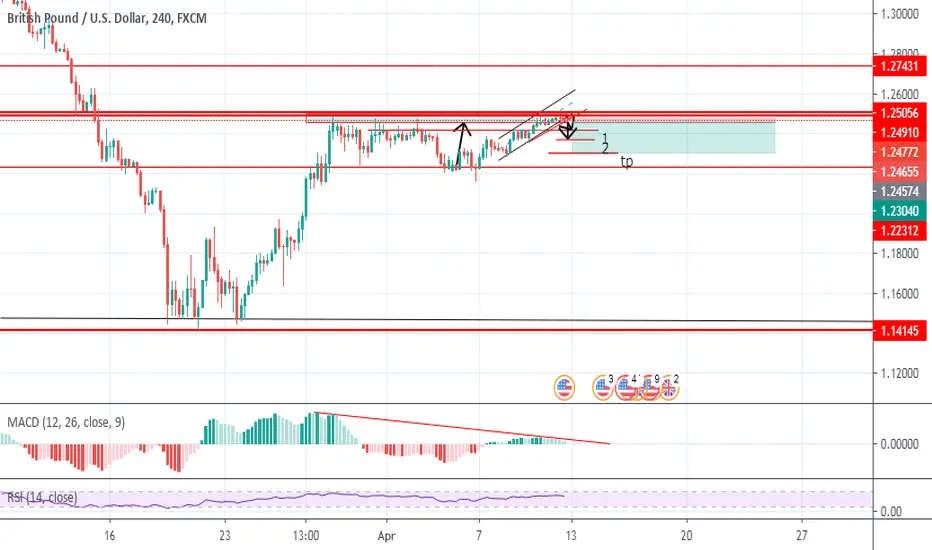
XMRUSDCup and handle pattern on the 4hr. Price has retraced back to the Kijun-Sen. Entry is above latest down fractal . Target is a 1.272. Not advice.

TRON potentially clawing itself up off the ground???After being down in the dirt for so long TRXBTC may be showing bullish signs for a potential reversal!
Slowly but surely TRX has been building an upwards channel which is now looking like it is turning into a higher TF ascending triangle pattern.
IDEAL bull entries would be break of triangle before re-testing to confirm support at 200SAT level. If strong support is shown will be looking
at candlestick formations to enter off bullish engulfing candles on 4HR TF.
Short term play is also possible if Darvis box is formed for internal trend trading.
TP's once triangle is broken, we would be looking at previous structure, TP's at 215, 226, 235 with final TP at 260 for full retracement.
If full retracement occurs, cup & handle formation may be a possibility for longer term bullish play.
LEARN TA! At MBA we teach technical analysis from the basics up, learn to trade with our veteran traders with a community of 200+ other traders;
Link in profile description!

GBP/JPY SHORT (4H)Starting the analysis off from the 26th March after the big push up. There were more buyers overpowering the sellers at this time which meant our resistance line was broken and became our new support line (new support @ 132.529) and having a new resistance line at 134.705.
It then formed a sideways channel bouncing off both our new support and resistance up until the 5th April. From the 5th April, an upwards channel was formed, buyers were still buying into the pair pushing it at a newer high of 135.750
Since the 9th April, the 4H chart is clearly showing that the momentum of the pair has now started to slow down forming yet another sideways channel, indicating and confirming to us that not much price movement is happening and that not many buyers or sellers are jumping into the market and are probably waiting on more confirmation to either sell or buy the currency pair.
Momentum has now slowed right down and the sideways channel’s support (134.572) has been broke, which has now started a reversal movement. As you can see from the chart, on the 15th April sellers started to come in, pushing the price movement down and creating a new support line @ 133.696. From the 15th April to the 17th April, Friday evening the candlesticks have started to form a Symmetrical Triangle which could indicate a Bearish Movement.
My entry to go Short on this pair will be after the new support line has been broken and a strong bearish movement is in place. My Stop Loss will be set at around 134.993 and I will have 3 TP zones. 1TP – 132.529 , 2TP – 131.489 & 3TP – 128.380.
** PLEASE NOTE ** - THIS IS MY OWN ANALYSIS ON THE GBP/JPY PAIR.

GBPUSDWell, if the market opens, I have this expectation from the pound currency to the dollar
Observe the limit
Successful and profitable
Must keep a close eye on this potential 4hr chart H&S patternif this H&S pattern triggers the breakdown target is 6k. Odds are if this pattern triggers we will also trigger the 1day chart rising wedge pattern that has a breakdown target of 4.3k or so. Hopefully this will only be a fakeout but these asymmetrical patterns love to trigger and catch everyone off guard by surprise so we must play close attention to it here and as always only act on obvious confirmation of a breakdown...it could easily send a couple wick s under the neckline without confirming so as always tread cautiously until absolute confirmation.

Bearish BAT AUDCAD - 4hr chartBearish BAT spotted in AUDCAD
TP1: 0.8637
TP2: 0.8416
SL: 0.9128
To open position when price touches: 0.8987
Optimal entry if BAT completes by 31 Mar but not after 10 April.

O que será que as Bandas de Bollinger irão fazer a seguir?!No gráfico com velas de 4 horas, estou reparando uma indicação de baixa no MACD, ao passo que as Bandas de Bollinger estão se estreitando, e o preço está usando a Média Móvel (linha vermelha central das bandas azuis) como suporte!
Sempre que as Bandas de Bollinger se estreitam de forma convergente como está acontecendo, é sinal de que um movimento relativamente grande está prestes a acontecer!
Vou manter o olho aberto pra ver o que acontece nas próximas 12-24 horas, especialmente porque o MACD do gráfico com velas diárias está indicando força de alta!
Pra que direção vocês diriam que o movimento do preço tem mais probabilidade de seguir?
AVISO LEGAL: conteúdo com proósito de informação, e não deve ser considerado conselho financeiro.


GBP/USD 4H SHORTGBP/USD May fall 100+ pips
Insight - Due to fundamental events, price has hit an extreme low, breaking the support of the monthly descending channel. Support now at 1.1434 and resistance at 1.1808
Intraday - 4H
Trade: Sell
Sell or Below 1.1434
Target TP: 1.1296 & 1.1133
Alternative scenario:
Trade: Buy
Buy or Above: 1.1434
Target TP: 1.1808 & 1.2031
Pivot and Support 1.1434

Bearish Gartley - CHFJPY (4h chart)Bearish Gartley spotted in CHFJPY in the 4-hr chart
TP1:112.79 (89pips)
TP2: 112.24 (144pips)
SL: 114.78 (-110pips)
Open position at: 113.68

Bearish ABCD - GBPNZD (4hr chart)Potential ABCD spotted in GBPNZD in the 4-hr chart
TP1: 2.0365 (485pips)
TP2: 2.0067 (783pips)
SL: 2.0952(-102pips)
Open position at: 2.0850

Bearish ABCD - GBPAUD 4-hr chartPotential ABCD setup in GBPAUD (4hr-chart)
TP1: 1.9632 (485pips)
TP2: 1.9334 (783pips)
SL: 2.0467 (-350pips)
Open position at: 2.0117
Could be a very profitable trade - I will watch closely on this price.

Bullish BAT AUDNZD - 4hr chartA Potential Bat spotted on 4H AUDNZD (it might be a long wait - about 97 pips to wait for price to touch PRZ). Am expecting a bearish candle on open when market opens on 24 Feb (Mon).
TP1: 1.0397 (40pips)
TP 2: 1.0438 (78pips)
SL: 1.0285 (-72pips)
To open position at 1.0357
Expected optimal completion at 27 feb , 11pm SGT
16 Mar, 9am SGT will deem the pattern invalid.

Bullish ABCD NZDJPY - 4hr chartPotential Bullish ABCD spotted in NZDJPY in 4-hour chart.
TP1: 69.92 (210pips)
TP2: 71.22 (34opips)
SL: 66.71 (-111pips)
Expected D point to touch price point before 4 Mar 2020 at 67.82 (to open trade)

Bullish ABCD - NZDSGD (4-hr chart)Bullish ABCD spotted in this rare pair NZDSGD in 4-hour chart
TP1: 0.8842 (146pips)
TP2: 0.8932 (236pips)
SL: 0.8606 (-90pips)
Expected completion by 3 April 2020
To open trade at: 0.8696

Bearish Bat AUDJPY - 4-hour chartPotential BAT spotted in AUDJPY in 4-hour chart.
TP1: 74.50
TP2: 73.70
SL: 76.60
Open Trade after BAT completes at 75.78
Expected completion by 18 Mar 2020.

Bullish ABCD pattern - CADCHF (4hr chart)Bullish ABCD pattern spotted in CADCHF 4-hr chart
TP1: 0.7302 (96pips)
TP2: 0.7370 (164pips)
SL: 0.7159 (-47pips)
Open position at: 0.7206

Possible Cup & Handle or Double Top now forming?We can see here on the 4hr chart how the recent bullish breakout has reached the exact same height we reached on January 19th of 9190 before retracing opening up the possibilities here for both a cup and handle(bullish) or a double top(bearish. Currently I think the cup and handle has a higher probability of occurring. I anticipate that we will probably retrace to around 8.5k to fill the cme future gap before rebounding here. We could go lower but I'm not worried about a double top unless we find a way to break below the descending pink trendline. I am anticipating that the 1 day 200ma will not hold support but if it does there's still a chance we could continue upward although currently not very probable until a correction occurs. Let's remember last time we closed above the 1 day 200 we almost closed 14 1day candles above it and still managed to break below it...so unless I see a ton of bullish volume and a huge spike in price action to go with it, I wont be convinced the 1 day 200ma is going to hold support until we've closed 2 consecutive weekly candles above it.

Target hit; Long closed; Profit taken.IJust had a successful 5x long from 8200 to right where the candle wick has stopped here just barely shy of the falling wedge breakout target. I will now wait for a couple daily closes above the 1 day 200ma before reopening any long.....overall pretty satisfied with this one even if it doesn't hit the target with 100% accuracy(which it still very easily might) 98% accuracy is pretty impressive for a wedge pattern.

Wedge appears to be breaking outI've seen bigger fakeouts than this so although probability is now heavily favoring a bullish breakout here it wont be until we flip the 8504 horizontal trendline back to solidified support that I am absolutely convinced that is the direction we'll be heading. So far however it is looking very bullish.
