GBPUSD - Predictive Analysis & ForecastingGBPUSD
Scales
- S: 1.3169 activation triggers 1.3347 (unless falls to 1.3100)
- M1: 1.3426 activation triggers 1.3131 pivot
- M2: 13555 activation triggers 1.3109
- L: pending at 1.3664
Forecast & Targets
- ST: bearish risk down to 1.3100
- MT: bullish, up to 1.3664
#GBPUSD #Forex #CROW2.0
4xForecaster
------
Originally published on BlueSky
4xforecaster

USDJPY - Predictive Analysis & Forecasting USDJPY
Scales
- S: pending 149.964 activation
- M: nears cycle completion from 140.648 to 148.52-149.53 target range
- L: 142.67 activation triggered 149.21 pivot
Forecast & Targets
- ST: limited upside to 149.96 max
- MT: bearish to 143.09 min, 138.29 max
#USDJPY #Forex #CROW2.0
4xForecaster
------
Originally published in BlueSky

USDCHF - Predictive Analysis & Forecasting USDCHF
Scales
- S: 0.8485 pending
- M: 0.8460 activated, triggers 0.8138 pivot
- L: 0.8457 activated, triggers 0.8258 pivot
Forecast & Targets
- ST: Limited upside to 0.8485 min, 0.8584 max
- MT: bearish; eyeing reversal conditions
#USDCHF #Forex #CROW2.0
4xForecaster
------
Originally published on BlueSky

RIOT - Market Predictive Analysis & ForecastingRIOT
Reversing from a lesser scale (VI), associated with predefined levels
- Eyeing two pivots from 9.587. First one at 7.9189, second at 7.1653; target at 6.4434 is the minimum low
- Lowest low belons to larger scale from 20.8157 to 6.1294-5.6764
Long term remains BULLISH
#RIOT

LGO - Largo, Inc., NASDAQ - Market Predictive Analysis LGO - Largo, Inc., NASDAQ
Scales - 3 repelling levels
1. small (weak): 0.3655
2. mid (stronger): 0.9456
3. large (strongest): 2.8986
Only the mid and large scales concur on pulls
1. mid pulls to 17.1052 via its slowing pivot at 9.9476
2. large pulls to its pivot at 17.7986
#LGO #Largo #CROW2.0

Eminent GEO Completion at CROW Code TGOEminent GEO Completion at CROW Code TGO:
Looking at imminent completion of the GEO's 5-point formation, preceding event to 1-4 TL validation.
CROW Code targets, as of today (23 OCT 2018):
1 - TGO = 59.12
2 - TGB = 67.71
AND
3 - TGU = 74.87
$VS/Monthly:
GEO:
1 - 1-2 Line Symmetry (1-2 SYM)
2 - 2-3 Line Complex Zig-Zag Formation (2-3 CZF)
3 - 3-4 Line Simple Zig-Zag Formation (3-4 SZF)
4 - 1-4 Line Tunneling Formation (3-4 TUN)
5 - 1-4 Target Line (1-34 TL)
Risk Lines:
1 - TGO to 1-4TL to TGU
OR
2 - TGO to TGB to 1-4TL to TGU
4xForecaster

ES_F | Daily Chart | 07 MAY 2025Scales
- S: 4916 to 5481 completed G>Y
- M: pending at 6131 min., 6884 max
- L: pending at 4789
Forecast & Targets
- ST: limited upside to 5764.29 min, 5971.85 max
- MT: bearish to 4789.57
- LT: rally to 6884.94 max (SEP 2026)
#ES #SPX #SP500 #ES_F

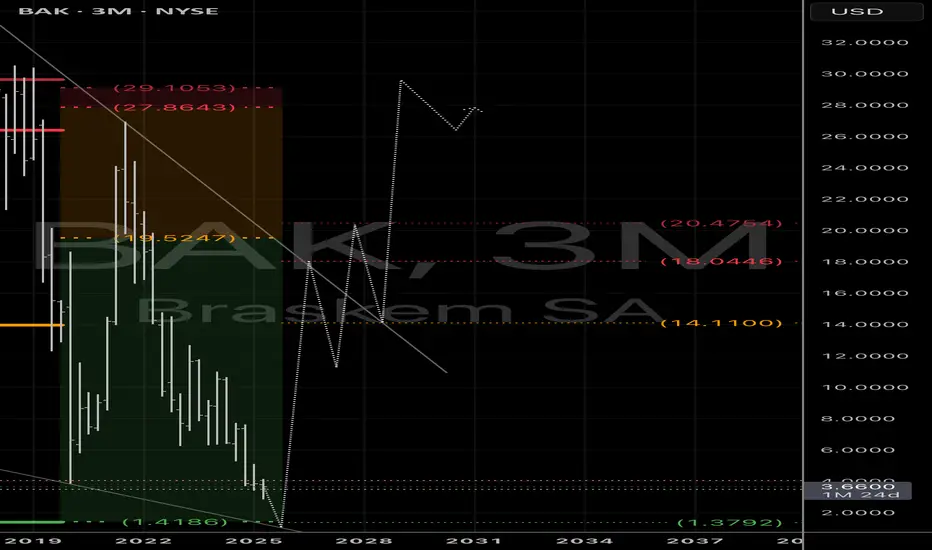
BAK - Predictive Scales, Forecast & TargetsBAK - Braskem, S.A., NYSE
Predictive Scales
- S: pending activation at 1.3964
- M: pending activation at 1.4186
- L: pending activation at 1.3792
Forecast & Targets
- ST: IF carving lower lows, THEN bullish reversal awaits at 1.4186-1.3792 range
- MT: pending reversal
- LT: bullish
#BAK #CROW2.0
Zilliqa consolidating to the upside 4x potential short term
Zilliqa staking is a 15-23% APY
Some wallets reward you with gZIL
the governance token
supply cap of about 600k
thats 35x smaller than bitcoin's 21M
NEVER FINANCIAL ADVISE

EAGLE Strategy - $USDTRY: Keeping A Close Watch On E.A.G.L.E.:2018-08-10 - $USDTRY: Keeping A Close Watch On E.A.G.L.E.:
Traders,
Can you count how many times we got burnt on $USDTRY, waiting for a movement that occurred in multiples of the expected forecast, or one that simply turned around? I can: Two too many.
In this case, I want to highlight a few areas that are worth looking as we wait for a probable reversal at the highlight range, namely:
1 - 6.7302
AND
2 - 6.6694
This range is referred to as a strong Bearish Entrenchment, in which reversal are expected to occur IF and ONLY IF price is meant to reverse at this level (per data determined by CROW Code). Here, the assumption is that a reversal is afoot, so we want to test this sensitive area, which will act as a lithmus test for me, you and anyone getting in the habit of using this method.
First, this area is determined as a narrow band at approximately the top 4th of the high-to-most-recent bottom. Estimate a 4th of that height, and draw a narrow band above and below this estimated level.
Second, for this level to be valid and raise suspicion of a reversal therein, wait for price to rally and stomp within the range. This is the time when I like to enter an aggressive counter-trend position. Here, the trend is UP, so I would simply enter a FULL SHORT Trade Opp position. Why FULL? Simply because this would represent the smallest exposure I would EVER get in such a short trade opportunity were price to move adversely and hit the SL, defined as the highest-high attained by price in the frame.
$USDTRY/M15:
COMPONENTS OF A DESCENT:
The targets that I derive out of the CROW Code are typically associated with foreseeable price behavior. This is not the case all the time, but most of the time.
TG-1 & TG-2 - The Last Bullish Entrenchment:
For instance, targets TG-1 and TG-2 are most often associated with a significant pushback, so much so that some traders familiar with TG-1 and TG-2 will often chose to take profit upon validation of TG-1 when no pushback occurred at TG-1, then wait for a break below TG-2 for re-entry towards the other targets.
TG-3, 4, 5 - The Pass-Throughs:
By contrast, TG-3, 4 and 5 are pass-through targets, where some price behavior may occur, but at much less the frequency than what is seen with the first two targets.
For instance, TG-4 would at time be associated with a deeper push-back than would occur at TG-5, but as long as the pushback remains less than 0.384-Fib deep from the prior leg, then there is no reason to expect that an aggressive, early reversal is afoot ... Stay a while longer for TG-5.
The Ultimate Target, TG-u - Risk of Reversal:
Most recently, I came up with an "ultimate target", which is the level most often associated with a reversal, or at least a deep retracement, which I would define as deeper than 0.618-Fib of the entire move down.
That level is one that is the most difficult to trade, simply because once all numerical targets (TG-1, 2, 3, 4, 5) have been hit, there is a sense that price could no longer go any further. This is especially true when a 5-wave count ends at or near TG-5.
However, I have been surprised most often than not with this target, and a retrospective wave count would often reveal that, although TG-5 may have corresponded to the terminal level of a 5th wave, concluding an impulse wave, a Flat would throw its wave-B and surpass that last level. Another observation also shows that while the impulse concluded at a 5th wave, it was only defining wave-A of a larger and yet to complete Elliott Wave Zig-Zag (ZZ), in which wave-C would push a bit further and justify TG-u.
In any case, TG-u is where the grit of trading is found, as it takes nerves of steel to stay the course, or much more as I do, I simply set-and-forget.
As an aside, I have chosen PURPLE as the color of TG-u, as it is the bruising and nose-bleeding that it imparts psychologically during deep decline or advances, respectively.
NOW, WHAT TO DO:
Using the steps that I will define below, simply get into the habit of checking whether price will move in your forecast direction.
The simplest method would be to define a TOP and a BOTTOM, where TOP is the highest high achieved by price, whereas the BOTTOM is the presumed temporary base formed by the recent decline in the chart.
Finally, ENTER SHORT upon breach of BOTTOM. This would often be a conservative entry, compared to an aggressive entry define by E.A.G.L.E.
If instead, price breaks above SL, then you would get out with a solid rational and very little loss, using an objective strategy that you can now reapply once price appears to reverse within an EAGLE range.
$USDTRY/M5: Looking At A Potential A-B-C Correction Into EAGLE:
OVERALL:
Get in the habit of testing your top, where a reversal might occur. To recapitulate:
1 - Define a narrow width from the highest-high to the recent low, from which price may likely be forming a correction.
2 - Said correction should move in a 3-wave form towards the narrow band, or "Bearish Entrapment" in the case of an expected decline.
3 - Enter upon touch-validation of the lower band, or if very aggressive, wait for price to hit the top band, then enter a SHORT position.
4 -Make sure to apply the firmest of discipline by letting go of the trade IF price closes above the SL. Do not even wait for a "BACA" event, or for price to Break-Across and Close Across". Smply get out upon the mere crossing of the SL. Here, SL is the TOP of the price action in the chart, at 6.7996.
5 - MOVING IN THE DIRECTION OF THE TRADE: Seek a target that is STRUCTURAL, that is a target that would correspond to a prior level where price has consolidated. The best method here is to define the center of that consolidation and project it forward as a target. The center is what I have defined in the past as Nodal Core.
6 - MOVING AGAINST THE TRADE: In case of retracement, as may occur at TG-1 or TG-2, look for price spikes that occurred on the "other side" of the counter-advance". Here, the trade expects price to go DOWN. So, look for spikes that occurred as price was moving UP. In the attached chart, I have pointed out to such a spike which occurred on the other side of the wall, hence the name I give to these events: "Transmural", or literally "across the wall".
In a future strategy, I will share a method called AFT, or Aggressive Forwards Trading. This strategy, as with all of the other ones that I teach, is NOT a revelation of the CROW Code. I am only sharing with you all of the means and methods that I have developed over time for successful, stress-freetrading.
By stress-free trading, I am referring to methods that tell you WHEN to enter, WHEN to rethink and WHEN to take profit.
The strategy that I have explained above aims to do just that. It tells you WhEN to enter (E.A.G.L.E. range), WHEN to rethink your position (SL, TG-2, TG-4), and WHEN to exit (TG-2, TG-5 and TG-u).
E.A.G.L.E. stands for E xtremely AG gressive L evel of E ntry.
Cheers,
David Alcindor

Potential Rallying; Predictive Model Eyes Bullish Targets #forexFriends,
PREDICTIVE/FORECASTING MODEL:
Predictive/Forecasting Model eyes the following BULLISH targets:
1 - TG-Hi = 6.5473 - 04 JUN 2015
and
2 - TG-Hix = 6.6721 - 04 JUN 2015
MARKET GEOMETRY:
A break > Point-3 of the background geometry would still see significant resistance to any advance, with a Wolfe Wave / Geo. potentially illustrating the change of a push back. If this occurred at Point-5, then a temporizing decline could occur down along the 1-4 Line. However, based on Geo's Off-Set Rule, a rallying significantly above Point-5 (exacting Point-5') would likely limit such pull back to the level of price Point-4 (circa 6.187).
MOMENTAL LINES:
Note the dominant lines throughout the chart, which form significant dynamic price-pacing supports and resistance. These are likely to play a role in the nascent geometry, as well as subsequent price advances.
OVERALL:
Bulls have defended their territory at the 6.187 level. This level may be temporarily violated, but invalidation of above analysis should come if and once price breaks-below/closes below Point-2 of the geometry, circa 6.1100.
Best,
David Alcindor
Predictive Analysis & Forecasting
Durango, Colorado - USA
-----
Twitter:
@4xForecaster
Twitter:
David Alcindor
-----
.

Potential Reversal At 11224 Per Background WW Geo. | $DAX #forexWOLFE WAVE PATTERN:
Potential reversal at 11224 per background Wolfe Wave pattern pending completion at its 5-prime position (i..e: along the 2-4 Line transposed and originating off of Point-3 of the pattern (Blue).
BEARISH OUTLOOK:
Overlay of predictive/forecasting model defines 11224 as a significant reversal potential level. If level holds and sends price back into a declining trend, consider 10593 as a conservative conditional level, whereas 10094 as an opening to the bearish 9745 target.
INVALIDATION OF BEARS:
An Elliott Wave prepares to complete its internal impulse count at both lesser degree (small black font) and higher-degree (large grey font). If and once price completes Point-5 of both impulses, a top-structure would define a level of invalidation if price continued to rally passed it.
OVERALL:
Looking into this coming weak, the predictive/forecasting model calls for a top-reversal at 11224. A decline to the bearish target at 9745 would likely act as a solid floor compared to the two structural levels at 10593 and 10094 - In essence, this week could possible see price tethered between 11224 and 9745 given the structural conditions defined above.
Stay tuned,
David Alcindor
Predictive Analysis & Forecasting
Denver, Colorado - USA
-----
Twitter:
@4xForecaster
LinkedIn:
David Alcindor
-----
.

$GBP vs. $JPY Nears Significant Resistance | #BOE #BOJ #forexFriends,
Watch for resistance at 193.667 - Predictive Model calls for significant pushback - possibly reversal - at the following qualitative target:
- TG-Hi = 196.311 - 16 JUN 2015
Structural levels lurk below, at 163.079/161.453. This is a L/T chart where the Predictive /Forecasting Model represents heavier players, and is therefore less representative of the synthetic market (i.e.: retail and institutional).
There are no market geometries considered at this time.
Best,
David Alcindor
Predictive Analysis & Forecasting
Durango, Colorado - USA
-----
Twitter:@4xForecaster
LinkedIn:
David Alcindor
-----
.

$NASX - Interim Correction; Bulls Eye 5859.51 | #nasdaq $NQSYNOPSIS :
1 - Overall price action suggests an incomplete 5-wave impulse with Elliott Wave alternation rules giving way to a complex Wave-IV consolidation with support expected at 4104.70, compared to a simpler Wave-II which occurred between 04-2010 and 10 2011; A resultant Wave-V completion remains pending
2 - Predictive/Forecasting Model eyes ONE pending targets, namely TG-Hix = 5255.11 and a WL level suggesting high-probability reversal level, namely WL = 5859.51
3 - Interim support corresponds to alignment of both a structural level where Intermediate Wave 4 (circled) defined its residence, as well as a quantitative target generated by the same Predictive/Forecasting Model as that which generated above qualitative levels, TG-Hix and WL
A QUICK NOTE ON RSI:
I often receive comments and suggestions about RSI, pointing to so-called divergences, which are typically referred to as "bullish" or "bearish" divergences - I will be short on this, as I have hammered this topics in public lessons several times over the years, but the author had originally suggested that BEARISH divergences in RSI (RED in the RSI field) are commonly associated with BULLISH trending markets, and not with declining markets, as many junior traders tend to perpetrate the same misstatement from misinformed tutors.
If you need to use RSI for a market expected to rally, look instead for POSITIVE (neither bullish, nor bearish) divergences (GREEN in the RSI field), where the origin of the green line imposes a solid support, which price will seldom transgress (as is consistently shown in this case) - The analogy I teach is that of a "shovel", where the origin of the green line is the handle, and the tip is the shovel, propping price up and above to higher height, in a situation where price carves a HIGHER-low against a LOWER-low in RSI ... If confused, just ask me for more examples, or feel free to post some suggestions here or in another appropriate chart ... Kapish?
The inverse is true, where a NEGATIVE divergence is price, where I use the "hammer" analogy, has the handle defining a level which price will not transgress, where the right-end of the RSI (not shown in this chart, since there is no downtrend defined as of yet) would rise at a HIGHER-high, compared to a LOWER-high in price, thus giving the impression of hammering the price further DOWN.
The ORANGE lines are convergent lines, and they simply have no "telling" as to the direction, strength and extent of subsequent price action.
Hope this helps in your own analyses.
Best,
David Alcindor, CMT Affiliate #227974
- Alias: 4xForecaster
.

#Corn #cbot: Predictive/Forecasting Model Eyes 202'6 #fibonacciFriends,
A rare coverage of the ag-commodity, but here it is - Corn (P) expected to remain under bearish strain, with a confluence of background technical tools pointing down towards the 244'4 to 202'6 range, against a foreground Predictive/Forecasting Model eyeing bearish targets as low as 202'6.
TECHNICAL TOOLS: Fibonacci, Shark and 5-0 Patterns
An overlay of Fibonacci matrices in Roman numbers with contraction and extension values is shown below:
Fib-I = 0.886 points to a Scott Carney's Shark targe, as follows:
Note that the Shark pattern originates at Point-zero and completes at Point-C, being the acolyte precursor of the 5-0 pattern (see below).
Note also that Point-C of the Shark is Fibonacci-dependent upon TWO values, 0.886 as in the case of this posted chart, but also 1.131, where this tiny extension is often encountered as the inscribed pattern in the same price field, as follows:
Note also, as mentioned above, that the acolyte of the Scott Carney's Shark pattern is the 5-0 patten, which is a reactionary conclusion of the Shark, typically retracing fifty percent of the Shark's last swing, hence the five-zero, or simply 5-0 pattern, as follows:

$CAC40 Under Geo's Bearish Pressure | #fibonacci #euro $EUR $GBPFriends,
Following is a composite technical analytic view of $CAC40, in which all aspects of technical tools are displayed as shown in the following chart - We will dissect each of there thereafter:
Looking in detail at each of the following components, let's consider the following items:
1 - PREDICTIVE/FORECASTING MODEL:
As a foreground, stand-alone proprietary element, the "Model" is defining the following BEARISH targets:
1 - TG-Lo = 3759.18 - 12 AUG 2015
and
2 - TG-Lox = 3384.19 - 12 AUG 2015
GEO'S OFF-SET RULE:
The Geo relies on adverse excursions to establish high-probability targets, such that the following expresses the "Geos' Off-Set Rule":
1 - Price retracing from Point-5 aims for validation along the 1-4 Line (Wolfe Wave rule);
2 - Price retracing from Point-5' (most common occurrence) aims for price level corresponding to Point-4;
and
3 - Price retracing from Point-5'' (least common occurrence) aims for a price level corresponding to Point-3.
In the case of the current chart, price retraces from Point-5', thus aiming for a HIGH-PROBABILITY target corresponding to Point-4, which in terms of the Predictive/Forecasting Model corresponds to:
- TG-Lo = 3759.18 - 12 AUG 2015
In the most immediate support, consider the following cluster:
1 - 1.618-FE = 4180.54
and
2 - Nodal Core = 4193.88 ("ND")
and
3 - Point-1 of Geo, offering a structural point of repose as price retraces from Point-2 and Point-5'.
Where 1.618-FE = ND
As shown in the dashed arrow in the chart, this structural level is likely to see a slight retracement capped at the support-turned-resistance of 4601.90.
STRUCTURAL ANALYSIS:
Levels 1, 2 and 3 on the left side of the price field represent structural levels, such that:
1 - Number-1 represents that level of Geo's Point-1, offering the most immediate structural support from retracement of swing between Geo's Point-2 and Point-5'.
2 - Number-2 Offers a temporizing support which defined a channel capped above by #1 as defined above and #3, which offered the first and subsequent R/S levels as shown - This levels happens to line up with Model's TG-Lo = 3759.18 - 12 AUG 2015 level.
3 - Number, as explained above, also happens to line up with Model's TG-Lox = 3384.19 - 12 AUG 2015 level.
OVERALL:
Bears are taking over. Invalidation would occur if and once price rallied above Point-5', or 5283.71. Still, the Model remains the dominant indicator at this point, tilting the balance in favor of bears with targets defined above and further supported by technicals as mentioned above as well.
Best,
David Alcindor
Predictive Analysis & Forecasting
Durango, Colorado - USA
-----
Twitter:
@4xForecaster
LinkedIn:
David Alcindor
-----
.

$USD v. $TRY - #elliottwave & Predictive/Forecasting AnalysisFriends,
Predictive/Forecasting Model hit an unannounced target at the current price vicinity of 3.06557. I have constructed this DAILY chart to comprise three degrees of Elliott Waves: Cycle, Primary and Intermediate.
In these relative terms, the recent top would likely represent cycle III of a Period of an Intermediate (5). The relevance of this detailed nomenclature is relative to its internal parts, but also to the probable price action we are about to face.
The most important element here is that we are likely arrived at a significant resistance, topping a cycle-degree impulse, and now descending to a probable correction into a Cycle wave IV.
EQUALITY:
Keeping a quasi-equality among Wave II and Wave IV, we are expecting a possible 434 resolution of a correction/impulse completion, first as the aforementioned Cycle Wave IV, and a final push to higher highs as an impulsive Cycle Wave V.
ALTERNATION:
Consideration must be given to Elliott Wave's Rule Of Alternation, wherein Cycle Wave II corrected into a complex 5-3-5 zigzag (more specifically a declining Leading Diagonal, followed by a rising Triple Zigzag, then concludinghte entire correction into a declining Impulse - The overall motion is detailed as "LD-TZ-IMP" over a 434 daily bar span).
Conversely, the alternation in the current Cycle Wave IV correction should occur as a simpler IMP-ZZ-IMP, giving shape to the simpler ZZ prescribed in the chart as the larger PINK zig-zag.
TARGETS - ELLIOTT WAVE & FORECASTING/PREDICTIVE MODEL BASED:
- ELLIOTT WAVE SUPPORTIVE TARGET:
There are two targets in the chart. First, a supportive target defined by expectation of Elliott Wave's rule of correction seeking origination level of a preceding Wave-4 of one lesser degree, hence sought out at Intermediate Wave (4) = 2.62980.
Staying respectful of the aforementioned EQUALITY rule, the projected height of Cycle Wave II is thus used to approximate the termination level of Cycle Wave IV, such that the top of the range anchors at Cycle wave III = Primary = Intermediate (5).
This does NOT result in any Fibonacci cluster, as the Fibonacci matrix is anchored at Intermediate (2) to Intermediate (5), and fails to offer a cluster at the 0.618 level. This level was relevant at the bottom left of the chart, since it offered the launching base from Cycle II completion to the recent Cycle III completion.
PREDICTIVE/FORECASTING MODEL TARGET:
The Predictive/Forecasting Model here offers a final target, namely:
- TG-Hix = 3.26772 - 14 OCT 2015
This target is a qualitative designation (ie.: TG- Hi/Lo and TG-Hi.Hix), which is associated with reversals rather than retracements. This means that if and once price rallies from the approximate base just defined, we are likely to see significant rejection and a probable roll-over.
Note that the 0.618-Fib level that correlates the two Cycle Wave II and IV can be used as a measure of anticipation, perfectly lining up its infamous 1.414-Fib, which is the value I often seek in an aggressive counter-trend market where reversals tend to occur.
OVERALL:
Look for a probable simpler correction to the levels defined, and an impulsive Cycle Wave completion at the Predictive/Forecasting Model target of 3.26772.
Best,
David Alcindor
Predictive Analysis & Forecasting
Durango, Colorado - USA
-----
Twitter: @4xForecaster
LinkedIn: David Alcindor
TradingView: www.TradingView.com
-----
.

$FTSE: Interim Bulls Eye 7296.16; Large Geo Calls For LT DeclineSYNOPSIS :
1 - Limited downside risk per Predictive/Forecasting Model
2 - Predictive/Forecasting Model eyes 7296.19
3 - large developing geometry complies with internal construction of Geo
4 - Internal ab = cd nears "Model" target
5 - Internal inverted H&S in near alignment with reciprocal ab = cd symmetry
6 - Reversal probable at WL target
7 - Invalidation confirmed if price BACA < 4442.30
Best,
David Alcindor, CMT Affiliate #227974
- Alias: 4xForecaster (Twitter)

$MIB Sees Limited Upside To 25013 Before Geo Completion | #euroFriends,
A confluence of technical hurdles is likely limiting any immediate upside potential in the Italian MIB Index, based on the following set of observations:
1 - ELLIOTT WAVE + GEO: In the most recent past (12-19 OCT 20009), price rallied to complete Elliott Wave's 4th wave, completing its corrective swing at 24558.00. This became a spring board from which bears plunged to 12296.00 on week of 23 JULY 2012 - This nadir defined the completion of a full bearish Elliott Wave impulsive swing at its 5th wave, as well as plotted the Geo's Point-2. As price rallied correctively from that level, it crunched the most recent price action into a narrow range from which to spring into that prior 24558.00 support-turned-resistance level.
2 - RECIPROCAL AB = CD SYMMETRY: As price unfolds into a correction, internal analysis of recent price action at this weekly scale reveals that a geometric projection could carry price to or slightly above the vicinity of the historical structural 24558.00 level. This geometry does not occur over the entire length of the recent corrective upswing, but structural analysis of lows vs. highs allow for a fair projection via an internal ab = cd pattern.
3 - PREDICTIVE/FORECASTING MODEL: As a stand-alone method, the Predictive/Forecasting Model has defined a high-probability resistance level defined as:
- TG-Hi = 25013.54 - 12 AUG 2015
This represents a qualitative target which is most able to impose a reversal event. In the context of above technical events, this adds credence to the probability of resistance and retracement as mentioned, with the 1-5' Line acting as an additional back-stop to a probable rallying into these targets.
OVERALL:
Technical analysis combined with predictive/forecasting model favor a limited upside potential to a narrow 24558.00/25013.54 range. A background Geo adds further weight through its geometry, raising the expectation of a retracement to a price level (18031.76 to 17555.77), corresponding to Point-4, as set by the Geo's Off-Set Rule.
Best,
David Alcindor
Predictive Analysis & Forecasting
Durango, Colorado - USA
-----
Twitter:
@4xForecaster
LinkedIn:
David Alcindor
-----
.

$XAG vs. $USD Rests At Bullish Entrenchment; Eyes 17.564 | $SLVFriends,
Watch for potential rally into the 17.564/17.757 range per Geo's Off-Set Rule, as price defined a higher-low structure into the bullish entrenchment - See following chart:
Look for commodity-sensitive currencies, such as $AUD, $NZD, $CNH and correlated leaders such as $XAU, $XPT charts (posted earlier this week) for supportive hints in terms of similar directional biases.
Background geometry at play is the Geo, as implied by above Off-Set Rule, whereas the Predictive/Forecasting Model remains quiet at this time.
OVERALL:
Bullish bias to 17.564/17.757 range as Geo=based targets.
Best,
David Alcindor
Predictive Analysis & Forecasting
Durango, Colorado - USA
-----
Twitter:
@4xforecaster
LinkedIn:
David Alcindor
-----
.

$SPXL - Bulls Still In Charge; Eye 106.93 near 01 AUG 2016 SYNOPSIS :
1 - Per Predictive/Forecasting Model, underlying force continue to favor bulls
2 - Support near the 77.61 handle offers a probable rebound level
3 - Forecasting Model eyes 01 AUG 2016 vicinity as probable timing in rally
4 - Invalidation: Break of 68.99
Best,
David Alcindor, CMT Affiliate #227974
- Alias: 4xForecaster (Twitter)

$FAS Bears Eye 7.83; Put On Summer Power Shorts | #ETFSYNOPSIS :
1 - Major bearish strength coming into play
2 - Immediate major support resides at the 15.54 handle
3 - Limited reactive rally expected at 15.54
4 - Ultimate bearish target at 7.83
Best,
David Alcindor, CMT Affiliate #227974
- Alias: 4xForecaster (Twitter)

Wolfe Wave Pending; Model Targets 1063.34 | #elliottwave $SPXFriends,
I would like to consider the possibility that the SP500 Index might carve out a higher high, based on a set of technical conditions I will define below.
PREDICTIVE/FORECASTING MODEL:
First and foremost, the Predictive/Forecasting Model I use in the foreground of my analysis has defined a probable bullish target, namely:
- TG-Hix = 1063.34 - 12 OCT 2015 (For those intrigued by numeral plays, you might perhaps enjoy the mathematical relationship of this relative to the fractional period)
This target is a qualitative target, or Qual-Target, which not only represents the highest allowable target by the Predictive/Forecasting Model, by also by its nature will tend to impose a reversal - not just retracement - as a counter-force against price.
ELLIOTT WAVE:
Now, looking at the general gist of price action in terms of Elliott Wave count, I have ascribed three degrees of scale to this monthly chart:
1 - A Cycle degree, denoted by the tail-end of a large multi-year bullish impulse, denoted by circled points , and (here using the brackets to indicated a circle)
2 - An Intermediate degree denoted by the last bullish impulse in parenthesed points (1)-(2)-(3)-(4)-(5), whereby point (3) carved the historical top and the reactive low in point (4) remains a tentative structure low, likely expressing the beginning of a zig-zag based on its initial reactive, counter-trend impulse (Note: a ZZ is the only correction expressing its initial leg in a 5-wave form). Point (5) is thus pending.
3 - A Minor degree denoted by a completed impulse of internal minor points 1-2-3-4-5 of intermediate wave (3).
Note also that as a general rule, an extended 3rd wave is associated with an equality rule, relating Wave-1 and Wave-5 such that the two are equal in height (here, 237.42 points), such that Intermediate wave-5 is expected to reach 1044.87.
WOLFE WAVE ANALYSIS
A 5-point geometry is nearing its entire cycle, expressed by Mr. Bill Wolfe's Wolfe Wave, where convergence of 1-3 and 2-4 Lines define a 1-4 Line, also known as the "Target Line" - This TL remains pending and quite proximal to a potential rallying.
FIBONACCI ANALYSIS:
First, let's propose that the recent Intermediate Wave 5 and Intermediate wave 4 hold the following Fibonacci relationship, such that:
Intermediate Wave 5 = 1.618 x Intermediate Wave-4 = 1035.49.
This Fibonacci based target (which is one that is quite standard and typically anticipated when relating these waves) comes near-alignment to above Predictive/Forecasting Model = 1063.34, and in even closer alignment with the equality-based intermediate wave-5 = 1035.49.
OVERALL:
Whereas the Predictive/Forecasting Model stands as an independent element in the analysis, it is interesting to note that there is compelling evidence which can be made here to expect not only further advance in the SP-500 Index, but also a probable reversal at the 1035.49/1044.87/1063.34 cluster.
To be followed.
Best,
David Alcindor
Predictive Analysis & Forecasting
Durango, Colorado - USA
-----
Twitter: @4xForecaster
LinkedIn: David Alcindor
TradingView: www.TradingView.com
-----
.
