$GBP vs. $NZD Nears Bearish Target at 1.93154 \ $USD #forex #BOEPredictive/Forecasting Model's target defined last March 10th as 1.93154 is coming near.
The background geometry continues to support this development as well. Consider a significant pushback, or probable reversal at that level.
David Alcindor
Predictive Analysis & Forecasting
Denver, Colorado - USA
-----
Twitter:
@4xForecaster
LinkedIn:
David Alcindor
-----
.
4xforecaster

$EUR $AUD Continue To Decline Into Potential Geo | $USD #forexPredictive/Forecasting Model defined bearish qualitative target as:
TG-Lo = 1.31707 - 21 APR 2015.
Background geometry continues to develop into credible decline continuation. Extent of ectopic Point-5 as 5-prime (5') also remains attainable relative to above forecast.
David Alcindor
Predictive Analysis & Forecasting
Denver, Colorado - USA
-----
Twitter:
@4xForecaster
LinkedIn:
David Alcindor
-----
Recent analysis of $EURAUD:
.

$AUD / $CAD - Completed Geo.; Rally To 1-4 Line Probable #forexLarge geometry completed at Point-5. Waiting to cross > level of point-3 is the prudent, time consumptive part of this long consideration.
Look for discreet overhead resistance as shown. Bulls are coming in force.
Predictive/Forecasting Model will likely churn a precise target level.
David Alcindor
Predictive Analysis/Forecasting
Denver, Colorado - USA
-----
Twitter:
@4xForecaster
LinkedIn:
David Alcindor
-----
NOTE: Prior $AUDUSD Dead-On Hit:

Significant support at 1.06298/6241 Level | $EUR $USD #forexWatch for significant support at 1.06298/1.06241 range. Pattern reciprocity is highly probable at respective 5-second (5") positions.
David Alcindor
Predictive Analysis & Forecasting
Denver, Colorado - USA
-----
Twitter:
@4xForecaster
LinkedIn:
David Alcindor
-----
More Advanced Market Geos here:

LESSON - Adv. Market Geo.: Step-Wise Geometry Development | $EURFollowing is a step-by-step demonstration of my own approach to Wolfe Waves detection, analysis and trading application. This does not constitute or represent Mr. Bill Wolfe's lesson on his namesake pattern, the Wolfe Wave (www.WolfeWave.com).
$EURGBP - H4 Chart:
Instead, it represents my own interpretation based on a preceding interest in occult market geometries. What I have discovered may or may not represent the lesson content of Mr. Bill Wolfe, since I have never had the chance to receive his lesson, but the concepts are just as valid, per my own successful trading of this particular geometry - All of this is for educational use only, and does not constitute a trading recommendation. So, do your own due diligence, as always.
Lesson follows ... Hope you enjoy.
Stay tuned,
David Alcindor
Predictive Analysis & Forecasting
Denver, Colorado - USA
-----
Twitter:
@4xForecaster
LinkedIn:
David Alcindor
Facebook:
www.facebook.com
-----
.
$EURGBP - DAILY Chart as of 11 APR 2015
$EURGBP - WEEKLY Chart as of 11 APR 2015
David Alcindor

Driling Thru 1445 Opens Floor To 1089.93 Target | #bitcoin $BTCFriends,
Price is likely to encounter a significant support at 1445.00. Breaking of that floor opens price to the following Predictive/Forecasting Model's target:
- TG-Lo = 1089.93 - 10 APR 2015
This would only represent a smaller aperture to the prior analysis done over this following chart:
Source of predictive analysis and forecasting:
This chart will be placed and analysis followed in original thread.
OVERALL: Bears remain in charge, as per prior forecast and analyses. Upside potential limited, as illustrated.
Stay tuned,
David Alcindor
Predictive Analysis & Forecasting
Denver, Colorado - USA
-----
Twiter:
@4xForecaster
LinkedIn:
David Alcindor
-----
.

#UDollar Mulls 98.38; Limited Upside If > 98.66Friends,
The Dollar Index is currently facing a significant, but discreet hurdle at 98.39. A break above 98.66 would indicate further headway towards the bearish entrenchment, defined by 99.49/99.91 range.
Predictive Analysis and Forecasting Model offers a limited upside potential given this first hurdle condition met, with a nominal/qualitative target defined as:
TG-Hi = 10.08 - 08 APR 2015
If a geometry develops, we will add this to the current string of Forex charts in which we revealed interesting and successful Hit Target education trades:
As posted before, the long-term outlook remain bullish for USD. However, this does not exclude the possibility of a bearish interim.
Stay tuned,
Predictive Analysis & Forecasting
Denver, Colorado - USA
-----
Twitter:
@4xForecaster
LinkedIn:
David Alcindor
-----
.

Several Geometries Point To Rally | $EUR $AUD #ECB #RBAFriends,
This will remain a very short post. If you recall, last year, i released a long-term bearish signal, defining one numerical target and one nominal target (see today's dated technical note on "Predictive/Forecasting Model - Definition" in this thread: for more on the significance of these distinct targets).
This DAILY chart shows older targets, as well as a new completed geometry at Point-5, which represents a solid floor.
Internal to that geometry, there are two dotted lines, each representing a projected connection between Points 1 and 4 (in the larger geometry), as well as a similar 1-4 Line projection off of an ipsi-directional pattern not shown at this scale that exists at the H4 level.
There is yet another same pattern at the H1, which is also not shown, but that would justify an interim decline to the approximate price level shown by the dashed orange arrow.
I would simply let the smaller, internal geometries complete for the time being.
Although the frame by frame updates will continue to be posted on this thread, I will add more technical comments on this: , where several other charts are being discussed around "Advanced Financial Markets Geometries" topics.
Stay tuned,
David Alcindor

Potential Geometry Completion Before Further Decline | $GBP $CADLooking at following potential interim development:
1 - background geometry to 1-4 Line
2 - Range: 1.89098 to 1.89610
Expecting further decline based on predictive/forecasting model, aiming for following bearish target:
- TG-Lo = 1.79707 - 20 MAR 2015
OVERALL:
Background geometry is likely to contain price subdued to range defined above. Predictive/forecasting model remains bearish.
Invalidation of longer-term directional bias should occur if price rises above point-2 of background geometry, or 1.9142.
Feel free to follow this trade in the general "Advanced Financial Market Geometries" lesson segment open today, here: , for more on advanced patterns and strategies.
David Alcindor
Predictive Analysis & Forecasting
Denver, Colorado - USA
-----
Twitter:
@4xForecaster
LinkedIn:
David Alcindor
-----
.

Tech-Note: Explaining Aspect Of The Predictive/Forecating Model05 MAR 2015 - Tech-Note:
Friends,
A quick explanation of what TG-Hi, Lo and TG-Hix and TG-Lox are - Cut/pasted from a private message:
WHAT ARE TG-Hi/Lo; HOW DO THEY COMPARE TO TG-Hix/Lox?
----------------------------------
TG-Hi and TG-Lo are are named target, as opposed to numbered target, hence called nominal target.
Nominal targets represent a low-probability level of being attained, but a high-probability level of reversal if and once price gets there.
Hi refers to the bullish placement relative to price, whereas Lo is its antipod, bearish placement.
Because the markets will be subjected to a varying degree of momentum, the model also ascribes a much lower, and in fact, rarer occurrence, whereby price would reach an extreme reversible level, which explains the "x" in the targets, or TG-Hix and TG-Lox.
All TG-Lo/Hi targets will be in RED, whereas their extremes will be in PURPLE.
Most recently, I have added numbers in BLUE which represent trigger level that, if reached, should prompt the trader to turn to a higher timeframe, in the order of 4 times the current frame (e.g.: M15 x 4 = H1, H1 x 4 = H4, ... etc) as attainment of this level is simple the rarest of events, and suggests a higher-frame interference by typically better funded players, stronger institutions - This augmentation in timeframe should be done even once the purple target is in effect and the technical analysis should be redrawn or at least re-considered at the newer, higher frame, simply to preempt any cooptation by stronger actors - I will post this explanation on few other charts as well - Thank you for asking and remaining curious. - David Alcindor
----------------------------------
... cont'd in thread ...
----------------------------------
David Alcindor
Predictive Analysis & Forecasting
Denver, Colorado - USA
-----
Twitter:
@4xForecaster
LinkedIn:
David Alcindor
See our All-Time TradingView Top Authors:
- www.tradingview.com
------
.

Predictive/Forecasting Model Eyes 405/575; So Do Market-Geos.PREDICTIVE/FORECASTING SYSTEM:
1 - 575.65 - 27 FEB 2015
and
2 - 405.95 - 27 FEB 2015
SIMPLE MARKET GEOMETRIES:
Large simple symmetrical a-b = c-d patterns aim for similar vicinity.
1 - The largest in light blue projects into the Model's range of 575.65 to 405.95
2 - The smallest in light purple projects slight above the Model's first target of 575.95
Averaged projection of the blue terminal and purple terminal levels is (623.69 + 501.17)/2 = 562.43, or slightly right at the Model's first target of 575.95
OCCULT MARKET GEOMETRIES:
Momental lines (representing dominant rated of change in price throughout any timeframe, running independent from channel lines) can be seen in the chart as running from bottom left to upper right. This is to contrast with a long-term bearish channel which is running from top-left to bottom-right.
These momental lines are likely to remain in force in this case, as in any other cases, imposing their omni-present forces on price, ... in this particular case acting as an overhead resistance.
OVERALL:
Price action is likely to seek a denouement in the shaded area. The arrow shows the probable direction of price. Invalidation of this would need to meet two important tests:
1 - Transgression of the momental line
and
2 - Committed accession above the 1944 level, whereby price would Break-Across + Close-Across ("BACA").
Stay tuned,
David Alcindor
Predictive Analysis & Forecasting
Denver, Colorado - USA
-----
Twitter:
@4xForecaster
Linked-In:
David Alcindor
-----
.

Predictive Analysis/Forecasting | $USD $CAD #fed #BOC #forexBearish bias prevails at this point
PREDICTIVE/FORECASTING MODEL:
- Numerical Targets:
1 - TG-1 = 1.21656 - 25 FEB 2015
and
2 - TG-2 = 1.17984 - 25 FEB 2015
- Nominal Targets:
1 - TG-Lo = 1.15527 - 25 FEB 2015
and
2 - TG-Lox = 1.13517 - 25 FEB 2015
STRUCTURAL TRADING:
- Invalidation > 1.26965
- Strongest bearish resistance @ 1.26234 - See "Market Geo" next for expected rallying extent.
GEOMETRIC DEVELOPMENT:
- Potential WW with pending 5-wave expected as a Point-5-prime expression, rather than a conventional Point-5; Subsequent rallying would likely be capped at WW's Point-4 level, or 1.26620.
Expect a protracted, time-consumptive unfolding of price at this level, as EW's 4th wave is unfolding, respective of the "Rule Of Alternations".
OVERALL:
Bearish bias pending significant break of floor, which is not expected to occur until resolution of background advance geometry.
Stay tuned,
David Alcindor
Predictive Analysis & Forecasting
Denver, Colorado - USA
-----
Twitter:
@4xForecaster
LinkedIn:
David Alcindor
-----
.

Expecting $EUR To Outperform $GBP | #ECB #BOE #forex #fibonacciFriends,
PREDICTIVE/FORECASTING MODEL:
Predictive/forecasting model signals a nominal target attainment at TG-Lo = 0.73344, implying a high-probability reversal at this precise level. This target was defined today - There was no prior target defined at this level, so not a "Target Hit" announcement.
MARKET GEOMETRY:
The background geometry supporting this view is a 3-point line-up of a quasi-WW - Since the 1-3 and 2-4 Line are not strictly convergent, this pattern falls under one I have priorly defined as a alternate WW, or AWW - Geometric target rests at the level of AWW's point-4, or 0.87683.
FIBONACCI LEVEL:
The overall gist of price action is that of a bearish consolidation with multiple internal ZZ formations. This carries a high adherence to Fibonacci contractions of 0.618 and expansion of 1.618.
Looking at the contraction range, the 0.618 comes into close alignment with above geometric Point-4 of AWW, here at 0.88533 vs. 0.87683.
RSI INDICATOR:
Looking at the RSI-14, its historical, albeit taut line up at 17.45 with a prior nadir reached in mid July 2012 is calling for a probable rallying from here, adding further credence to the geometry and predictive model biases.
RELATIVE STRENGTHS:
On a comparative basis with other pairs or relative to the Dollar index itself, recent analyses are expecting further advances in the $EUR and $GBP relative to the $USD, and decline in $GBP relative to $AUD. Therefore, the relative strength expression of $EURGBP is net bullish, favoring $EUR over $GBP - See links below for recent analyses on $GBPAUD as well as expectation of a decline in $DXY and $USDollar:
$GBPAUD:
Daily analysis:
4-hour snap:
$DXY -
$USDollar -
OVERALL:
Convergence of Fibs, market geos in support of the predictive/forecasting model supports a rallying from this current technical base. Insight into related currencies also point to intrinsic forces in favor of a $EUR outperformance relative to $GBP.
Stay tuned,
David Alcindor
Predictive Analysis & Forecasting
Denver, Colorado - USA
-----
Twitter:
@4xForecaster
LinkedIn:
David Alcindor
-----
.

$Brent vs. $WTI Nears Top | $UKOil $USOil #oil #crudeoil #wtic Friends,
GEOPOLITICAL SHIFTS:
The relative strength between pricing of oil on an international vs. US domestic bases illustrates quite well the geopolitical changes that have occurred in the oil-producing theaters, not only from disruption of supply in the middle east - likely causing the shift fron under-to-above parity (purple line) around 2009, as well as major US domestic advances in shale oil productions, which has maintained an advantageous spread in US oil prices against that of international sources.
However, with a noted decline in world-wide consumptions (e.g.: China has halved its vessel imports over the past last month; euphemistic reference to diffuse sovereign negative inflation; demographic-driven shifts in consumption habits; ... etc.) combined by production-dependent economies feeling obligated to continually supply and swell storage reservoire just to keep their industry afloat at the global level has all worked to tilt the supply side of this commodity in excess of demand.
While price of oil is expected to remain low based on the predictive analysis and forecasting model (see linked analyses under "Link To Related Ideas"), the relative strength of UK oil versus US oil is also expected to take on a sub-parity destiny.
TECHNICAL ANALYSIS:
-- Market Geometries, Fibonacci And Elliott Wave Patterns:
Historically, price rose to satisfy a Scott Carney's Bearish Butterfly geometry based on a X-A axis from late 1990 to early 1991, completing at a significant XA x 1.414-Fib = Point-D.
Following a significant decline in the order of a 0.618-0.786 Fibonacci order, price oscillated back up in an Elliott Wave W-X-Y-XX-Z pattern.
-- Predictive Analysis And Forecasting Model:
At this point, the predictive/forecasting model sees the following bullish target as a probable top, defined as:
- TG-Hi = 1.22 - 20 FEB 2015.
If and once price rises to that level, model expects a significant reversal in line with a speculated reversed Elliott Wave W-X-Y-XX-X (in blue) with a proposed 1.618-Fibonacci extension as a probable target, values at 0.92 in relative strength terms.
OVERALL:
Relative strength is expected to return to sub-parity level. Predictive/forecasting model sees nearing of a top, and combined analysis with Fibonacci and Elliott Wave suggests a floor at 0.92.
David Alcindor
Predictive Analysis & Forecasting
Denver, Colordo - USA
-----
Twitter:
@4xForecaster
Linked-In:
David Alcindor
-----
.

E-Mini Forex Synopsis in $EUR $JPY $GBP $AUD | #forex $DXY $USDLooking at the majors in e-mini Forex, here is a quick synopsis of potential price action - Black levels are model-based R/S level projection; Colors are TG-Hi/Lo in red and TG-Hix/Lox in purple.
$EUR vs. $USD:
Expected to lose ground against USD. A hard structure stands at 1.1538 to invalidate this bearish outlook. In opposite, a softer ground at 1.1267 would open floor to bearish targets if breached, defined as:
1 - 1.1026 - 17 FEB 2015
and
2 - 1.0797 - 17 FEB 2015
$GBP vs. $USD:
Background geometry raises the expectation of a decline. Using my empirical rule, this WW is likely to seek support at the corresponding level of Point-4 before a rallying could materialize. Point-3 offers a wide or loose layer of bullish resistance whereas Point-1 projects into a much tested level of bullish entrenchment. This alone should offer assurance against a possible interim adverse excursion.
$JPY vs. $USD:
A soft floor stands at 0.8370 against a potential resistance at 0.8450. Predictive/forecasting model is currently favoring a decline down to 0.8284, representing a solid bottom from which a rallying into higher highs could ensue.
$AUD vs. $USD
Predictive/forecasting model remains bullish here. Still, a cautionary level comes at 0.7641 to invalidate any enduring bullish outlook.
At its antipodal position, a significant resistance level at 0.7865 should open the roof to loftier levels if and once transgressed. In the most proximate position, 0.7912 could offer a temporary relief to bulls, but it would not likely thwart the expected advanced to the predictive/forecasting model targets, which are defined as:
1 - 0.8024 - 17 FEB 2015
and
2 - 0.8183 - 17 FEB 2015
OVERALL: These e-mini Forex pairs offer directional clues and targets that are defined based on a pure technical basis. The underlying geo-political development could impose their own interdictions, as much as their own implied intentions further verified within these charts as they develop. Due the due, refer to reliable sources in inter-market analysis and geopolitical development if you need a broader, more mixed set of data outside of a pure technical statement.
Stay tuned, as I will also post these chart in their own thread - See their links below.
David Alcindor
Predictive Analysis & Forecasting
Denver, Colorado - USA
-----
Twitter:
@4xForecaster
Linked-In:
David Alcindor
-----
.

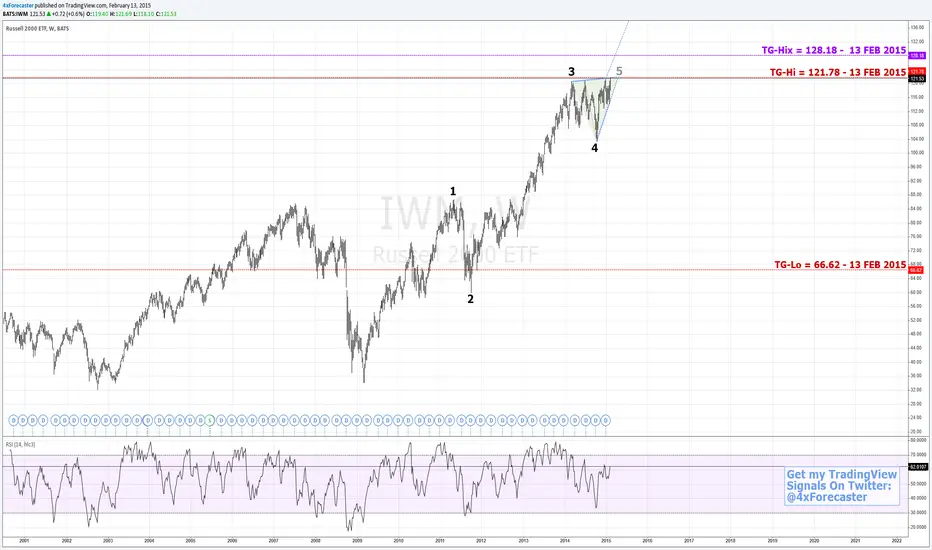
Limited Upside Potential | $IWM #fibonacci #elliottwave Quick note here on the Russell (private request I decided to share)
Market closed right at 121.53 in the context of the following predictive/forecasting model results:
BULLISH TARGETS:
1 - TG-Hi = 121.78 - 13 FEB 2015
and
2 - TG-Hix = 128.18 - 13 FEB 2015
PATTERN ANALYSIS:
- ELLIOTT WAVE ("EW"); Wolfe Wave ("WW"):
Model suggests a topped-off condition. A large WW inscribed within the EW's 3rd wave termination with projection of the triangular top edge forward illustrates a crest-to-crest alignment in 4 distinct times. The second time is the crest of a large A-B-C zig-zag towards the completion of EW's 4th wave, with two consecutive attempts at higher highs, blunted by that top-edge projection off of Point-3.
SMALLER WOLFE WAVE ("WW"):
Another pattern (not shown, but easily discernible in the H4 timeframe is a WW, nascent within the ending upswing of the current 5th wave completion.
While EW's ED may also be considered concurrent to the smaller WW within the completion of the 5th wave, I would remain close to the WW consideration, as it applies stricter rule in terms of forecast, projection and reversal levels.
PREDICTIVE/FORECASTING MODEL:
The model itself remains neutral at this point, as it has not completed the forecast levels above. Nonetheless, it has presented a topping situation and defined a lower target as follows:
- TG-Lo = 66.62 - 13 FEB 2015
OVERALL:
The nominal targets offer low-probability attainment against high-probability reversibility, meaning that any of the TG-Hi, -Hix, -Lo, -Lox represent extended conditions wherein market will tend to loss velocity and reverse in the order of 0.618 and beyond. This is in contrast to the numerical targets (TG-1, TG-2, ..., TG-n ...) where price has a high-probability of attainment, but low-probability of reversal. instead, at these numerical target levels, price will not reverse, but retrace in the smaller order of 0.382 up to 0.618 - In this situation, the targets are calling for a high-probability reversal at the levels defined.
Going forward, I would pay particular attention to the geometric developments. The EW's ED has its own merit, but one that may be best supported by the metric precision of the WW. Taken together, whey will only affirm any confirmation otherwise granted on their own merit.
Directional bias is bearish. Yet, indicator is neutral until the geometries play out.
Stay tuned,
David Alcindor
Predictive Analysis & Forecasting
Denver, Colorado - USA
-----
Twitter:
@4xForecaster
Linked-In:
David Alcindor
-----
.
#USDollar Stands At Crossroad; Favors Decline | $USD $EUR $DXYFriends,
A LOW-PROBABILITY RALLY:
At this point, USDollar index has reached a significant bearish entrenchment level. Transgression of this level would open the roof up to higher-highs, starting with a probable 1.618 extension as a point of termination for a 5th wave. However, what is occurring at the moment resembles more an Elliott Wave 5th wave truncation.
PREDICTIVE/FORECASTING MODEL:
Predictive/forecasting model is turning to the bear side at this moment and provides its own targets, as follow:
1 - TG-Lo = 89.27 - 11 FEB 2015
and
2 - TG-Lox = 88.26 - 11 FEB 2015
PATTERN ANALYSIS:
Internal to the Elliott Wave's presumed truncation is the geometric development of a Triple-Top pattern, composed of an initial down-swing parabola, followed by a deeper-swing parabola.
This pattern is better known as a Kiss of Death ("KoD"), carrying some probability of sending price down to a level that should be lower than the lowest of the two parabola.
STRUCTURAL: ANALYSIS:
As the KoD defines its nadir at 93.26, this level aligns with a prior structural-top, this defining the resistance-turned-support ("R/S") mantra of a classic pivot level. This level could well be kept in sight by the most conservative player, although a bolder trade is offered by a richer RR ratio from the current level in which KoD completed (point-3 in purple).
OVERALL:
Standard geometry (triple-top), advanced pattern (KoD) and proprietary model are favoring a decline from this level. A break of 95.48 level should serve as a trigger to abandon any immediate bearish scenario. However, the current level offers a generous RR that would be hard to resist.
If price did roll in the direction that would breach the nadir of KoD, it would effectively define a new structural level confirming a directional bias and thus opening the floor to stilll distant prop targets.
Stay tuned,
David Alcindor
Predictive Analysis & Forecasting
Denver, Colorado - USA
-----
Twitter:
@4xForecaster
Linked-In:
David Alcindor
-----
.

Backward Market Geometry | #technicalanalysis #forex #fibonacciFriends,
As I come across comments on the charts in which traders overlay simple geometries, I thought I should point out to the ones that have been most important in my experience, in terms of how reliable they have been.
THE STANDARD AB=CD PATTERN:
To start the enumeration of the most common ones, let's name the most obvious ones, the a-b = c-d symmetrical pattern.
In its most mundane form, the a-b = c-d represents a balancing of a geometric form in which the ab segment is reproduced following a shallower retracement in the order of 0.382 to 0.786 Fibonacci range. What ensues is simply a cut-and-paste version of the a-b segment into a c-d segment.
In the chart, you will see this in the large RED dashed figure.
REITERATION OF THE STANDARD AB=CD PATTERN:
While there is a possibility of reiteration of the ab segment into a c-d, then a e-f segment (see YELLOW pattern in the price field), this represents a lesser occurrence.
FIBONACCI CAN HELP MEASURE THE EXTENT OF THE PATTERN:
The type-A trader might be tempted to look for a perfect replication of a-b into c-d, but this is rarely the case, as the market will expand at its own whim. Be flexible and let the market breathe a little.
Still, the trader interested to keep a pulse on these development should remain on guard with such Fibonacci-paced extensions as 1.272, 1.414 and 1.618 x the b-c segment, or in the case of a reiteration, 1.272, 1.414 or 1.618 x d-e segment.
MOST RELIABLE SIMPLE GEOMETRY:
In my experience, most novice pattern traders have calibrated their visual cortices to scan for forward-moving price action, over which they draw a line and look for a symmetrical repetition, so as to decipher the all-too familiar a-b = c-d symmetrical pattern.
Instead, I recommend that you seek out not the FORE-ward, but instead the BACK-ward leaning price action. In this geometry, you will have to reverse your mind's eyes, looking for a symmetrical repetition in which the a-b = c-b segment is drawn lines leaning in reverse of the standard symmetrical a-b = c-d pattern.
This pattern has a name: The One2One (purple in the chat)
OVERALL:
In my experience, the completion of these symmetrical patterns are rarer, but accompanied by a most forceful price reaction upon completion of the reversed a-b = c-d geometry.
Think backward. Stay ahead.
David Alcindor
Predictive Analysis & Forecasting
Denver, Colorado - USA
-----
Twitter:
@4xForecaster
Linked-In:
David Alcindor
-----
.

Long Prospect In Brit | $GBP $USD #BOE #fibonacci #forexTRADE PROFILE:
Long prospect given two structural "lines in the sand"
- 1.53511, marking a probable bullish momentum
or
- 1.52005, marking a probable retracement into bullish entrenchment range (1.50360/1.49959)
PREDICTIVE/FORECASTING MODEL:
Model defined the following bullish target:
- TG = 1.64116 - 09 FEB 2015
FIBONACCI ANALYSIS:
Model's target comes out to be slightly higher than the standard 0.618 retracement of the multi-month bearish swing which appears to have completed recently.
PATTERN ANALYSIS:
A look at the DAILY chart would reveal a Scott Carney's Bullish Shark completion, with a potential reversal towards a 5-0 pattern, which would represent the expected rallying from current lows.
OVERALL:
Note that at this point, I am adopting a premature bullish stance relative to the recent predictive/forecasting analysis that called for slightly lower targets.
In the prior analysis, a numerical target (high probability hit, low-probability reversal was hit at 1.50074, whereas two nominal targets (low probability hit, high-probability reversal) at TG-Lo = 1.4942 and TG-Lox = 1.489 on 22 JAN 2015 have remained unanswered - See prior analysis in reference here: as well as former analyses here, as follows:
-
-
However, significant structural advanced have taken place to cause my abandoning these last targets and turn my sight to loftier, newer targets, as defined above.
Stay tuned,
David Alcindor
Predictive Analysis & Forecasting
Denver, Colorado - USA
-----
Twitter:
@4xForecaster
Linked-In:
David Alcindor
-----
.

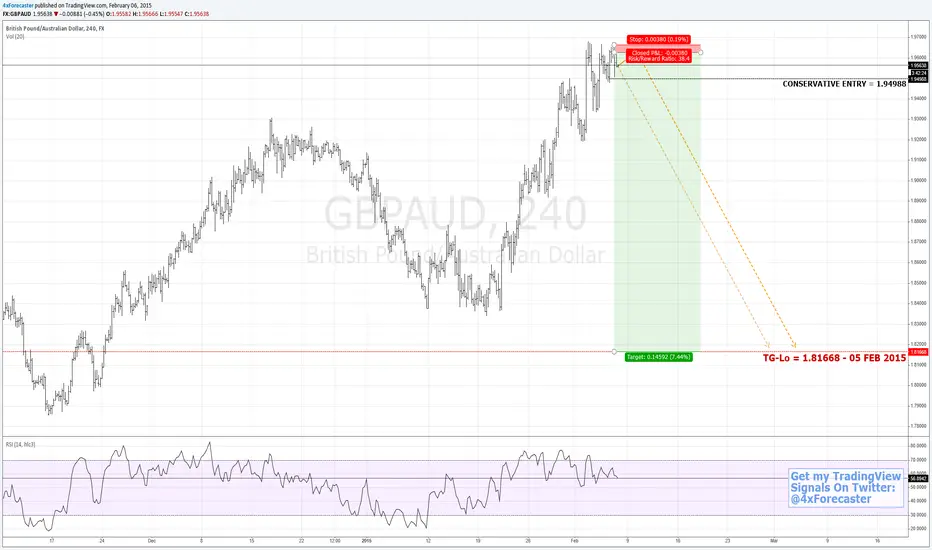
Trade Opp @ 1.96260 | $GBP $AUD #BE #RBA #forexTrade Profile:
SL = 1.96640
Entry = 1.96260
Target = 1.81668
Alternate (Conservative) entry = 1.94988
RR = 38.5 to 1
OVERALL:
- Low risk, low exposure. Conservative entry should consider a lower SL (recommending 0.886 of prior swing).
- Trade invalidates at SL; Would reconsider re-entry at conservative level if resumes in that direction and model remains bearish.
Stay tuned,
David Alcindor
Predictive Analysis & Forecasting
Denver, Colorado - USA
-----
Twitter:
@4xForecaster
Linked-In:
David Alcindor
-----
Check out recent similar Trade Opps:
- $AUDCHF:
- $GBPJPY:
-----
David
Nears Bottom; Model Offers Bullish Targets | #gas $NGAS #oilFriends,
Natural gas ($NGAS) is coming to a technical floor per Elliott Wave count as well as predictive/forecasting model.
WAVE ANALYSIS:
- ELLIOTT WAVE:
Price action in this 8-hour chart illustrates a recent down-swing consistent with an Bearish Elliott Wave impulse, whose internal construction suggests a near completion, as price appears to negotiate a 5th wave conclusion.
- WOLFE WAVES:
Standing in the background appears to be a Wolfe Wave pattern, engulfing the entire Elliott Wave construct. In its most basic form, Bill Wolfe's Wolfe Waves requires that:
1 - Waves 1-3 and 2-4 be declining in the same direction (here: down)
2 - Waves 2-4 be converging
and that:
3 - Point-4 be situated between Points 1 and 2, although this would only belong to the strictest definition, and these are empirical observations, as there is no formal literature from its author on this advanced pattern.
PREDICTIVE ANALYSIS & FORECASTING:
The predictive/forecasting model is calling for a bottom-most tolerable support as the "Lox" target (i.e.: extreme low value), defined as:
- TG-Lox = 2.542 - 28 JAN 2015
Model also offers the following ensuing bullish NUMERICAL targets:
1 - TG-1 = 3.285 - 28 JAN 2015
and
2 - TG-2 = 3.798 - 28 JAN 2015
... as well as this top-most NOMINAL target:
- TG-Hi = 4.343 - 28 JAN 2015
OVERALL:
An interim decline should serve to complete a set of background geometries. However, a reaction to the top-side is likely to prop price up to the defined targets. Directional indicator will remain NEUTRAL until this last fifth wave concludes.
Stay tuned,
David Alcindor
Predictive Analysis & Forecasting
Denver, Colorado - USA
-----
Twitter:
@4xForecaster
-----
Last successful $NGAS forecast:
-
-
-

EAGLE Strat: Short Opp | $GBP $JPY #BOE #BOJ #forexTRADE OPP:
- Short Opp as per chart
TRADE PROFILE:
1 - Entry @ 19.275 (pending)
2 - SL @ 179.385
3 - PT @ 175.908
-- RR = 30.61:1
APPLIED STRAT.:
E.A.G.L.E.
=(E)xtremely (AG)gressive (L)evel of (E)ntry
BACKGROUND PATTERN
Scott Carney's Bullish Shark
ALTERNATIVE:
Entry @178.893 (back-up/conservative)
David Alcindor
Predictive Analysis & Forecasting
Denver, Colorado - USA
-----
Twitter:
@4xForecaster
-----

Significant Rally Opp; Beware Of 7-Legged Triangle $CAD $JPYFriends,
Model proposes a set of lofty and loftier targets provided that the following conditions are NOT met:
1 - Line A-e fails
2 - Line a-c-e validates Point-g to complete a large 7-legged expanding triangle
3 - Line a-g fails to express an #Elliott Wave Expanding Triangle through Points A, B and C.
TRADE STRAT NOTE:
One significant factor that might support above bearish development is the morphology of most recent bearish swing, expressed from Point-f to recent low. A rallying from current low might still be limited, allowing the Elliott Wave to complete at or below Point-g - I have entered a LONG trade here on the premise that the A-e Line is defining a dynamic guideline along which a SL is allowed to find a concrete place of definition. IF and once this A-e Line fails, I would know to stay cash, rinse and repeat at Point-g.
PREDICTIVE /FORECASTING MODEL:
Model defined the following lofty targets as:
1 - TG-Hi = 103.978 - 27 JAN 2015
and
2 - TG-Hix = 114.716 - 27 JAN 2015
A wide variability can occur in terms of price action, especially as the current price on this 2-DAY chart continues to weave a potential Elliott Wave's Expanded Flat, on the back of a current bearish swing (points f, g) that may take on the shape of an impulse - in which case, Point-g would become fair game at the very least.
PATTERN ANALYSIS:
Besides the threat of an Elliott Wave Expanded Flat completion, where Point-B should exceed the origination point of Wave-A and Point-C should exceed the termination Point of Wave-A, as well as the possibility that the 7-legged expanding triangle might complete short of Point-g, or may seek completion even below Point-g, one has to look at the WEEKLY chart (not included here) to appreciate the potential completion of a large Bearish Gartley.
The Gartley terminates at Point-D = 0.786 x XA, which would approximate a value of 113.268 ... A bit short compared to the model's TG-Hix = 114.716 - 27 JAN 2015.
OVERALL:
Watch for bearish set of conditions. Model remains bullish in L/T, but intermediate timing will require price to clear bearish technical hurdles - Consider this a counter-trend.
David Alcindor
Predictive Analysis & Forecasting
Denver, Colorado - USA
-----
Twitter:
@4xForecaster
-----
