GRASIMNSE:GRASIM
Note :
1. One should go long with a Stop Loss, below the Trendline or the Previous Swing Low.
2. Risk :Reward ratio should be minimum 1:2.
3. Plan your trade as per the Money Management and Risk Appetite.
Disclaimer :
>You are responsible for your profits and loss.
>The idea shared here is purely for Educational purpose.
>Follow back, for more ideas and their notifications on your email.
>Support and Like incase the idea works for you.
5-0-pattern

US500 Historical Rallies & Pullbacks with a Potential ProjectionI’ve observed the US500’s performance over the years, marking rallies with a blue line and pullbacks with a yellow line. Looking at the chart, a systematic repetition of these movements emerges, which, at first glance, seems to follow a recognizable pattern.
Specifically, I’ve cloned the blue line from the rally that started on 03/23/2020 and ended on 12/20/2021, now represented by a green line, to hypothesize a potential future rally. This clone is based on the duration of previous pullbacks:
The first pullback, before the 2020 rally, began on 02/20/2020 and ended on 03/23/2020.
The second pullback, the current one, started on 02/17/2025 and might conclude around 04/07/2025, potentially paving the way for a new rally.
the angle of those pullbacks is almost identic
This "snapshot" observation suggests we could be nearing a turning point. Of course, this is just a hypothesis based on historical patterns, and I encourage cross-referencing it with other indicators or analyses. What are your thoughts?

BANKNIFTYNSE:BANKNIFTY
CURRENTLY DOESNT LOOK GOOD TO INVEST,
LONG TERM TRENDLINE BROKEN.
ONE SHOULD WAIT FOR FURTHER SUPPORT ON WEEKLY BASIS.
LOOKS TOUGH SHORT TERM AND MID TERM !!!!!!!
Note :
1. One should go long with a Stop Loss, below the Trendline or the Previous Swing Low.
2. Risk :Reward ratio should be minimum 1:2.
3. Plan your trade as per the Money Mangement and Risk Appetite.
Disclamier : You are responsible for your profits and loss.
The idea shared here is purely for Educational purpose.
Follow back, for more ideas and their notifications on your email.
Support and Like incase the idea works for you.

LONG AMD: Keep it simple trends, time and duration3 Positions in AMD from 2018-2025
Duration of trades: 106 - 1,064 days
Gains: +217% - +917%
Closing in on the trend line, look for a bounce at the line or likely if it goes under, wait for a rally back above the line. This chart is set at the daily timeframe. If you trade on the minor volatility within the major trend, I've found the 2 hour timeframe using a combination of indicators, Relative Trend Index and HH and LL, net favorable results.

$NVIDIA ─ Wyckoff Distribution #4 aka Rising Wedge PatternVANTAGE:NVIDIA ─ Wyckoff Distribution #4 aka Rising Wedge Pattern
Although Rising wedge turning into more like Rising Channel distribution idea is still valid.
#2 Long Trade TP1 Hit so far 🔥
------------
------------
Note: This is the most positive outcome possible.
As always, my play is:
✅ 50% out at TP1
✅ Move SL to entry
✅ Pre-set the rest of the position across remaining TPs
It's important to take profits along the way and not turn a winning trade into a losing trade.

EUR/USD - Bull Flag Pattern Breakout in ProgressThis EUR/USD 1-hour chart showcases a classic Bull Flag Pattern , a strong continuation formation indicating the potential for further upside momentum.
- The pair experienced a sharp bullish impulse move, forming the flagpole.
- The price then entered a consolidation phase within a downward-sloping channel, forming the flag.
- A breakout above the upper trendline of the flag could confirm a continuation of the uptrend.
Traders should monitor key resistance levels and volume confirmation upon breakout. A successful retest of the flag's resistance as new support could provide a strong buying opportunity, with the next target potentially aligning with the flagpole’s measured move projection.
As always, apply risk management and consider additional confluences such as Fibonacci levels, moving averages, or fundamental factors.

Bitcoin Analysis: Potential Path to $150K and Market TrendsCurrent Price & Key Levels
- BTC/USDT Price: BINANCE:BTCUSDT (as per chart).
- Critical Support: Bottom of the ascending channel .
- Key Resistance: Upper trendline of the channel (to be confirmed).
Technical Signals
1. Ascending Channel:
- Price is at the bottom of the channel, historically a bounce zone.
- A break above the upper trendline could signal a bullish continuation.
2. Moving Averages:
- SMA 200 (4H) and SMA 20 (1D) are critical for trend confirmation.
- A bullish crossover (e.g., SMA 20 > SMA 200) would strengthen the buy signal.
3. Dominance (BTC.D):
- If Bitcoin dominance turns bearish, expect capital rotation into altcoins (altseason potential).
- Monitor dominance alongside price action for market shifts.
$150K Target: When and How?
- Scenario 1:
- A strong breakout from the ascending channel + rising volume → Acceleration toward $150K.
- Timeline:Mid-2025/Late-2025 (historically aligns with post-halving cycles).
- Scenario 2:
- Slow grind upward with corrections → $150K likely by 2026, pending macroeconomic stability (e.g., ETF inflows, regulatory clarity).
Altcoin Season Watch
- Trigger:
- If Bitcoin’s dominance drops below 57%, altcoins may surge.
- Focus on high-cap alts (ETH, SOL) and narratives like AI, DePIN, or RWA.
Trade Strategy
- Entry:
- Buy on confirmed breakout above the channel + SMA crossover.
- Stop Loss:
- Below the channel’s lower trendline (e.g., $80,000).
- Take Profit:
- targets: $100,000.120,000
- Final target: $150,000 (scale out profits).
Risks to Monitor
- Macro Factors: Fed rate decisions, geopolitical tensions.
- Bitcoin ETF Flows: Sustained inflows/outflows impact momentum.
- Regulation: Crackdowns or approvals (e.g., ETH ETF).
---
Conclusion
- Bullish Outlook: $150K is achievable if Bitcoin holds the ascending channel and dominance remains stable.
- Altseason Hedge: Prepare a basket of altcoins if BTC.D trends downward.
Like, comment, and follow for updates! 🚀

Déjà Vu, BTC's Historical Pattern EncoreIt is possible the pattern that shaped in late 2020 and 2021 might repeat again.
Everything just looks like the previous main high which is selected with the red square in the left of chart.
There is no guarantee even if it happens - movement and ratios of movement can be different.
Déjà vu on the charts isn't by chance.

BTUSDT Analysis 01.04.2025, W- pattern HI,
W- pattern formed in 30 min Time frame ,
Do not ask for Buy or Sell tips .
I/We are not SEBI Registered Advisors. We don't provide any types of Buy/Sell signals. This is purely for educational and learning purposes. We shall not be responsible for your profit or loss. Please confirm with your financial advisor.

KOTAK BANKNSE:KOTAKBANK
Note :
1. One should go long with a Stop Loss, below the Trendline or the Previous Swing Low.
2. Risk :Reward ratio should be minimum 1:2.
3. Plan your trade as per the Money Management and Risk Appetite.
Disclaimer :
>You are responsible for your profits and loss.
>The idea shared here is purely for Educational purpose.
>Follow back, for more ideas and their notifications on your email.
>Support and Like incase the idea works for you.

Euro can exit from pennant and rebound up from support areaHello traders, I want share with you my opinion about Euro. The price was previously trading inside an upward channel, where it consistently rebounded from the support line and moved toward the resistance line. After a final bounce from the lower boundary, EUR made a strong breakout and exited the channel, triggering a powerful bullish impulse. This move brought the price directly to the current support level at 1.0745, which overlaps with the support area. After reaching the local high, the price turned around and entered a correction phase, forming an upward pennant pattern. Inside this structure, we can see how EUR respected both the resistance line and the rising support line of the pennant. Recently, the price rebounded from the support line again, showing signs of strength near the support area, and is now consolidating at the edge of the pennant. This setup often signals an upcoming breakout. I expect the price to break above the resistance line of the pennant and continue its bullish move toward TP1, which is set at 1.0950 points. Please share this idea with your friends and click Boost 🚀

XAU/USD Analysis–Bearish Continuation Within Descending Channel📉 Gold (XAU/USD) H1 Analysis – March 26, 2025
🔻 Descending Channel Formation:
The price remains confined within a downward-sloping channel, signaling continued bearish pressure.
Lower highs and lower lows confirm the short-term downtrend.
📍 Key Levels & Structure:
Current Price: $3,019
Resistance Zone: Around $3,025 - $3,030 (upper boundary of the channel)
Support Zone: $3,000 psychological level and potential lower boundary near $2,985
📌 Market Imbalance (MB) Not Filled:
A minor liquidity gap remains unfilled above, indicating a possible short-term retest before continuation.
📉 Bearish Expectation:
If price fails to break above the resistance trendline, we could see a drop toward $3,000 or even lower.
Watch for rejection signals at the upper boundary for short opportunities.
🔎 Trade Considerations:
Bearish Bias: Short entries from resistance with targets at $3,010 - $3,000.
Invalidation: A breakout above $3,030 could signal bullish strength.

GER40 Long 1. This is with the Daily and H4 trend
2. There is a small pattern on a smaller timeframe however it is a clear enough indicator to support this
3. stop loss of 150 pips
4. Quick trade try to get out at the top where there is a lot of resistance
5. First target at M15 Overbought

TSLA Breakout Retest: What Could Signal Bullish Surge NASDAQ:TSLA Breakout Retest: What Could Signal Bullish Surge – Is Tesla poised for a major move? In this video, I break down the breakout retest pattern on TSLA’s weekly chart, focusing on the critical near term levels. A validated breakout could hint at a higher time frame bullish scenario! I’ll cover:
Rules to validate or invalidate the pattern
Conservative and aggressive price targets
My personal targets based on years of trading experience
Don’t miss this Tesla stock analysis for 2025!
What to Watch For:
Breakout confirmation at $490
Stop-loss zones and risk management
Potential bullish surge targets

$PENGU Falling Wedge Bullish Daily CSECY:PENGU forming a falling wedge this will explote soon guaranteed I’m loading hard already! See you at the top!

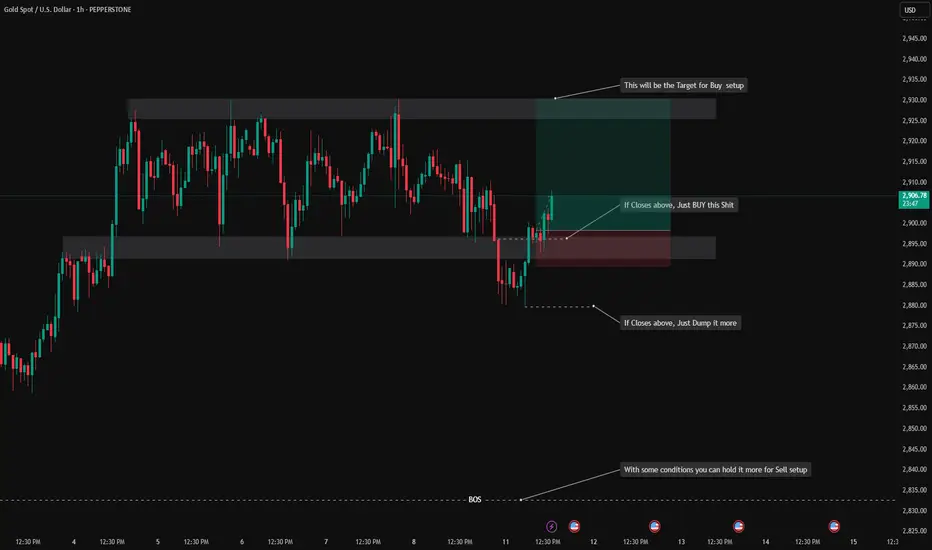
XAUUSD 1H, 11/03/2025, 02:00PMAs i explained this Gold setup its going up. SL below entry candle, Target as mentioned.
JPN225 Short 1. There are multiple patterns on this trade
2. This is with the H4 trend
3. Stop loss of 150 pips
4. M15 and M30 are overbought but might be too early to say there is a lot of divergence

BTC's Potential Up to 77K & Down to 130K? Here’s WhyBINANCE:BTCUSDT has both bullish and bearish scenarios in play now.
These days, the crypto market has been stagnant—no real pump, no real dump.
🔻 If it drops, how low will it go?
There’s a potential multiple-top pattern.
If CRYPTOCAP:BTC breaks below the neckline at $92,000 with volume—or fails to reclaim it—then the target drop sits at $77,000.
🚀 If it pumps, how high can it go?
A potential multiple-bottom pattern is forming.
If MARKETSCOM:BITCOIN breaks above the neckline at $107,000 with volume—or successfully retests it—then the target is $130,000.
🔥 Short-term strategy
The Feb 3rd candle had significant volume and has been a key resistance level multiple times.
This makes it a strong reference point for entries.
(See orange & light blue arrows.)
1️⃣ Long Setup
Entry trigger: $102,500 (Feb 3rd high)
Stop loss: $91,231 (Feb 3rd low)
2️⃣ Short Setup
Entry trigger: $91,231 (Feb 3rd low)
Stop loss: $102,500 (Feb 3rd high)
💡 Prices vary across exchanges. Use the prices from your trading platform.
🔴 Read my signature & publications for more info you don’t want to miss.
🔥 for more future script "guesses" like this!

SOL Potential drops -55% to $131? Here’s WhyBINANCE:SOLUSDT might be forming another right shoulder of a W-bottom (light blue line). The target drop is around $131, which happens to be the mid-point (0.5) of the descending channel—a reasonable support level.
The first right shoulder has already formed, and its drop was exactly the same as the left shoulder—both at -47%.
However, the best-case scenario would be if it finds support at the upper boundary of the descending channel. Let's see if it can hold there.
🔴 Read my signature & publications for more info you don’t want to miss.
🔥 for more future "guesses" like this!
🔥 I've dropped an analysis for the 2025 altseason on the right hand side if you're using computer, and scroll down a bit to see the link if you're using mobile.

GOLD Daily, H4, H1 Forecasts, Technical Analysis & Trading IdeasDaily Timeframe:
TVC:GOLD has been rising rapidly recently but has almost stopped since February 11, when it hit its uptrend channel line.
With the RSI hitting resistance at 77 and showing signs of falling, there is a high probability that a corrective wave is about to begin.
Four-hour Timeframe:
A rising wedge pattern has formed in the price.
As long as the price does not break the resistance at 2955 and the red line of the rising wedge continues upwards, a downward wave is expected to begin.
A strong bearish divergence has also formed in the RSI.
One-hour Timeframe:
A head and shoulders pattern is forming.
If the price can break the neckline downward and the blue trend line of the rising wedge is also broken, the probability of a downward wave will be very high.

US30 LONG 1) All timeframes are oversold
2) There is very strong support at this level as it has been stuck here for a week
3) There is a pattern on H4
4) Against the trend so try to get out at M15 Overbought
5) 120 pip stop loss

CAMLINFINENSE:CAMLINFINE
Note :
1. One should go long with a Stop Loss, below the Trendline or the Previous Swing Low.
2. Risk :Reward ratio should be minimum 1:2.
3. Plan your trade as per the Money Management and Risk Appetite.
Disclaimer :
>You are responsible for your profits and loss.
>The idea shared here is purely for Educational purpose.
>Follow back, for more ideas and their notifications on your email.
>Support and Like incase the idea works for you.

Gold confirmed the breakouthello guys!
as you can see the triangle pattern formed and the price breaks it out!
so the next target will be the blue area!
around the $2990 area!
