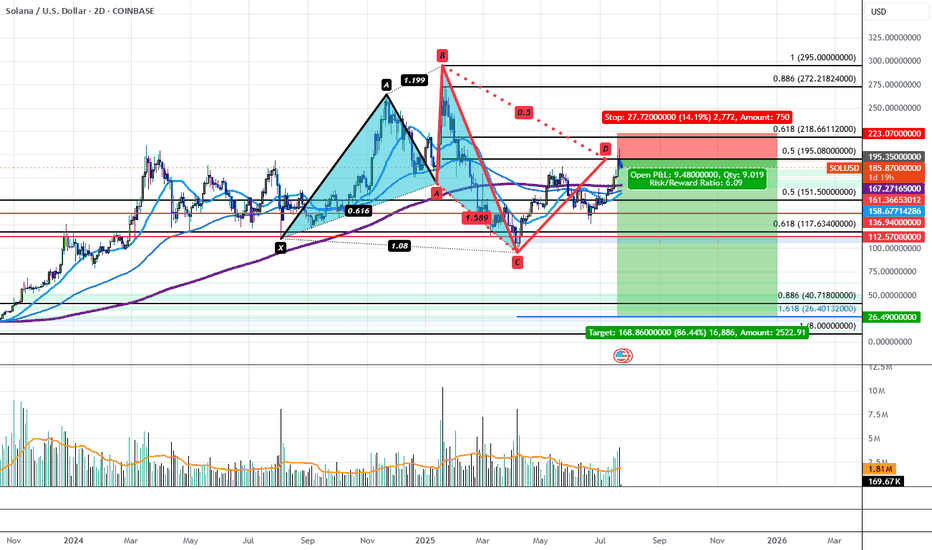
Solana's Bearish 5-0 is Locking in a Bearish Reversal to $26.40Solana has recently run up to Horizontal Resistance Zone of $195-$210 aligning with the PCZ of a Bearish 5-0 and has begun to impulse downwards with volume to back it. This could be the start of a greater move down that would take SOL back to the low of the distributive range at $95.16. If the level breaks, we would then target a drop down to the $40.72-$26.40 confluence area aligning with the all-time 0.886 retrace as well as the 1.618 extension from previous swing low to high. Only at these levels could we even possibly begin to consider Bullish Entries on Solana.
5-0 Pattern
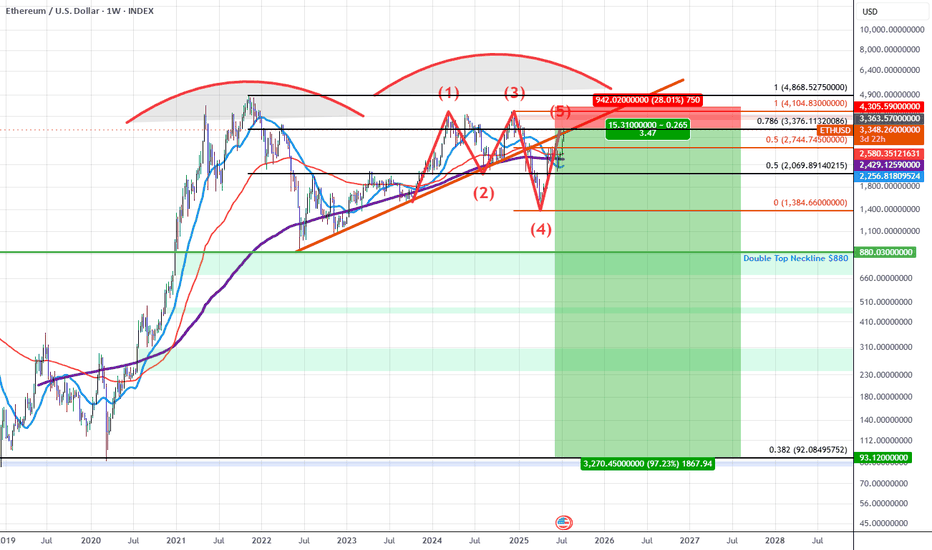
ETHUSD: Double Top into A Bearish 5-0 Breakdown (Extended)Updated Commentary: ETH has extended a bit further than projected as the Pattern Completed at the 0.618 but ETH gapped into the 0.786 instead. The gap up aligned with an upside gap fill on the CME futures as well as a gap fill on the grayscale ETH futures ETF $ETHE. The easier move from here to simply add to the ETH shorts and adjust the stop to be above the previous highs while sizing up at the 0.786 and playing off this gap higher as an anomaly. Beyond this, my view on ETH at the current 0.786 retrace remains the same as the original Idea posted as ETH rose into the initial 0.618 PCZ the details of which I will also include once again below as it still remains relevant.
ETH for the last 5 years has been developing a Double Topping pattern which has put in a series of lower highs during the most recent 2nd run up. As we've confirmed these lower highs we've broken down below trendline and are finding resistance at the trendline which happens to have confluence with the PCZ of a Bearish 5-0 wave formation near a 0.786 retrace.
As we begin to find weakness and Bearish price action begins I suspect price will make it's way towards the neckline of the double top aligning with the $880 price level if ETH breaks below that level there will be no significant support until it reaches the all-time 0.382 retrace down at around $92.10.
In short it seems ETH is in the early stages of a macro breakdown which could result in value declines greater than 80%.
I also suspect that we will see many of the assets that ran up significantly going into this week to sharply reverse those run-ups as this week comes to a close and the new week begins mainly due to the effects of OpEx, this includes: Bitcoin, MSTR, SOL, XLC, META, and BTBT. Long-dated Put accumulation on these assets at these levels is far easier to manage than naked short positions and that's how I will go about positioning here.
GBPJPY: Bullish 5-0 Setup on the 4-Hourly ChartFrom a higher-timeframe perspective, GBPJPY might seem like it's perfect for a shorting opportunity, but that doesn't mean there aren't great opportunities to go long as well.
Right now, on the 4-hourly chart, I've spotted an interesting Bullish 5-0 setup. To many traders, this might look like an invalid entry. But here’s the catch—if you know how to interpret candlestick patterns correctly, this is exactly the kind of setup that can pay off.
Here’s the Plan:
Bullish 5-0 Pattern Entry: Keep an eye on candlestick confirmations at the current zone.
Risk Management: Identify the key levels clearly—once price reaches these levels, shift your stops to entry to achieve a risk-free trade.
Key Reminder:
It’s not always about being right in direction; it’s about spotting clear entry setups, managing your risk effectively, and protecting your capital.
👉 Golden Rule: Secure a risk-free trade as soon as possible!
Have you traded the Bullish 5-0 before? Do you have similar experiences spotting opportunities against the broader trend?
Let’s discuss below! Happy trading, everyone! 🚀
Swimming Amongst SharksStarting with the boring range in February, BTC consolidated after making new ATHs on the day of President Trump's second term inauguration.
After a slow month of sideways action in February, we finally reached the apex of a symmetrical triangle and proceeded to dump, attempting at closing the breakaway CME gap @ ~76.5k. It quickly and violently bounced to 95k where we spent the next 51 days making new lows and ranging in the 80k region.
When we take a closer look at the fibonacci retracements of all of these moves, they are very technical.
When pulling a standard fibonacci retracement XA, we find that B falls perfectly within the golden pocket. Roughly 2 weeks later, we find ourselves at new range lows offering a very nice SFP reaction at point C which falls at the 1.272 fib expansion of AB.
In hindsight, this would have been the perfect place to get into a long position. But, unfortunately, I was looking for new lows around ~70k as this is where the 1.618 level was from a fib expansion of AB. This was during the time when tariffs were first being announced, causing major volatility across all markets. People were panic selling and calling for an economic crisis because of Donald Trump's tweets causing erratic behavior in markets.
We rally for the next 36 days offering no significant pullbacks to be able to get in on a long as it always seemed that we could get in on weakness as the rally produced a lot of SPs.
Now the BC expansion shows that we are nearing the end of this rally if this shark harmonic is to play out.
Waiting on confirmation of point D, but it is very possible that the high is in, and we start fulfilling this shark harmonic.
This would fall perfectly in line with the old adage "Sell in May and go away." or at least, first signs of weakness in May, and don't get chopped up.
There has also been a couple of potential events that could be classified as "black swan" that would affect the markets negatively like Coinbase announcing a user data leak, and Moody's downgrading of U.S debt.
Overall, we could see this shark harmonic be part of a HTF trend, coiling up before the next big move that breaks out near the end of summertime.
Always important to remember to practice proper risk management and that no trade is still a trade.
4/22 Gold Trading StrategyGold continued its upward movement yesterday. Short positions around 3380 yielded limited gains, while those near 3410 are currently underwater. Many traders may be in a similar position, and I want to emphasize: there’s no need to panic—today offers a strong opportunity for the bears.
Technically, gold is now in the final stage of a five-wave upward structure . The bullish momentum is fading. The remaining upside is likely limited to within $50 , while the downside potential could exceed $80. In short, there’s an 80%+ chance of a pullback or consolidation today, offering a solid exit or profit opportunity for short positions.
The price is expected to retrace below 3360, and once profit-taking begins, the decline may accelerate.
Trading Strategy for Today:
Sell between 3450–3480
Buy between 3330–3310
Trade flexibly within 3440–3400 / 3410–3355
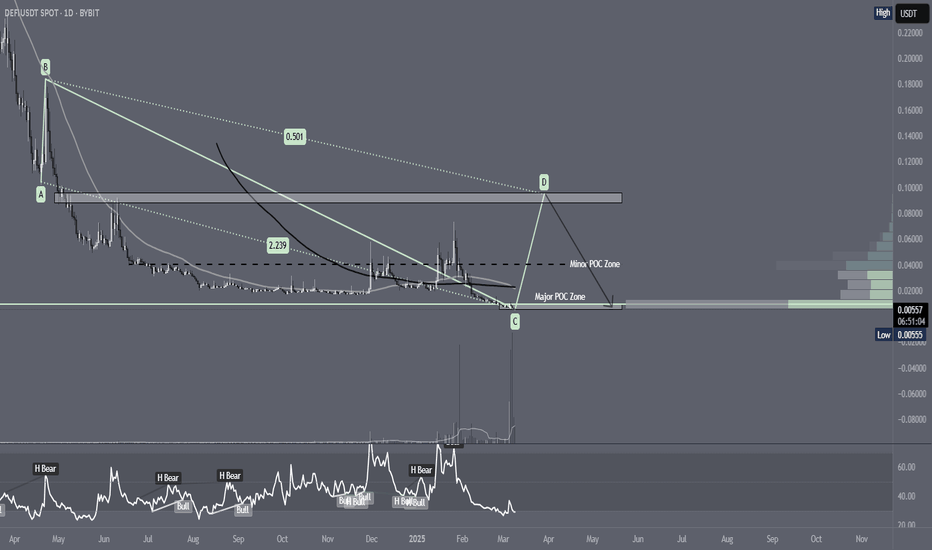
De.FiDEFIUSDT has now in the Major POC Zone and the price is at a Lower Low after accumulating for almost a year and will continue to accumulate in the next month, but for now, the price movement shows a 5 drive pattern plus the indicator shows a very significant volume for the past few months.
In addition, Decentralized Finance is now attracting the attention of retail investors because of the potential for governments to create regulations that integrate TradFi and DeFi to drive economic growth by utilizing technological advances.
Nifty has technical potential to reach 20,300 by end of June'25With the current situation of Nifty and Global market, Nifty has formed 5-0 pattern.
There are following conditions that can lead Nifty towards 20,300 by end of June'25. There is a gap of 4th Dec'23 and potentially it can be filled.
Target1; 21840 If Nifty close below 23250 on Week Time Frame
Target2; 21000 and it will be strong support
Target3; 20300 to fill gap of 4th December 2023
SDL NZ On medium to long term buy watchlistCurrently in a restructure, small cap stock with good fundamentals i.e. profitable and current ration of 2.0
is a software based company so has the ability to scale quickly without large investment
Will be eyeing up a position around $0.42, with first target around $1.50 and possible exit around $2.45
This is a monthly chart so is a long term trade...
Option B could be sell enough to get original money back at $1.50 and reinvest elsewhere while holding the rest till $2.45 to cash in
⚠️Bitcoin Analysis (Mix of Patterns)⚠️👋Hi, everyone. First of all, I apologize for the chart being busy, but I think all the lines and zones are needed to better understand it.
🏃♂️Bitcoin is moving in two descending channels : a ⚫️Black Descending Channel⚫️ and a 🟣Purple Descending Channel🟣 . Also, it is currently moving in the 🔴 Resistance zone($66,050-$64,520) 🔴and near the Upper line of the descending channel and 50_SMA(Daily) and Time Reversal Zone(TRZ) .
📈If we want to look at the chart from the point of view of the Classical and Harmonic patterns , Bitcoin has succeeded in breaking the lower line of the Symmetrical Triangle Pattern , and it seems that a Bearish 5-0 Harmonic Pattern is forming near the upper line of the 🟣descending channel🟣.
💡Before concluding, let's take a look at the Market Cap USDT Dominance% (USDT.D%) chart.
💡 USDT.D% broke the 🔴 Resistance zone(4.72%-4.53%) 🔴 as I expected and is currently pulling back to this zone, the pullback structure seems to be forming with the Falling Wedge Pattern , I expect USDT.D% to rising again and this It will cause another decline in the cryptocurrency market .👇
🔔I expect Bitcoin to start falling again based on the above explanation.
❗️⚠️Note⚠️❗️: An important point you should always remember is capital management and lack of greed.
Bitcoin Analyze ( BTCUSDT ), 4-hour time frame ⏰.
Do not forget to put Stop loss for your positions (For every position you want to open).
Please follow your strategy; this is just my Idea, and I will gladly see your ideas in this post.
Please do not forget the ✅' like '✅ button 🙏😊 & Share it with your friends; thanks, and Trade safe.
SPX500USD: Bullish 5-0 at 0.618 RetraceThe SPX is trading within a Broadening Top near the Demand Line of the pattern, aligning with the 0.618 Retrace after developing a Bullish 5-0 Harmonic Wave Structure. If it plays out we should get a Higher High within the range, which could take us to the Fibonacci Extensions above the current highs.
Buying Opportunity on NZDUSDThis week, I'm eyeing a potential buying opportunity on NZDUSD, and here's my trade plan:
1. Bullish 5-0 Pattern on Weekly Chart: The NZDUSD is currently in the zone of the Bullish 5-0 Pattern on the Weekly Chart, signaling a potential buying opportunity.
2. 4-hourly Chart Setup: The 4-hourly chart presents a candlestick confirmation at the Potential Reversal Zone (PRZ), indicating a possible entry point for long positions.
3. Confirmation with 3-Bar Reversal: Despite the candlestick confirmation at the PRZ, I remain cautious and will wait for further confirmation. I'm looking for a 3-bar reversal pattern, where the next candle closes above 0.6089 and retests the level at 0.6083 before considering a buying opportunity.
By waiting for the 3-bar reversal pattern, I aim to ensure a stronger confirmation of the bullish momentum before entering the trade.
What are your thoughts on NZDUSD? Feel free to share your trade plans and insights below!
Wishing everyone profitable trading ahead!
Bullish Flag Breakout and 5-0 Pattern Combo TradeI'm closely monitoring AUDCAD, and here's why:
1. Bullish Flag Channel Breakout on 4-hourly chart:
- AUDCAD has recently broken out of a Bullish Flag Channel on the 4-hourly chart.
- This breakout suggests a potential bullish move in the market.
2. 5-0 Pattern on 1-hourly chart at 0.8829:
- Waiting for a retracement, I'm eyeing the completion of a 5-0 Pattern at 0.8829 on the 1-hourly chart for a potential long opportunity.
- Utilizing a combo trade strategy to manage risk and enhance returns.
This combo trade involves combining the breakout from the Bullish Flag Channel with a harmonic pattern entry on a lower timeframe (1-hourly 5-0 pattern).
Feel free to share your insights and trade plans for AUDCAD in the comments below. Check the chart link for a visual representation.
Bullish 5-0 vs. Type2 Bearish Shark PatternIf you're navigating conflicting biases, here are two potential setups:
1. Bullish 5-0 Pattern at 149.96: Long Opportunity
- Engage in a long position based on the completion of the Bullish 5-0 pattern at 149.96.
- This pattern signals a bullish bias, providing an opportunity for traders expecting an upward move.
2. Type2 Bearish Shark Pattern at 150.67: Shorting Opportunity
- Consider a short position if the Type2 Bearish Shark Pattern completes at 150.67.
- This approach factors in the possibility of Fed rate cuts in June, potentially influencing a bearish move.
As a trader, it's essential to weigh the conflicting signals and align your strategy with your overarching market outlook. Feel free to share your preferences and insights on these setups.
NVDA Is Forming 0-5 Pattern .the detail is shown in the above Idea.
I made this Idea based on Candlestick Analysis and Harmonic pattern.
Bullish 5-0 pattern should be formed, not necessarily mandatory, in the downtrend so it can have a much higher success rate.
Bullish 5-0 is drawn as Shark pattern, but with additional C-D leg. That means you can first have the Shark pattern on the chart and then wait until C-D retracement happens.
B-C leg has two Fibonnaci rules so you can watch two bullish scenarios. The final difference will be in your profit target because the C point has two different lengths.
You need to watch out that the A-B leg is reciprocal to C-D leg, AB=CD, to pattern be valid.


