Weekly may close well under 50 weekly ma, higher low expected. As I said in previous posts the weekly 50 moving average would be crucial to watch and even though we wicked above it we may very well now close our weekly candle well under it at this rate after a stiff rejection as the weekly 50ma maintains resistance. I anticipate we will simply form a higher low from here or a capitulation drop...one of the 2. either way the good news is the Bull market is very near.It will hopefully find support by at least the weekly 200ma but that is still a significant drop downwards. I anticipate considering how logn the bull climb went that a big chunk of May could end up on the down trend but we will have to wait and see how things bounce...this drop could also happen all at once in which case the bounce back could allow may to still be bullish. If somehow we close this weekly candle above the 50 weekly ma my outlook will turn back bullish until I see what the follow up weekly candle does...but as of now it doesn't seem likely that this weekly candle will close above it. To play it safe I sold aroun 5472 right at the 50 week. I have a smart stop buy set up a few pips above there in case an unexpected reversal is to occur. Lastly I anticipate this incoming drop to be significant enough to cause the golden cross to dip abc down and create a temporary death cross in the process.
50ma

can weekly 50MA flip to support? Crucial to avoid a correction.must keep a very close eye on this weekly 50ma we are now above...it can easily still get rejected and even though we are above it at the moment until we sustain it as solidified support it has great potential to ultimately reject priceaction and send us back down for what will likely be higher low...how far down that will be is hard to say but it can drop quite a bit and sill become a higher low after all the bullish priceaction we've had the past couple months. Be cautious and wait until you see the 50 week solidify as consistent support before putting the bull blinders on. Either way we can tell the bull market is very near.


ETH is Ready for Bull runis BITFINEX:ETHUSD ready for Bull Run ?
We've been in a long bear market (still in bear) since the intersection of 50 MA and 100 MA.
If the 100 MA is above 50 MA, the prices are falling.
We are now approaching a new intersection.
If the 50 MA 100 MA cuts in, the prices can start to rise.
Of course, according to the movement of COINBASE:BTCUSD everything can change.

BTC finally surpasses 1day50ma…but finds a potential double top Finally breaking above the 1 day 50ma with authority was a great bullish sign up until the price action reached the double top point. As soon as price action retreated right at the double top point exactly it gave a great opportunity for the bears to shove the price action back downward. It may be a good risk reward zone her to exit my position and set a stop buy up just above the double top zone. If I were to wait for a little while for a bounce I would definitely wanna exit if I see the price action fail to close above the 1 day 50 ma for 2 consecutive day candles. Just as I wouldn't wanna get too excited about being above the 1 day 50ma until we have closed at least 2 1 day candles above it as well. This idea will remain neutral but I will be keeping a very close eye out for any sort of confluence that validates the potential double top that we have shown here on this chart on the frosted pink horizontal trend line. If we can form a higher high here above the frosted pink trendline I will definitely be siding more with the bulls. Thanks for reading! *not financial advice*

Yellow falling wedge breakout target reached. We have reached the breakout target for the yellow falling wedge. Price action actually went halfway between its target and the slightly larger red falling wedges target...finding resistance at a former strong horizontal teal trendline. What momentum we had from the breakout of the yellow and red falling wedges may now be gone as we can see the price action has been shoved back inside the biggest falling wedge (in green). Without any further momentum the probablity of us heading back downward towards the 1 week 20ma and the bottom trendline of the green falling wedge has greatly increased but I will leave this idea neutral for nw until I see whether or not we may form another bullish pattern here or not. Ultimately for now it appears as if the 1 day 50ma is going to maintain it's strong resistance.I will wait for 5 consecutive closes below the 4hr 50ma before I decide to exit my position. Just my strategy and not financial advice.

as expected 4hr 50ma pushes out of wedge…1day/4hr 50ma showdown?The 4hr 50ma has me still temprarily hodling as it has hoisted priceaction up out of the falling wedge in a way that will very likely trigger the breakout. 4hr 50ma is now guarding the door back into the wedge....We will likely see a brakout triggered due to this which will result in at least a temporary bullbreak at least up to retst the 1 day 50ma again....as anticipated in the previous idea, it seems more and mroe likely that the 1 day 50ma and the 4hr 50ma are engaged in a showdown that will probably not be over until they are close enough together to squeeze the price action like a pair of chopsticks until it shoots one way or the other based on which timeframes 50ma is the most dominant. I don't know what they call it when a 50ma on one time frame crosses over another 50ma on a bigger timeframe...if it doesn't already have a name I'm gonna refer to it as octave hopping.

BTC 4hr 50ma trying to lift price action out of fallingwedge It's come down to the strong support of the 4hr 50 ma vs. the strong resistance of the 1 day 50ma...who will win? We can see here on the 4hr chart that the 4hr 50ma is doing its best currently to hoist the price action up out of the falling wedge for a breakout but each and every time it tries to breakout the 1day charts 4hr 50ma gives it a strong rejection back down into the wedge. For now I'm bullish until both moving averages get slightly closer to eachother once price action is finally getting squeezed between the 2 like a pair of chopsticks I will be more neutral, however, btc may have gained enough bull momentum from the breakout of the wedge to help the 4hr 50ma muster the strength to overcome that resistance and actually solidify it as support for once. I've been consistently saying this whole time that we need to solidify the 1 day 50ma as support in order to sustain any further bullish upside. That remains true...so in the short term until we get back up to the 1 day 50ma I'm bullish then when we get there I'm neutral until I see it flip to solidified support...if it can do that then I'm definitely long. Mainly for the immediate future I think the 4hr 50ma is powerful enough to at least reach the 1 day 50ma before potentially solidifying as any kind of resistance.

AAPL and lessons in the power of math When people try to tell you all markets are manipulated, they are wrong. The math is key and charts are very algorithmic.
Case and point: AAPL
Bad earnings but it pumped. Is it manipulation? No. APPL was in a clear uptrend with resistance at .5 Fibonacci on the weekly and more resistance at the 50 MA on the daily. It was destined to hit these points and likely to reject.
Would not long until a decisive breach above these areas.

2 BTC to 20 BTC Trading Challenge - Day 14 (1.4252 BTC) Disclaimer: If you are primarily interested in copying other people’s trades then this is not for you. However, if you are willing to put in the work that it takes to learn how to trade for yourself then you have found the right place! Nevertheless please be advised that you can give 10 people a profitable trading strategy and only 1-2 of them will be able to succeed long term. If you fall into the majority that tries and fails then I assume no responsibility for your losses. What you do with your $ is your business, what I do with my $ is my business.
Click here for my Comprehensive Trading Strategy | Click here for my Comprehensive Trading Process | Click here to learn about the 2 BTC' to 20 BTC' Trading Challenge
I might have had a little bit too much fun last night. I went to a bluegrass concert that started at 9:00 and I must have had too much to drink because I still feel like shit at 6:15 pm the next day.
The struggle is real!
Not having anything to drink tonight and I am looking forward to feeling like a champ again tomorrow.
The markets have sure been interesting. Starting to track the futures curve is the only reason that I didn’t short BTC after yesterday’s close and I am sure glad that I didn’t! As long as we continue to hold support I gain confidence that $4,200 resistance will break and then we will be in for a strong 1 month + dead cat bounce.
The S&P 500 looks like it is just coming to the end of that type of bounce. The TD Sequential is on a red 9, we have multiple reversal candles and there is a cluster of resistance from $2,600 - $2,650.
USD:TRY continues to head fake > $5.5 and continues to close below the TDST level at that price. The M MA is diverging in a bullish manner and support continues to move up. This is my single favorite trade for 2019 and if we can close a daily candle > $5.5 then I think we should really start to pick up momentum.
Open Positions
Long: USDTRY
Price: $5.55804
Projected Risk: 5.66%
Leverage: 100X
Exposure: 0.16 lots ($16,000)
Margin: 0.048 BTC
Unrealized PnL: -0.087 BTC
Notes: Support holding above the phase 3 trendline is going to be very important for me to maintain a healthy bankroll for this challenge.
Long: USDZAR
*1/3/19 SCALE OUT: P < S MA = 5%. However minimum available to scale out was 8%
*1/6/19 SCALE OUT: P < S MA (5%) + Bearish M MA (30%) + Bearish Cross with S & M MA’s (15%) + P < flat L MA (25% - 50%)
*1/7/19 SET STOP LOSS: Stop loss set at $13.489 for remainder of position.
*1/9/19 ADJUSTED STOP LOSS: Moved stop to $13.64 due to expected support from 200 MA.
*1/11/19 DEATH CROSS signals final scale out. However on TD red 9 at horizontal and trend support. Leaving stop at $13.64 due to bullish 200 MA and support cluster. Negligible difference in risk, huge difference in potential gain.
Price: $14.48
Projected risk: Market stop set at $13.49
Leverage: 100X
Exposure: 0.06 lots ($6,000)
Margin: 0.0157 BTC
Unrealized PnL: -0.075 BTC
Realized PnL: -0.086 BTC
Short: SPX500
*1/4/19 ADD TO POSITION: S MA making bearish cross with M MA = 15% added
*1/6/19 SCALE OUT: P > S MA (5%) + bullish M MA (30%) + Bullish cross with S & M MA’s (15%) = 50%
*1/11/19 GOLDEN CROSS does not necessarily signal scale out due to angle of L MA. Stop loss set at $2,656.
Price: $2,472.62
Projected Risk (horizontal resistance at $2,650): 7.44%
Leverage: 100X
Exposure: 0.09 lots ($22,276)
Margin: 0.0586 BTC
Unrealized PnL: -0.289 BTC
Realized PnL: -0.129 BTC
Notes: Major horizontal resistance from $2,600 - $2,650. Stop set at $2,656. Really want to see this week close < the 9 MA.
LONG XRPH19
*1/11/19 SCALE IN: P < Bullish L MA represents oversold asset in bull market.
Enter: 0.00009135
Stop: 0.00008888
Risk: 2.7%
Exposure: 20,267 XRP (1.8518 BTC)
Leverage: 15X
Unrealized PnL: +0.0111 BTC
Realized PnL: -0.0046 BTC
Notes: Entry was not based purely on Consensio. Bitcoin futures curve in backwardation with widening spread is main reason I was looking to add to my long exposure. Also looking at confluence of support from trend and horizontal. Guidelines would have me waiting for close above S MA to start scaling in, but I really liked the risk:reward provided at today’s close.
Open Orders
*1/10/19 AMENDED stop market to short XAUUSD. Moved entry up to $1,284 due to that being below horizontal support & parabola and it provided better risk:reward. Consenio signaled entry today, but I’d prefer to wait for further confirmation.
Watchtower
USDHUF: 18 year symmetrical triangle.
USDJPY: (leaning bearish) Consensio is bearish on Monthly chart indicating that the triangle has a greater chance of breaking down. Tightest monthly BB has been since 1976 when the price proceeded to move 41% in ~21 months. Think that retesting $80 is most likely.
XRPUSD: In a Bollinger Band super squeeze on the weekly with lower highers and highers lows suggesting upcoming parabolic move either way...a/k/a Jesus Fish Pattern. Symmetrical triangle on daily provides first target of $1.1
USDCAD: Approaching bullish 200 MA while the M MA and L MA posture for death cross. Weekly A&E bottom with $1.63 target. Massive volume over last 3 years. Currently fitting into channel. Tightest weekly BB squeeze since 2000.
WTIUSD: Pullback back and into golden cross
BTCUSD: Gap in the visible range volume profile looks like it is begging to get filled. If we close above $4,300 then a return to $5,400 - $6,000 would be my highest probability outcome. Will be strongly considering setting a stop order to add to my long above the daily Parabolic SAR. Backwardation appears to be getting slightly more exaggerated, currently 3.03%.
ETHUSD: First weekly buy signal since April 2018. Daily has potential incoming death cross which could occur right around the Constantinople Fork.
LTCUSD: Waiting for close > daily saved me. Treating inside the cloud as a no trade zone can work very well.
XRPBTC: Incoming death cross following L MA roll over could be setting up ideal entry. However ascending triangle is still in tact and want to wait to enter until we get a close above / below.
XAUUSD: A few daily candles have closed above the trend line from 2016 but when zooming out to the weekly chart it becomes clear that the TL is continuing to hold as resistance, therefore it is still in tact. Daily looks like it is ready to break down at any moment and that is why I will be waiting with stop entry. Consensio is also starting to signal short entries with P < S & M MA while those are making a bearish cross.
EURUSD: (leaning bullish) L MA and LL MA squeezing with price between on weekly and the LL MA appears to be making bullish reversal. Seeing a potential A&E bottom. Bollinger Band in tightest squeeze since 2014 and a 24% move followed that one.
USDRUB: Symmetrical triangle forming above bullish 200 MA that is approaching the price. Also had a recent GGC on the weekly.

Dash ripe for a rebound; Potential inverted head and shouldersDash is experience a nice big green daily candle today which has allowed price action to climb back above the 1 day 50ma(in orange) We can see we also seem to be completing the right shoulder of an inverted head and shoulder pattern. I'm looking for a minor retrace here that retests the 1 day 50ma multiple times and keeps finding support there... if this occurs I will know that the 50ma(aka buy/sell line) has become solidified support thats when I will likely buy back in and then make my next decision at either the neckline of the inv h&s or if I see the price action somehow dip back below the 50ma and close 3 consecutive candles underneath it or solidify resistance. Judging by how the stochrsi on the daily is bottomed out and looks like it wants to start heading back upwards I'd say probability favors solidified support at the 50ma. Just my strategy of course if you are looking for financial advice you will have to go somewhere else as this is just my opinion. Thanks for reading!

DEATH CROSS COMING TO A MARKET NEAR YOU!As you can see, from the chart that the current trajectory of the 50 and 200 day SMA's are indicating that by mid December we will have us a Death Cross in the Broadest market measure...the S & P 500.
This could however happen sooner or later than 12/12/18. This is given that the SMA's stay on their current trajectory through 12/12/18.
A larger than expected fall from here could make that Cross happen much sooner, and a rise from here would push it out until mid January or February.
Its going to happen either way.

BTC - Boring Range H4Hello guys, boring chart, we've been trading in the same range since Oct. 15.
Price is currently stuck at the 50/100 EMA, they are currently acting as resistance which is a good sign for me. The more we hit a resistance/support the weaker it get. If we indeed break that resistance I expect the 200 EMA to be the next solid resistance and the 50/100 EMA would be acting as support. MORE SIDEWAYS ACTION LOL. But at the same time, what apply to the 50/100 EMA resistance right now apply for the 200 EMA too. We tested it 5 times since Oct 15. But is 5 times in the last week enough to smash the ol' n' mighty 200 EMA, hmm...
The other important thing that I'm seeing is that we are currently consolidating/distributing below a important pivot point (6500~) which could be a good sign of a future breakout above or below.
So I will be waiting for a breakout on either direction, even thought I feel more bullish right now.
Be patient, trade wisely, don't copy me and of course keep learning !
vOid

Bitcoin Daily Update (day 230)I believe that it is possible to beat the market through a consistent and unemotional approach. This is primarily achieved through preparing instead of reacting. Click here to learn more about how I use the indicators below and Click here to get my complete trading strategy! Please be advised that I swing trade and will often hold onto a position for > 1 month. What you do with your $ is your business, what I do with my $ is my business.
I recently posted Bitcoin Bubble Comparison - 3 Day Chart . It provided new dates and prices for the bottom, however it’s still slightly too early to abandon my predictions from the previous Bitcoin Bubble Comparison ]Bitcoin Bubble Comparison: 1 day - 5 days = < $5,750 | bottom prediction: $2,860 by 10/30 | Calling for $35 ETH around the same time
Previous analysis / position: “If we breakdown $6,370 then it would confirm the bearish harami as well as the hanging man. If that were to happen I will be prepared with a small stop order set to short $6,369.” / Short USDT:USD’ from 0.968
Patterns: Descending triangle / bearish harami
Horizontal support and resistance: S: $6,410 | R: $6,454
BTCUSDSHORTS: Really started to look like they will break out of the triangle to the upside. Once volatility picks up so will volume and we should see unprecedented levels of short sellers.
Funding Rates: Longs pay shorts 0.01%
Short term trend (4 day MA): Bullish (price above MA)
Medium term trend (4 week MA | 2 & 32 day MA’s): Bearish | Bearish
Long term trend ( 32 Week | 50 & 128 day): Bearish | Bearish
Overall trend: If daily closes below $6,438 then all will be bearish
Volume: Surprised volatility didn’t continue after the volume spike on the 15th. Now we are back to painfully low levels.
FIB’s: 0.618 = $6,530 | 0.5 = $6,441 | 0.382 = $6,351
Candlestick analysis: Harami inside a harami. Can we get a 3rd matryoshka doll?
Ichimoku Cloud: 4h cloud acting as strong support at $6,424
TD’ Sequential: Weekly red 2 will fall below a red 1 at $6,086. Placing a stop order there could be a good idea
Visible Range: Gap in volume from $6,246 to $6,371 with 5 day look back
Price action: 24h: -0.1% | 2w: +/- 0 | 1m: +2.95%
Bollinger Bands: Daily MA acting as strong resistance
Trendline: Top of descending triangle ~/= $6,725
Daily Trend: Chop
Fractals: Up: $6,792 | Down: $6,057
RSI: Hanging around 50 on most TF’s. 4h is a little overbought
Stoch: Recrossing bearish on 12h, going for retest on daily after creating higher high
Summary: I am closely watching the red trendline on the USDT:USD’ 1 hour chart as well as prior historical support at 0.9642. As long as it stay below those areas then I do not feel very comfortable about holding a short on BTC’ or ETH’.
Furthermore I am strongly expecting the lower wick from October 15th’s candle to get re explored, similar to what followed October 2nd’s candle.
If it has another selloff then BTC’ and other cryptos should get another pump. If it stablizes then I will feel comfortable going back to my normal approach of 99% TA
Nevertheless, trading is about risk reward and properly managing positions. If the r:r is tilted too much in my favor then I will open a large position regardless of what is happening with Tether and I will use a market stop loss if need be.
I posted a chart earlier with a $35 target for ETH:USD and that is a prime example of something that is too favorable to pass up. In the mean time there is an incoming death cross on the 3D chart with the 50 and 200 MA’s. The first close below the 200 MA is what led to my most recent Bitcoin Bubble Comparison . Only other time this happened was in October of 2014.

XRP H&S target reached; Big Bounce Support on 1Day 50maPlease look back 4-5 ideas about the XRP H&S target I pointed out...we have found support at the nearest direct support line immediately below the drop target of the head and shoulder pattern I pointed out. We have seen a very nice bounce here at the 1 day 50ma(in orange)...still a chance that this support could fail if so the next fib line down just under this MA will likely find the ultimate bounce support if this one doesn't hold support. This one may be enough for us to continue upward however. Will need to start seeing a series of higher low/higher highs form though as of now bears have the reigns. However now that the drop target has been fulfilled on the head and shoulder breakdown the bulls may be able to steal the reigns back very soon.

TRX/USD going to test recent lows?!TRX has failled to break the 50-day Moving Average, Slow stochaci is showing bearish movement, it is too high and the red line just passed the back line, meaning price will decrease very soon. Which means that unless we find support on the 20 Day Moving Average, TRX will experience recente all time lows. Volume doesn't seem to increase as well as what happens to BTC, which means that this little Bull Run is temporary. Markets are unstable at the moment.

#ANTO - Worst weekly fall since Sept 2011A big fall this week.
Broke through weekly 50 EMA and heading towards its 200 EMA.
Will it break that and head into a downtrend?

big rejection @ 1day 50ma bck inside the 1week dscnding triangle Couldn't get above the 1 day 50 ma or the 4hr inverted head and shoulder neckline they were double reinforced resistance and we now find ourselves back inside the 1week descending triangle pattern. We are nearing the apex of this pattern so I anticipate a break out of it eventually and most likely a bullish break though we may see a bearish breakout fakeout just before. I would have exited my position just at the neckline of the inverted head an shoulder had I been near a computer when it pumped and would likely still be out right now sitting pretty but since I didn't and also wasn't aroudn for this breakdown I am still holding. I may have missed some accumulation opportunities but What I'm looking for at the moment is for this current dip to form a higher low on the 4hr as we just achieved a higher high. If we turn back around soon enough and form a higher low probability will continue to favor the upside.

XRP/USD going down?! MACD looking goodXRP showing a lot of difficulty in crossing the 20 day moving average. Macd showing bullish results, however i wouldn't advise entering a position yet, because i still think we will test 0.27$ before going up. With market, if BTC goes down, it will be enought for all the cryptos to go down!
P.s.: ignore the yellow dot line pointing up!!!


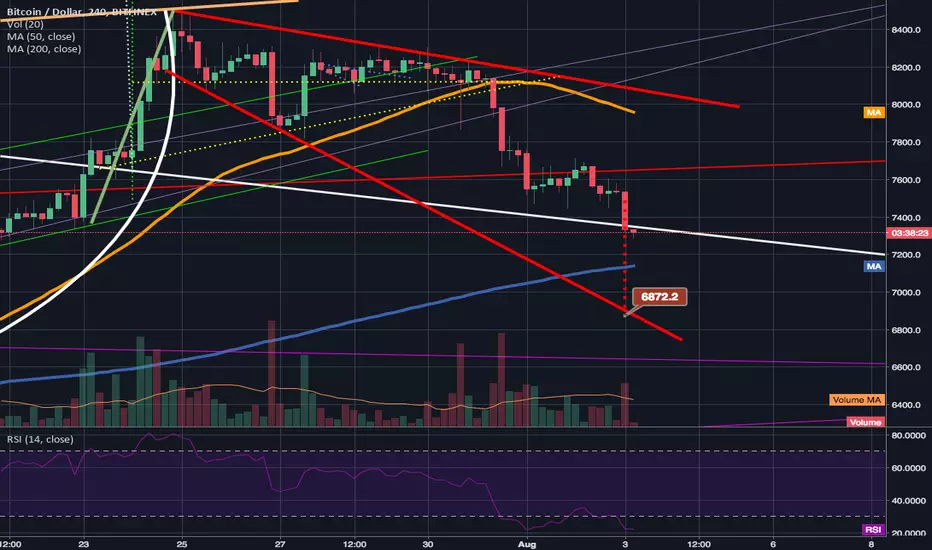
seeing a nice bounce right at the 1 day 50 maAs I anticipated, we would find support right at the 1 day 50ma...our previous bearflag consolidation had some bullish divergence on the 4hr chart and though it couldnt stop the bear breakdown it indicates that the correction may be close to over...Im thinking the 1 day chart 50 ma (in orange) could certainly be that. Currently we still haven't even touched it...turning around a quarter pip above it like the mob's herd mentality tends to do. I'm thinking we either bounce here, touchdown on the 1day 50ma then bounce back upward, sending a bear wick below the 50ma but inevitably closing above it...or maybe just one more breakdown from here. My limit buy was triggered at 6939 so I"m happy with my trade for now. But if I see the potential head and shoulders (with very little shoulders) look like it may trigger then I amout again until 6.1k -6.2 overall I think we would only see 1-2 more bear breaks downward before we turn back around but the golden cross is dependent on us not closing below the 1 day 50ma

We have broken down from a bearflag & through a big support liThe old adam and eve neckline we broke up from before was holding very strong support after the bearflag breakdown but could only hold for so long before it gave way. Are next 3 big supports are 7.3k the 4hr 200ma(shown here in blue) the 1 day 50ma and the 7k psychological. The bearflag breakdown target could send us all the way to 6.9 or even upper 6.8k. However I am hopefully that either the 200 on the 4hr chart or the 50 on the 1 day chart will provide us our much needed bounce. if we break under 7.2k however then 6.8-6.9 becomes a real possibility.
BTC weekly looks no goodAfter going to RSI middle, we change the way downward. stay away from long position, it's a new preparing of selling off.
