Long GBPUSD 110 pipsI have been waiting for this bullish move up for a few days now and it is finally here. We saw it was oversold on the 4 hour and 1 hour. We saw that it didn’t break the trendline I set in place and people took profit if they used the fib Retracment tool. This means if people aren’t selling, the bears lose that momentum they had. Now the bulls are winning. I do want to clarify I am a bit worried about this point on the move up that I have marked with a white trendline. I would say proceed with caution as we may see a pullback. However, I still believe in the trade.
50ma

Is BTC Bull Run confirm?As we can see we have a good pull back from the support level of 29k But BTC still struggling to break 32.7k range.In weekly time frame Btc trying to break 50 MA.WE can see good dump in BTC in coming days if BTC can't hold above 50 MA .

Chart Training with Jay Rhyder - MA SignalsHello and welcome to a small series I thought I would start to help people understand market charts. Enjoy and leave me a comment about what you liked or didn't like. Thank you for your support!
------------------------------------------------------------------------------------------------------------------------------------------------------------------
Take a look at this chart. It is a 1 hour Coinbase chart of Ethereum (ETH/USD).
One of the best ways to understand if the market is going to rally or go south is to pay attention to the MOVING AVERAGES, or MA lines. As you can see, the white line on this chart is the 50 day, the dark purple one is the 200 day and the pink one is the 150 day moving average, respectfully. When you see the 50 day moving up like in this chart, and the 200 day on top of the 150 day, it is a bullish signal.
The opposite is true for bearish markets. It is called a DEATH CROSS. It is when the 50 day is on the bottom of the 150 and 200 and the 200 day is on top of the 150 day moving average. When the 200 day crosses DOWN through the 150 day, it is called a DEATH CROSS and is a very, very bearish signal.
If you have any questions about this short and concise tutorial, please leave your question or comment below. I hope you learned something from this short tutorial. My name is Jay - have the best day!
:)

Nzdusd buy Here we see a classic buy set up. It has been oversold on the larger time frames. We see that it is also rallying up by breaking my maroon trendline. On top of that we are very bullish considering it created a new higher low. All of this confirms to me we are set to move up and test the resistance line above.


50 100 & 200 MAsThe 50MA 100MA 200MA are indicators i used most on a day chart to determine if the chart is a good chart to swing trade and i use the weekly to determine trades for L.E.A.P.S. with those same indicators

60 pip sell for audusd We are seeing an area of resistance right now and it failed to break. It also made a lower low recently and to confirm the move it also made a lower high. All of this indicates we are in a downtrend. We need to wait for confirmation when price breaks the 50 with momentum or when it breaks the trendline. This will be a 60 pip win if we are successful. Use proper risk management for this trade.

GBPJPY 26/06/21(Hourly Time Frame)
Head and shoulders spotted forming on the 1hr TF.
To decrease noise I removed some indicators, however they also indicated a sell occurring in the market short term;
- Ichimoku cloud indicates to sell
- BB's indicating to sell, however the bands were getting tighter together. (Market bouncing between middle and bottom bb).
The 50MA is currently pushing the market down.
T/P may be decreased, I predict it will go down to the support zone however invest at your own risk.
***The resistance zone stated isn't the highest resistance zone the market has offered, it is an average Resistance zone I have gauged within a time frame in the market.

EVFM 50 day MA and anchored VWAP bounce Loking for $3.50 for this stock recent bounce of 50 day MA and finding support on anchored VWAP should be good for this biotech stock.

Something You Still Should Pay Attention ToIt looks like the Death Cross is still on it's way and about to hit right after we rebound so the venture into the 40-46K could reveal to be a very stingy trap.

ETHUSD 2 buy signals incoming for tonight and tomorrow 20MA is very close to crossing 50MA and 100 MA.
The 20 over 50 cross will probably happen during the night (a time which whales like to make moves). That's usually a small buy signal, but given the regain of strength of BTC lately expect anything.
The 20 over 100 probably by tomorrow. This is a bigger buy signal that will probably break us out the wedge finally.
Note that these are bullish scenarios and that you should always prepare for the worst.
Hopefully I'm right :)

Can I dream a bit? ETH ATH breakout possible?If the cross happens at that moment where there is already so much momentum, there is potential for a record shattering ATH. A bit of a wild prediction since 20ma and 50ma's directions are hard to follow. But let's hope I'm right.

ETHUSD Ascending Triangle Bullish Pattern Breakout + Buy SignalHere is my analysis on the 2021-06-06 at 10:40 pm. With the bullish movement, 20ma is bound to correct higher and cross 50ma which if it happens will trigger a strong buy signal. Hopefully I'm right.

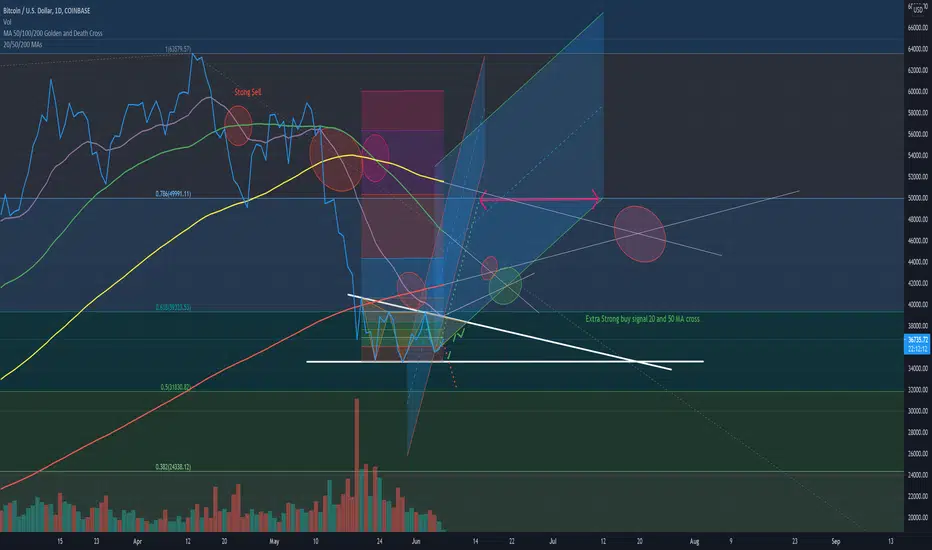
Updated TA for BTC USD Trend Bullish or Bearish ScenariosGreen dots: trend if resistance is broken at $36K
Green dashes: trend if resistance not broken at 36K AND base of triangle not passed
Red dots: Trend if resistance is not broken at 36K AND base of the triangle passed
Green circles: Buy signals
Red circles: Sell signals
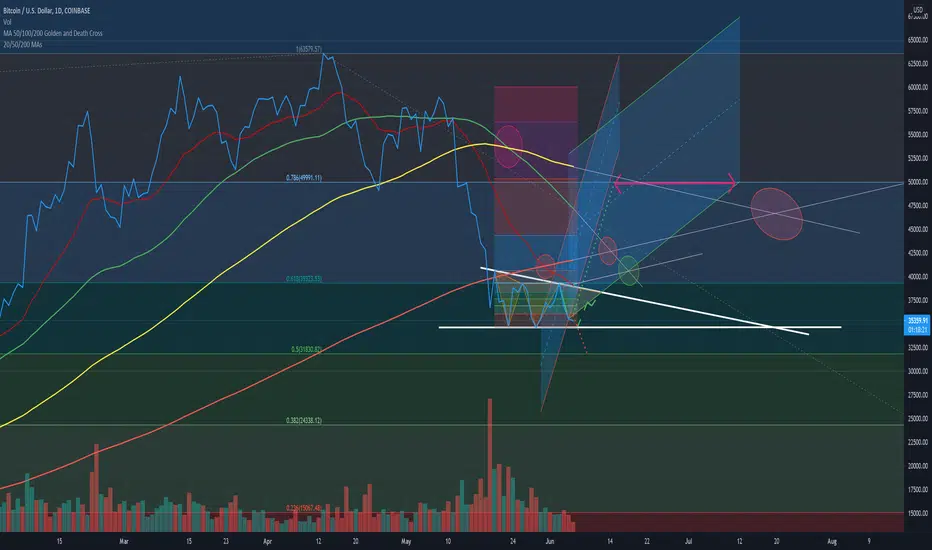
BTCUSD TA bullish and bearish scenariosGreen dots: trend if resistance is broken at $36K
Green dashes: trend if resistance not broken at 36K AND base of triangle not passed
Red dots: Trend if resistance is not broken at 36K AND base of the triangle passed
Green circles: Buy signals
Red circles: Sell signals
ALGO - Looking For Buy SetupsALGO has made a breakout in price to the upside and is establishing a new ascending support trendline.
Next, I expect a retest to confirm the new support and a rally up to +30%
A buy setup forms if volume and buying pressure picks up at the 50MA.
Let's see what happens!

EGLD up to $300EGLD has been trading in the same channel since February. Good new for us is that this is an ascending channel. Additionally we have testing the middle of the channel multiple times over the last three months and each time we have been rejected. This is not that big of a deal since a move back to the middle of the channel from our current price is a 60% increase in ELGD's price.
Other bullish signals include the MACD crossing the signal line, as well as the fact that the price has stayed over the 50 day MA for the last week. I would however like to see more volume.
A stop loss would be if EGLD closes the day under the channel
Have fun, trade at your own risk.

Bullflag 6 hour FET/BTC #FET #FetchAI $FETHere we see our FET 6 hour chart . And it's in a clear uptrend . We've stayed above 1000 sats since hitting that 700 area few weeks ago .I said at the time I thought that pullback to 700 area was the completion of our Handle from that Bullish Cup and Handle pattern,and I still think so ( target of that was 2890 which I still think will happen but first we must retake the 1550 area and break above it . ) You see that purple arrow on the chart ? That points at what appears to be a Bull Flag on the 6 hour timeframe . In between those pink lines. It's a bullish pattern that happens after an uptrend and says we should be seeing more uptrend soon .Also notice we are about to have a Golden Cross on our 50 MA (light blue line ) and our 200 MA ( drk blue line .) That light blue line going up and through the dark blue line is a Golden Cross and it is also Bullish . So to sum up we have 2 bullish patterns happening on this chart and I definitely expect upside though I can't say when , but it seems it will happen soon. I'll link my previous FET charts below but we should see a break towards the 1550 area again sometime soon .

My thoughts on NZD/USDIn my analysis of NZD/USD, this currency pair is moving Bullishly on the Daily Chart. Currently the pair is in area of resistance at price $.72442. If prices breaks above the area of retracement, I forecast price to move up to price $.74282. If price breaks below the area of retracement, I forecast price to move to price $.70684. In my analysis, I used the Fibonacci, the 50 MA and Support/Resistance. OANDA:NZDUSD

#PBR at the lower end of upward channelNYSE:PBR
#PBR is now at the lower end of the channel
Following history of the chart is now set for upside
Managed to close above 50MA
MACD approving level above 0 (bullish)
RSI is gradually increasing
Risk/reward 2.63

Dominating The Market Btc.d #Bitcoin $BTC #BitdHere we see our Bitcoin Dominance chart which today dipped into 51 area ! This is major ! Our expected Altseason won't happen with a high Bitcoin Dominance chart so it's great to see this dipping even lower right now! You can see we are under the daily Ichimoku cloud . We are under both the 50 MA and the 200 MA . And we have hit a TD Sequential 9 in red on this daily chart as well as the 3 day chart . This chart is just red ! And whilst the Dominance of Bitcoin in the market goes down - the rise of Altcoins in the market should continue up , even giving us a bit of Altseason! So this is very Bullish for our Alts . Last Bullrun of late 2017 saw Bitcoin Dominance actually fall to 36 area at end of December 2017/early January 2018 !! That's quite a bit lower even than we are now though there's no guarantee how low it goes . No one can say yet but so far it seems like our altrun will be looking good all year .

LUMEN TECHNOLOGIES - short term reversal NYSE:LUMN
LUMEN TECHNOLOGIES INC (#LUMN)
Good level of support at $ 12.80
MACD sloping up
RSI low with room for upside
A break and close above 50MA might confirm positive momentum
Risk/reward ratio 3.18
Target $14.56
Stop loss $ 12.43
