USDCAD bearish butterfly and bat, and a 0.618 retracementThere will be BOC interest rate announcement today.
Here we got a bearish butterfly and 0.618 retracement combination at around 1.3440;
I'll wait for at least a 5min reversal sign after the announcement to take the short!
If it could go above 1.35 to stop this trade out, the bigger bat will be taken place.
Let's see how it goes!
618 Fibonacci Retracement

GOLD BUY from 1279/78 - 61.8% FIB retracementEntry order set for a BUY at 1279/78 which is the 61.8% FIB retracement level.
Stop loss set below 1275 with the first target being 1325 and 1375 in extension.

NEW TRADE IDEA GBPUSD
Primary Trade Setup
In case the pair goes back up to 61% the risk of taking a purchase is very low. In case the price closes below 61%, looking for a purchase is still possible but we must be careful since we would be entering the field of the last highs and that can also mean a change of structure, so it is better to divide the trade and take partial profits and protect operations. if you have the possibility to do it.
I hope this is a flag correction.
Secondary trade Setup
If the price decides to lower enough, it is necessary to wait for a retest in the area below the last stops before looking for a sale. However a break and retest would indicate a very powerful structure break.
Note: in a past image I sent a sale in a higher area, the price did not reach the area, however if this trade is successful this is a very, very good area to find a sale, in my opinion.

USDCHF 0.618 retracement and a bullish butterfly right hereFirst of all, no intention to chase the slump as it's 2 bullish combination right now right here.
While still, it broke the structure for the week , so pretty much we got some contradiction between these views.
When it comes to contradiction among different tools, choosing to stay flat is always a good idea.
But if I have to choose one side, I'll still pay more attention to this long-waited spot to long.
The plan is to wait for hourly reversal sign as a confirmation entry, if there isn't any reversal sign and broke 0.9950, then this trade will be cancelled.
Let's see how it goes!
(There is also an exactly same set-up for CVS today in my related ideas yo)

H&S SHORTH&S w/ retest fib level 0.618 tested, Descending channel resistance tested, Ascending channel resistance tested and RSI over bought

USDJPY Looking bearish.Now i see a big potential for sell this pair.
On the last my idea i post 1 not good trade.
here its :
1. New Lower Low.
2. Retest of 61.8% fib. level
3. Playing on resistance zone
4. Anyway we need to go down.
Good luck.
p.s. use S/L )

USOIL has broken the channelUSOIL has broken the channel
and pulled back to 0.618 level
around 54 will be a good area to short
SL : 56
TP : Follow arrow

NZDUSD Forecast: Potential Head and Shoulders Formation With this pair we have recently seen a failure to create a higher high past 0.6970, followed by a daily chart tweezer top rejection of weekly resistance 0.6900. Consequently this pair has seen a massive sell-off back down into monthly support in and around 0.6700. We are now finally starting to see a slow-down of momentum for a potential correction back into the 0.6850 region at our favored fibonacci levels in alignment with a potential right shoulder. A rejection of this level could lead us swiftly back down into our neckline/monthly support. A break of this neckline for a swift sell-off into our fibonacci extension target 0.6585 which is in nice alignment with our previous higher low. Trade safely! Cheers.

cad/chf short set up long term goalon the cad/chf I have seen potential short set up which is also in line with the fib retracement of 0.618 from the highest point of the downward channel.
daily/4hr will be shown as well.

Dollar Index Buy on 0618 ??Reason to Buy
1) 9566 = key support
2) 0618 - potential reversal
3) Daily Pin bar
Long-ed

EurNzd Buy on 0618 + Daily Pin ?Reason to Buy
1) 6650 = key support
2) 6660 = 0618 retracement
3) Daily Pin Bar
Long-ed.

USDCAD shortBearish flag has hit the 0.618 fibonacci level. I expect a drop from here on day candles

3 consecutive closes under the 61.8% level - sell signalResistance at the golden ratio could be building up more sellers here.
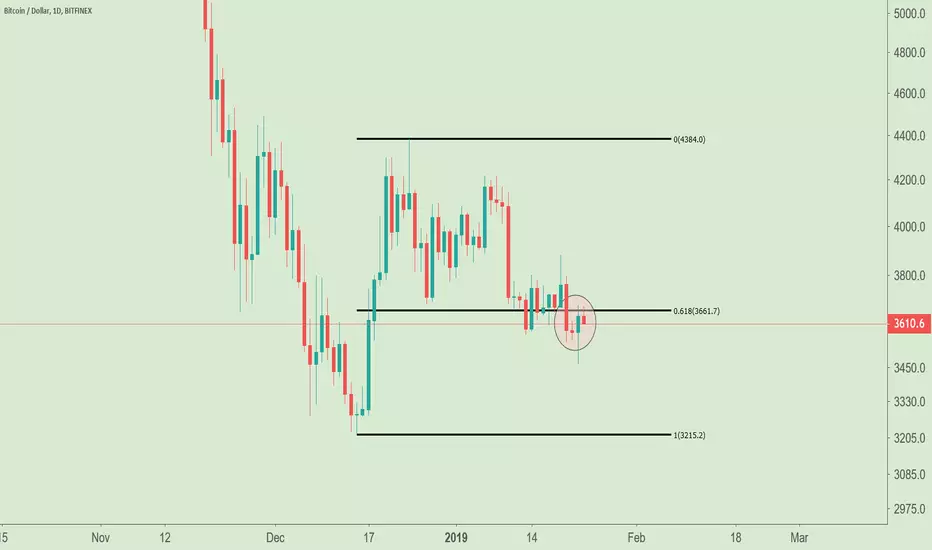
A close today under the 61.8% level would be bearish for $BTCWe are under the 61.8% level for the 3rd day, so the close today is important to filter a break.
A close underneath.. cover longs
A close above.. stay long

TDOC - 618 Fib Retracement Entry on MACD Cross-over on weekly chTeledoc medical billing is crossing over the weekly MACD after recent drop. Entry point just over $63 on 618 Fibonacci Retracement.
Software + Medical billing.
Make own decisions and let me hear your opinion on this company. Total debt <$10 of Mkt Cap, no dividend, and healthcare through any mobile device.

S&P 500 forming lower low and lower highS&P 500 forming lower low and lower high
suggest to look for opportunity to short
around 2626.90 will be a good area to short
SL :2820
TP : Follow arrow

Dollar Index Buy on trendline support + 0.618 + 1.618 ??Reason to Buy Dollar Index
1) Trendline support
2) 0.618 Fibo. retracement
3) 1.618 Fibo. Extension
Stay tuned !

SP500 Short on strong resistance + 50 - 61.8 retracement ??Reason to Short
1) 2580 - 2620 = key resistance
2) 0.50 - 0.618 retracement = potential reversal
Stay tuned !

HP Short on 0.618 pullback ??Reason to Short
1) Strong resistance
2) 0.618 = potential reversal
Stay tuned !

USOIL has broken previous highUSOIL has broken previous high
and retraced to 0.618 level
around 45.63 will be a good area to long
potential AB=CD move
SL : 44.05
TP : Follow arrow

USDCAD has broken the triangle USDCAD has broken the triangle
and pulled back to 0.618 level
around 1.363 will be a good area to short
SL : 1.3665
TP : Follow arrow

Gold Buy on 0.618 + ABCDReason to Buy
1) Support area
2) 0.618 retracement
3) AB = CD potentail reversal
stay tuned!

Litecoin downtrendLitecoin appears to have started a downtrend here, same as pretty much everything else. Looking to short the .382 fib levels, rebuy in the golden pockets. Not financial advice, I may be completely wrong!
