Consolidation Breakout on EURJPYHi guys,
today i want to share with you this simple consolidation pattern called triangle: it basically consists on one trendline and one horizontal structure level converging at the same level. Price is making lower highs and equal lows. As you can see on the chart above though, price has actually broken to the upside this trendline, also breaking the double bottom's neckline (giving us a 2618 entry technique). Plus, the black line represents an important daily structure level, and on the daily chart the RSI is in oversold condition.
All these conditions together make me think it could be a nice spot to go long here.
I'm waiting for the completion of the 2618 in order to enter long.
Stops below the lows, target1 at the retest of the highs, target2 at the top of the triangle.
If you have any questions, feel free to comment below.
Otherwise, see you in the next chart!
618 Fibonacci Retracement

Time to jump into LitecoinHi guys, price is making retracement before next big move. When it hits green zone likely will go up, this zone include O,618 retracement of the currently swing and AB=CD pattern.
Segwit probably will be launched until this time price of litecoin will rise.

audjpy we're going long!as u can see in chart we've a divergence on the rsi, also this downtrend is not very real for me, so we are opening a long position with target at the 61,8%
have a good day!

Time for a Big Reversal? (EURAUD analysis)Hi guys,
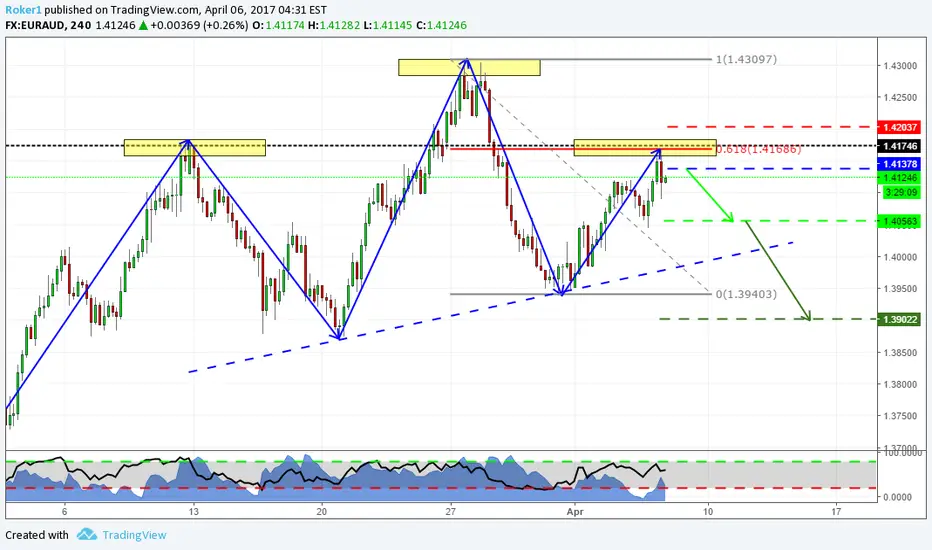
here we are on the 4H chart on EURAUD, i've been watching it for quite a bit now. As you can see price is now testing a key resistance level that also lines up with the 618 retracement of the previous leg. As soon as price came to that zone, it got immediately rejected by some selling pressure.
I'm selling at 1,413s level, with stops just 2-3 pips above 1,4200. Target1 would go around 1,4050.
If it breaks the head and shoulders neckline it could go all the way down to 1,3900 and even further.
I'll keep you updated.
If you want to share your view, or simply ask questions, feel free to comment below.
Otherwise, see you in the next chart!
Time for a Big Reversal? Hi guys,
here we are on the 4H chart on EURAUD, i've been watching it for quite a bit now. As you can see price is now testing a key resistance level that also lines up with the 618 retracement of the previous leg. As soon as price came to that zone, it got immediately rejected by some selling pressure.
I'm selling at 1,413s level, with stops just 2-3 pips above 1,4200. Target1 would go around 1,4050.
If it breaks the head and shoulders neckline it could go all the way down to 1,3900 and even further.
I'll keep you updated.
If you want to share your view, or simply ask questions, feel free to comment below.
Otherwise, see you in the next chart!

Silver retest wedge patternSilver recently broke the wedge pattern and now is going to retest it and likely price will bounce off the pattern. Also here is 0,618 strong fibo level.

USDCHF is weakening!Hi guys,
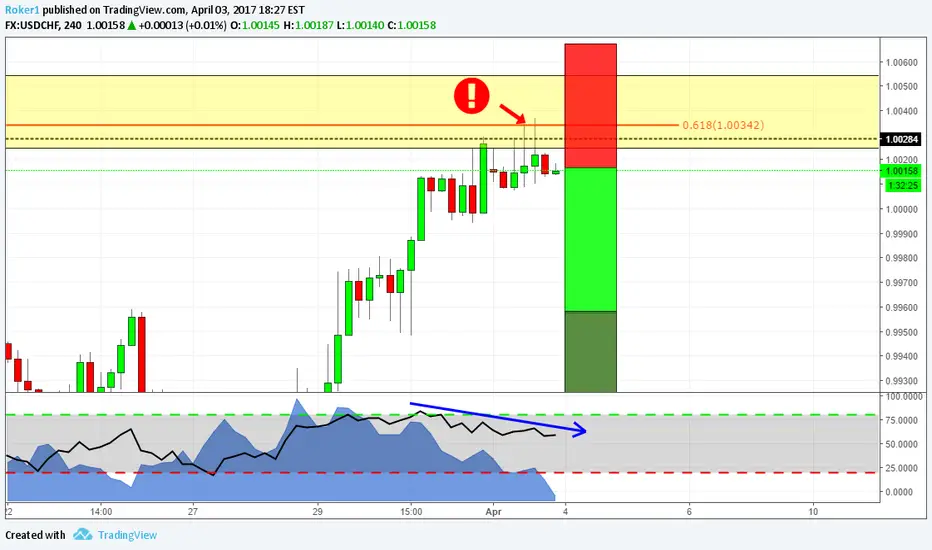
i'll briefly explain why i'm shorting this pair. The black line that you see represents a 4hr structure level; the yellow box represents the reversal zone based off of the daily chart. As the price reached this two level it started to slowing down. In addition, it gave us some signals that maybe wants to go lower: the first indecision sign is provided by the pinbar that you see highlighted with the red arrow, and it's also been followed by a red candle that closed below the previous opening. Also, the level lines up pretty well with the 618 retracement of the impulsive move down.
Rsi divergence tells us that the upward momentum is running out of fuel.
Stops above the highs, target1 at the 382 retracement of the previous move, target2 at the 618.
If you want to share your idea about this or simply ask questions, feel free to comment below.
Otherwise, see you in the next chart!

USDCHF is showing us weakness!Hi guys,
i'll briefly explain why i'm shorting this pair. The black line that you see represents a 4hr structure level; the yellow box represents the reversal zone based off of the daily chart. As the price reached this two level it started to slowing down. In addition, it gave us some signals that maybe wants to go lower: the first indecision sign is provided by the pinbar that you see highlighted with the red arrow, and it's also been followed by a red candle that closed below the previous opening. Also, the level lines up pretty well with the 618 retracement of the impulsive move down.
Rsi divergence tells us that the upward momentum is running out of fuel.
Stops above the highs, target1 at the 382 retracement of the previous move, target2 at the 618.
If you want to share your idea about this or simply ask questions, feel free to comment below.
Otherwise, see you in the next chart!

Breakout 1H-AUDCADPrice has broken a bullish channel what indicates a good oportunity to go short. Now price is overselled, we must expect some correction(pullback) . Then, we will have one support level to put one of our targets. If price brokes that level, we can expect another bearish movement.

Bunch of clues on GBPNZDHi guys,
here on GBPNZD as you can see we have a nice double bottom (with RSI divergence) right at the completion point of the Cypher pattern. Besides, this level is also a level of structure that lines up pretty well with the 618 retracement of the bigger leg.
The last bullish candle is the final sign of a possible reversal.
We'll see. Stops below the low, target1 at the retest of the highs, target2 to be determined (right now i think at the second cypher's target)
If you want to share your thoughts or ask questions, feel free to comment below.
Otherwise, see you in the next chart!

Structure Exposed!!Hi guys,
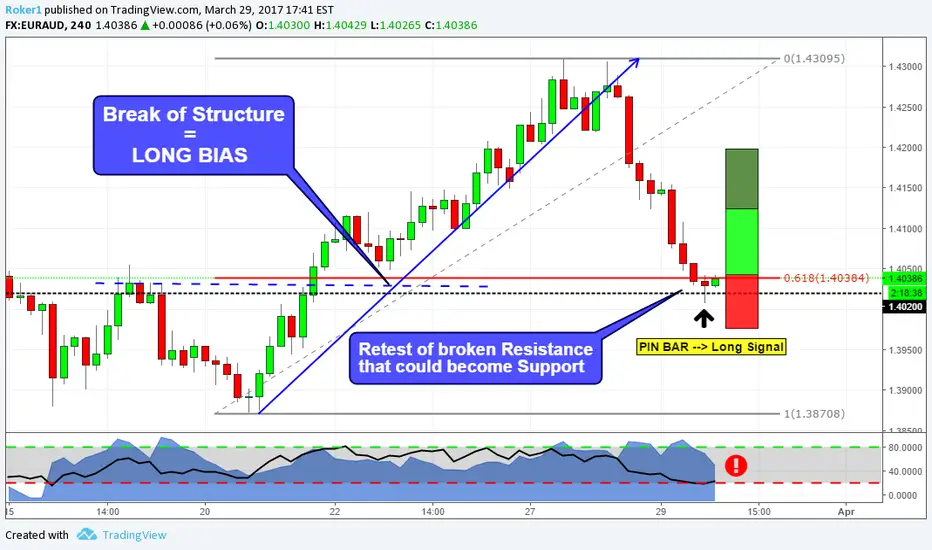
this is a simple structure trade: you can see price is coming back to retest the former resistance that once broken should turn into support. This is also lining up pretty well with a 618 retracement and a psychological number (1,40). You can see also a pin bar just formed with OVERSOLD condition.
All those clues together make this trade a nobrainer.
If the current candle will reject again that level i think i'm going to buy.
Stops obviously below the pin, target1 and 2 with 382 and 618 retracement.
Always look left. Structure leave clues!
If you want to share your thoughts or ask questions, feel free to comment below.
Otherwise, see you in the next chart!
Structure Exposed!Hi guys,
this is a simple structure trade: you can see price is coming back to retest the former resistance that once broken should turn into support. This is also lining up pretty well with a 618 retracement and a psychological number (1,40). You can see also a pin bar just formed with OVERSOLD condition.
All those clues together make this trade a nobrainer.
If the current candle will reject again that level i think i'm going to buy.
Stops obviously below the pin, target1 and 2 with 382 and 618 retracement.
Always look left. Structure leave clues!
If you want to share your thoughts or ask questions, feel free to comment below.
Otherwise, see you in the next chart!

Gold is about to fall?Hi guys,
i don't trade gold yet but i want to apply some of my structure analysis here for i think this could be interesting. As you can see price is now testing a resistance zone, that also lines up with the 618 retracement of the bigger daily leg.
On the bottom of the screen you can also see some divergence on the RSI. At the moment price is also showing some rejection in a form of an engulfing candle.
Risk to reward is very nice.
If you are conservative you can wait for additional confirmation, like a break of the trendline.
If you want to share your thoughts or ask questions, feel free to comment below.
Otherwise, see you in the next chart!


Waiting to go shortThis pair is short term long and will head down for a short.
Short from key resistance level to key support.
Looking for rejection of 61.8 fib and will exit at -27.0 fib.

NZD/SGD 4 hr timeframe longSpotted a XABCD pattern that occurred and this indicates that the market will long.
Last move before the market closed, retracement showed 0.618 which indicates the pull back to go long and the profit target used shows a desired profit area of 2.618.
Small stop loss but should look like a potential market to follow as there are long opportunities to seize in the moment.


2618 on AUDCADHi guys,
few days ago i've published a shorting opportunity on this pair. But that doesn't mean we can't change our mind. In this particular case, i've missed the short entry but that was in fact a counter trend trade.
Now price has retraced back right on the previous resistance that was broken and that could turn into support (black box). Since we have a double bottom, with Rsi divergence, broken to the upside, i think this could be a good spot to long this pair (using the 2618 strategy).
Stops below the lows, target 1 and 2 as in the chart above.
If you want to share your viewpoint or ask questions, feel free to comment below.
Otherwise, see you in the next chart!

Long opportunity on AUDCADHi guys,
few days ago i've published a shorting opportunity on this pair. But that doesn't mean we can't change our mind. In this particular case, i've missed the short entry but that was in fact a counter trend trade.
Now price has retraced back right on the previous resistance that was broken and that could turn into support (black box). Since we have a double bottom, with Rsi divergence, broken to the upside, i think this could be a good spot to long this pair (using the 2618 strategy).
Stops below the lows, target 1 and 2 as in the chart above.
If you want to share your viewpoint or ask questions, feel free to comment below.
Otherwise, see you in the next chart!

GBPUSD at a decision point! Will it hold?Hey guys,
today i want to bring your attention to GBPUSD. As you can see, looking left, there are multiple structure level that acted as supports or resistances. This level also lines up with the 618 retracement and a psychological number. So i'm going to look for a double top or a simple candlestick formation right there.
I'll keep you updated.
If you want to share your standpoint, or ask questions, feel free to comment below.
Otherwise, see you in the next chart!

GBPUSD at 0.618 Fibonacci level GBPUSD
Bearish bias
downtrend
closed below FIB
The EMA's confirm a strong uptrend. A break of my CTL will confirm shorts. If 1.24 is broken and re-tesed then i will be bullish. But time will tell.

Flag Pattern on AUDNZDHi guys,
here on AUDNZD we have no structure looking left on the higher timeframe. In cases like this i start looking for simple pattern formations, like flags, triangles and wedges in the trend direction.
On the chart above you have what could be considered a flag pattern that's been broken to the upside. Price is now retracing back and giving us a better risk to reward ratio.
Stops below the previous lows, target1 at the retest of the highs, target2 to be determined (could go very far).
If you want to share your viewpoint or ask questions, feel free to comment below.
Otherwise, see you in the next chart!
