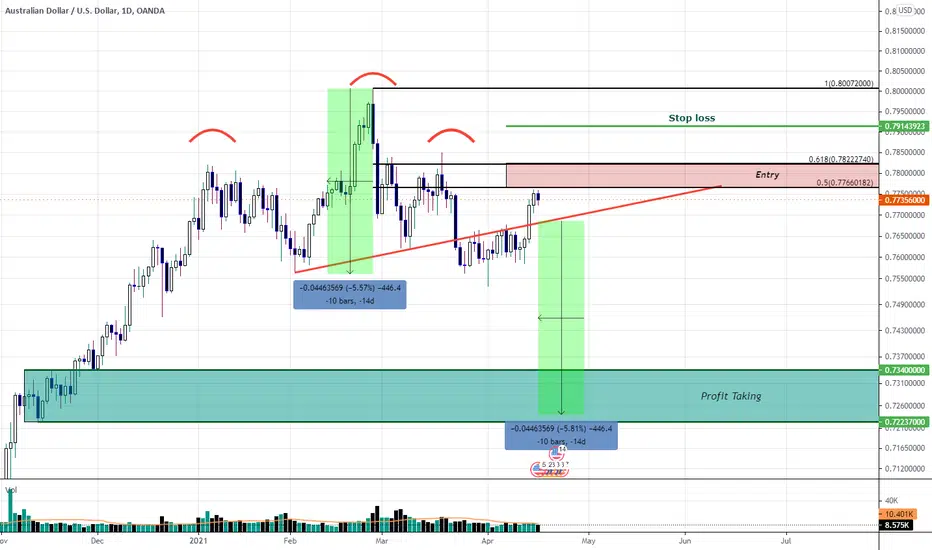
AUDUSD on a bear flag 🦐AUDUSD on the 4h chart has recently break the bear flag,
The price after the test of the 0.618 Fibonacci level is breaking below the weekly support.
According to Plancton's strategy if the market will satisfy the Academy condition we will set a nice short order.
–––––
Follow the Shrimp 🦐
Keep in mind.
🟣 Purple structure -> Monthly structure.
🔴 Red structure -> Weekly structure.
🔵 Blue structure -> Daily structure.
🟡 Yellow structure -> 4h structure.
⚫️ Black structure -> <4h structure.
Here is the Plancton0618 technical analysis , please comment below if you have any question.
The ENTRY in the market will be taken only if the condition of the Plancton0618 strategy will trigger
618 Fibonacci Retracement

Bitcoin: Weekly Forecast 8th August 2021Bitcoin has turned out just the way we have forecasted, pulling back at first and eventually forming another bullish wave.
It has even broken above key resistance level at 42000 over the weekend and will certainly invite more buyers at this point.
However, Bitcoin is about to face the real challenge, the key supply zone around the price of 50000.
Although we've seen how strong the recent rebound was, we have past record showing us the same kind of rebound after a major selloff which eventually led to another round of selloff.
While we cannot guarantee that the same could happen, Bitcoin could still be fundamentally too soon for the next major bullish trend.
We think that Bitcoin is still too expensive for another 'big players' to make 'big purchases' at the moment.
As such, we are waiting for the price to climb a little further into the supply zone at 50000 for the next major selling opportunity.

WTI: Weekly Forecast 8th August 2021WTI gained a little at first and fell through the week by more than 6 USD.
This is due to a surprise increase in the US oil inventories, showing that the delta variant might have a huge impact in curbing the demand for oil.
At the same time, the OPEC+ has also agreed to increase the oil supply to keep oil prices from going higher.
Nevertheless, as most countries are opening up and many are determined not to go back into a full-lockdown mode, economies will continue to recover and eventually led to more travelling and lead to higher oil demand.
The oil is fundamentally strong and we see every dip in the price as an opportunity to buy at a lower price again.
The oil price is also technically supported by moving averages and it seems that the price will test the 126ma in the coming week where we will be looking for a buying opportunity.
Once the price rebounds, we expect it to reach at least 71, then followed by the previous high at 76.

EURNZD a buy opportunity 🦐EURNZD on the 4hchart is moving between an ascending trendline and a minor resistance.
The price created higher highs and consolidates below the structure.
On the last impulse, the market created a nice retracement exactly at our beloved 0618 and, according to Plancton's strategy if the price will break above the resistance and will satisfy the Academy condition, we will set a nice long order.
–––––
Follow the Shrimp 🦐
Keep in mind.
🟣 Purple structure -> Monthly structure.
🔴 Red structure -> Weekly structure.
🔵 Blue structure -> Daily structure.
🟡 Yellow structure -> 4h structure.
⚫️ Black structure -> <4h structure.
Here is the Plancton0618 technical analysis , please comment below if you have any question.
The ENTRY in the market will be taken only if the condition of the Plancton0618 strategy will trigger.

Bitcoin: Weekly Forecast 1st August 2021Bitcoin made a comeback with a lot of firepower behind as it climbed for 10 consecutive days, rising from 30000 low to 42000 high.
This is certainly not just a major pullback from the recent bearish trend but potentially the new bullish trend.
However, for the price to pullback beyond 40000 is totally within expectation as the key supply zone is still a little further away at 50000.
In any case, this week will be a good time to keep buying bitcoin before it faces strong resistance around 50000.
This week, we will look for buying opportunities by first waiting for a pullback towards 40800.

UPDATE! USDCAD a turn at the 0618 🦐USDCAD after our previous analysis started a retracement move exactly at the 0.618 Fibonacci level.
The price consolidates now below a structure and according to Plancton's strategy if the market will break above we will set a nice long order.
--––
Follow the Shrimp 🦐
Keep in mind.
🟣 Purple structure -> Monthly structure.
🔴 Red structure -> Weekly structure.
🔵 Blue structure -> Daily structure.
🟡 Yellow structure -> 4h structure.
⚫️ Black structure -> <4h structure.
Here is the Plancton0618 technical analysis , please comment below if you have any question.
The ENTRY in the market will be taken only if the condition of the Plancton0618 strategy will trigger

DOW ready for a new ath 🦐DOW on the daily chart after the recent retracement at the 0.618 started a new strong bullish impulse.
The price is now trading below a resistance structure at the all-time highs.
According to Plancron's strategy if the price will break above we will set a nice long order.
–––––
Follow the Shrimp 🦐
Keep in mind.
• 🟣 Purple structure -> Monthly structure.
• 🔴 Red structure -> Weekly structure.
• 🔵 Blue structure -> Daily structure.
• 🟡 Yellow structure -> 4h structure.
• ⚫️ Black structure -> >4h structure.
Here is the Plancton0618 technical analysis , please comment below if you have any question.
The ENTRY in the market will be taken only if the condition of the Plancton0618 strategy will trigger.

USOIL for a retest of the support 🦐USOIL after our last week's amazing profit started a string retracement move.
The market tested the upper trendline of a descending channel exactly at the 0.618 Fibonacci level
According to Plancton's strategy, if the price will break below the support structure, we will set a nice short order.
--––
Follow the Shrimp 🦐
Keep in mind.
🟣 Purple structure -> Monthly structure.
🔴 Red structure -> Weekly structure.
🔵 Blue structure -> Daily structure.
🟡 Yellow structure -> 4h structure.
⚫️ Black structure -> <4h structure.
Here is the Plancton0618 technical analysis , please comment below if you have any question.
The ENTRY in the market will be taken only if the condition of the Plancton0618 strategy will trigger.

GBPUSD | Perspective for the new week | Follow-up detailsWith over 300pips in our kitty as predicted in my last publication (see link below for reference purposes); the Price is back at around $1.38ish - a level I advised that we add sell position ( see previous publication). The successful Breakdown of Key levels on the 18th of July 2021 emphasizes a risk of further decline in price for the Pound in the coming week(s).
After almost a week of selling frenzy, the Pound experienced a phase of recovery during last week trading session to test $1.37800 with a Double Top structure appearing right at our Key level hereby supporting my Bearish expectation on this pair.
Tendency: Downtrend (Bearish)
Structure: Breakdown | Supply & Demand | Trendline | Reversal pattern (Double Top)
Observation: i. $1.37550 (Demand zone) which held price "supported" for 15 days was finally broken to the downside on the 18th of July 2021 to impress the dominance of sellers in the market.
ii. The Breakdown followed by a complete retest of this Key level will strengthen my bias for a sell in the coming week.
iii. Double Top: The appearance of an extremely bearish technical reversal pattern at the Key level after the price reached a peak two consecutive times ($1.37800 & $1.37750 respectively)points at risk of further decline as a breakdown of Neckline @ $1.373000 confirms completion of a reversal set-up.
iv. It is worthy to note that the Double Top structure shares a confluence with a 61.8% retracement of AB leg and Bearish Trendline with a high probability of transitioning into a Harmonic (AB = CD) pattern with parameters explained below;
a. Impulse A-to-B is expected to be in harmony with the potential C-to-D leg.
b. The B- to-C leg is currently at 61.8% Fibonacci retracement (with a possibility of retracing into 78.6%) of the A-to-B leg.
c. The C-to-D leg is expected to fall within 127.2 - 1.414% Fib. ext . of the A-to-B move @ $1.34800 area.
v. Below $1.37550 remains our yardstick to sell the GBP in the coming week(s).
vi. Breakout/Retest of $1.37300 and $1.36900 shall be our two opportunities to add to the existing position... Trade consciously!😊
Trading plan: SELL confirmation with a minimum potential profit of 200 pips.
Risk/Reward : 1:6
Potential Duration: 3 to 7 days
NB: This speculation might be considered to make individual decisions on the lower timeframe.
Watch this space for updates as price action is been monitored.
Risk Disclaimer:
Margin trading in the foreign exchange market (including commodity trading, CFDs, stocks etc.) has a high risk and is not suitable for all investors. The content of this speculation (including all data) is organized and published by me for the sole purpose of education and assistance in making independent investment decisions. All information herein is for your reference only and I take no responsibility.
You are hereby advised to carefully consider your investment experience, financial situation, investment objective, risk tolerance level, and consult your independent financial adviser as to the suitability of your situation prior to making any investment.
I do not guarantee its accuracy and is not liable for any loss or damage which may result directly or indirectly from such content or the receipt of any instruction or notification therewith.
Past performance is not necessarily indicative of future results.

4HR Overbought at a 0.618 Retrace: My Bearish OutlookIf we bearishly reverse here and make yet another lower high we could see Bitcoin break below $28,000 and go all the way down to the daily support levels of $24,000 and $19,000

USOIL on a retracement move 🦐USOIL after the recent high has started a retracement move.
The market is now testing the 0.618 Fibonacci level over an important structure and according to Plancton's strategy if the price will break below the minor support area we will set a nice short order.
--––
Follow the Shrimp 🦐
Keep in mind.
🟣 Purple structure -> Monthly structure.
🔴 Red structure -> Weekly structure.
🔵 Blue structure -> Daily structure.
🟡 Yellow structure -> 4h structure.
⚫️ Black structure -> <4h structure.
Here is the Plancton0618 technical analysis , please comment below if you have any question.
The ENTRY in the market will be taken only if the condition of the Plancton0618 strategy will trigger.

Head and Shoulders on Daily with Entry Levels and TargetsWe have somewhat of a Head and Shoulders pattern at the 50-61.8% Fibonacci Retracement Level.
Upon Market Open I will be entering a Short Position with my stoploss above the highs
Bitcoin Reversal At $27,500For quite some time now "everyone" seems convinced of Bitcoin prices in the low to mid 20 000's. Some even anticipate lower dips than that. I certainly don't exclude that, buy given how undramatic this break below $30 000 has been thus far, there is good cause to expect a price reversal soon. Here's why.
My previous theory of an ABC move is still very much in play - one in which we'd be in the midst of completing the A-wave. As Elliott waves normally tend to nicely coincide with fibonacci levels we can clearly identify that a potential A-wave bottom would align with the 618 fib on the weekly chart.
What further adds to this theory is the aforementioned fact that Bitcoin behaves in a "civilized" manner under $30 000, counter to what most technicians had anticipated. Most traders predicted a free fall below $30 000 due to the utter lack of resistance between 20 000-30 000, with the vague exception of ~$24 000.
If Bitcoin can remain tidy and steady below $30 000 and not panic, chances are increasingly strongly in favor of an A-wave completion at the 618 fibonacci - which would also align with the support of the descending channel.
And, most importantly, when everyone expects Bitcoin to plunge, chances are it won't. THAT'S when we shall look for difficult-to-spot reversals such as this.
Our previous B-wave targets here on Trading View stand at ~$46,500.

GBPJPY on a lower high lower low 🦐 GBPJPY on the 4h chart is moving in a descending channel.
The price after the recent low at 151 level retraced exactly at the 0.618 Fibonacci level and currently is testing the weekly support.
According to Plancton's strategy if the market will break and close below we can set a nice short order.
----
Follow the Shrimp 🦐
Keep in mind.
🟣 Purple structure -> Monthly structure.
🔴 Red structure -> Weekly structure.
🔵 Blue structure -> Daily structure.
🟡 Yellow structure -> 4h structure.
⚫️ Black structure -> <4h structure.
Here is the Plancton0618 technical analysis , please comment below if you have any question.
The ENTRY in the market will be taken only if the condition of the Plancton0618 strategy will trigger.

NIO buy areaThis is NIO coming (back) into the buy area for me. I've set orders within the box.
- Price action
- TA
- I'm bullish on EV stocks :)

NZDCHF testing the 0618 🦐NZDCHF after the last bearish impulse got rejected by the trendline and started a retracement to the 0.618 Fibonacci level.
According to Plancton's strategy, If the price will provide us a sign of inversion, we will set a nice short order.
––––
Follow the Shrimp 🦐
Keep in mind.
🟣 Purple structure -> Monthly structure.
🔴 Red structure -> Weekly structure.
🔵 Blue structure -> Daily structure.
🟡 Yellow structure -> 4h structure.
⚫️ Black structure -> >4h structure.
Here is the Plancton0618 technical analysis , please comment below if you have any question.
The ENTRY in the market will be taken only if the condition of the Plancton0618 strategy will trigger.

Why it's not favour/ it's good - BTCUSDHi, btcusd is in the range
It will mention to our
Strong support is
32665....mean while it mentions
For several ideas
It will growing up with green
Pull bar and end of the week..
Last pull bar it's growth it's also green.
1, end of the day inside range
2, pin bar it's favour
3, end of the week it's good
4, price rage its growing likes moves
5, last week it's good Move
If any questions please below .
Thanks
Regards art

🌪 🌪 Dash/USDT Good time to buy and holdJUST BUY AND HOLD THIS TIME.
The Ichimoku clouds is forming a cloud similar to the previous wave, price is very close to the support line and prices are still in the 0.618 zone.
Target 264$ and 299$ and 333$
Anything that doesn't make sense, please give me a comment. Please motivate me to develop myself and help someone needed.
Don't forget click like, it's a hug for me. Thanks you!

GBPCHF a turn at the 0.618 🦐GBPCHF on the 4h chart has retraced at the 0.618 Fibonacci level near to a resistance zone.
According to Plancton's strategy if the market will satisfy the conditions we will set a nice short order.
--––
Follow the Shrimp 🦐
Keep in mind.
🟣 Purple structure -> Monthly structure.
🔴 Red structure -> Weekly structure.
🔵 Blue structure -> Daily structure.
🟡 Yellow structure -> 4h structure.
⚫️ Black structure -> <4h structure.
Here is the Plancton0618 technical analysis , please comment below if you have any question.
The ENTRY in the market will be taken only if the condition of the Plancton0618 strategy will trigger.

NZDJPY a bearish move? 🦐NZDJPY after the last bearish impulse retraced with a spike at the 0.618 Fibonacci level.
The price retest the resistance area at the 78.100 area and now is moving to the support direction.
According to Plancton's strategy if the price will break below we will set a nice short order.
–––––
Follow the Shrimp 🦐
Keep in mind.
🟣 Purple structure -> Monthly structure.
🔴 Red structure -> Weekly structure.
🔵 Blue structure -> Daily structure.
🟡 Yellow structure -> 4h structure.
⚫️ Black structure -> <4h structure.
Here is the Plancton0618 technical analysis , please comment below if you have any question.
The ENTRY in the market will be taken only if the condition of the Plancton0618 strategy will trigger.

SILVER a turn at the 0.618 🦐SILVER after the last bearish impulse retraced at the 0.618 first and then retested the 0.5.
Now the market is approaching daily support and according to Plancton's strategy if the market will break below we will set a nice short order.
–––––
Follow the Shrimp 🦐
Keep in mind.
🟣 Purple structure -> Monthly structure.
🔴 Red structure -> Weekly structure.
🔵 Blue structure -> Daily structure.
🟡 Yellow structure -> 4h structure.
⚫️ Black structure -> <4h structure.
Here is the Plancton0618 technical analysis , please comment below if you have any question.
The ENTRY in the market will be taken only if the condition of the Plancton0618 strategy will trigger.

GBPCHF a turn at the 0.618 🦐GBPCHF after the last impulse reached the resistance and got rejected.
The market retraced at the 0.618 and now is looking for a reversal.
According to Plancton's strategy if the price will break above we will set a nice long order.
--––
Follow the Shrimp 🦐
Keep in mind.
🟣 Purple structure -> Monthly structure.
🔴 Red structure -> Weekly structure.
🔵 Blue structure -> Daily structure.
🟡 Yellow structure -> 4h structure.
⚫️ Black structure -> <4h structure.
Here is the Plancton0618 technical analysis , please comment below if you have any question.
The ENTRY in the market will be taken only if the condition of the Plancton0618 strategy will trigger.

GBPNZD | Perspective for the new week | Follow-up detailsWe are yet to take advantage of the Bearish tendency since my last publication on this pair as we await price action to do a complete rejection of the Bullish trendline identified on the publication (see link below for reference purposes). Like the setup identified on our GBPAUD, we have a similar pattern here too as price action transitions into a Descending Channel
Tendency: Downtrend (Bearish)
Structure: Breakdown | Supply & Demand | Channel | Reversal pattern (retracement)
Observation: i. A successful Breakdown of NZ$1.98500 on the 23rd of June 2021 after hitting a peak @ NZ$1.99600 is enough reason to expect a Bearish momentum.
ii. The Impulsive Breakdown was followed by a rejection of the same level at exactly 61.8% retracement (NZ$1.98500 area)on the 30th of June 2021 to respect Descending channel.
iii. The momentum initiated within the channel at the inception of the retracement move (25th June 2021) in the direction of the Bullish Trend declined as price successfully broke down both the Key level & Trendline on the 2nd July 2021 to give further significance to my Bearish bias.
iv. I look forward to a possible climb to retest Key level (New Supply level indicated on the chart) in the coming week before the risk of further decline.
v. A further plunge below NZ$1.96000 (Breakdown/Retest) welcomes an addition to the existing position... Trade consciously!😊.
Trading plan: SELL confirmation with a minimum potential profit of 200 pips.
Risk/Reward : 1:4
Potential Duration: 2 to 7days
NB: This speculation might be considered to make individual decisions on the lower timeframe.
Watch this space for updates as price action is been monitored.
Risk Disclaimer:
Margin trading in the foreign exchange market (including commodity trading, CFDs, stocks etc.) has a high risk and is not suitable for all investors. The content of this speculation (including all data) is organized and published by me for the sole purpose of education and assistance in making independent investment decisions. All information herein is for your reference only and I take no responsibility.
You are hereby advised to carefully consider your investment experience, financial situation, investment objective, risk tolerance level, and consult your independent financial adviser as to the suitability of your situation prior to making any investment.
I do not guarantee its accuracy and is not liable for any loss or damage which may result directly or indirectly from such content or the receipt of any instruction or notification therewith.
Past performance is not necessarily indicative of future results.
