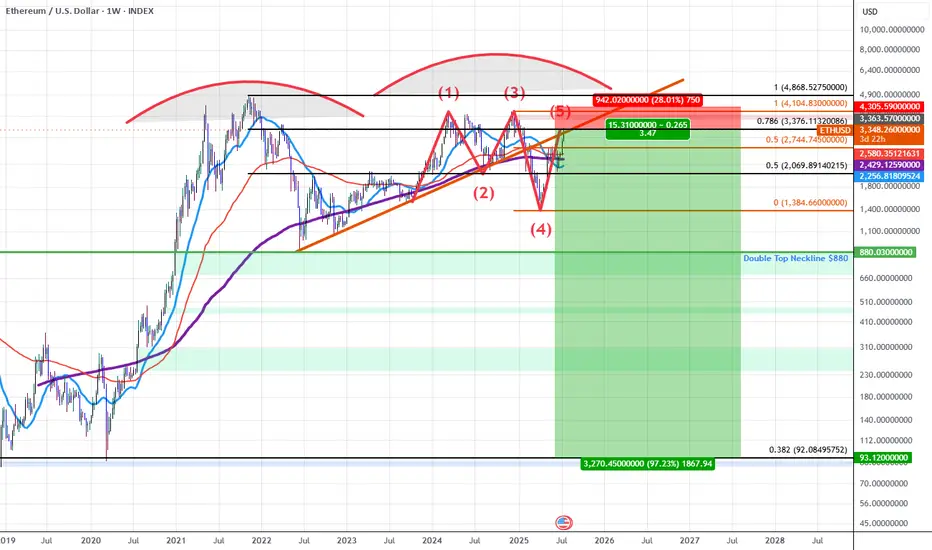
ETHUSD: Double Top into A Bearish 5-0 Breakdown (Extended)Updated Commentary: ETH has extended a bit further than projected as the Pattern Completed at the 0.618 but ETH gapped into the 0.786 instead. The gap up aligned with an upside gap fill on the CME futures as well as a gap fill on the grayscale ETH futures ETF $ETHE. The easier move from here to simply add to the ETH shorts and adjust the stop to be above the previous highs while sizing up at the 0.786 and playing off this gap higher as an anomaly. Beyond this, my view on ETH at the current 0.786 retrace remains the same as the original Idea posted as ETH rose into the initial 0.618 PCZ the details of which I will also include once again below as it still remains relevant.
ETH for the last 5 years has been developing a Double Topping pattern which has put in a series of lower highs during the most recent 2nd run up. As we've confirmed these lower highs we've broken down below trendline and are finding resistance at the trendline which happens to have confluence with the PCZ of a Bearish 5-0 wave formation near a 0.786 retrace.
As we begin to find weakness and Bearish price action begins I suspect price will make it's way towards the neckline of the double top aligning with the $880 price level if ETH breaks below that level there will be no significant support until it reaches the all-time 0.382 retrace down at around $92.10.
In short it seems ETH is in the early stages of a macro breakdown which could result in value declines greater than 80%.
I also suspect that we will see many of the assets that ran up significantly going into this week to sharply reverse those run-ups as this week comes to a close and the new week begins mainly due to the effects of OpEx, this includes: Bitcoin, MSTR, SOL, XLC, META, and BTBT. Long-dated Put accumulation on these assets at these levels is far easier to manage than naked short positions and that's how I will go about positioning here.
786 Fibonacci Retracement
ADA last chance to get in? Are you allocated into ADA? Why not? It just pumped almost 100% yesterday because of Trumos Twitter Tweet. Imagine what happens when the general public finds out this. Or will it never happen?
Was this your last chance to get in cheap?? We just touched the 78.6 fib... Are we going up?

USDCADIt shows a little uptrend triangle broke so it might give another impulse upward. Entry point can be from Fibonacci 61.8 to 78.6 area. Risk Rewards 1:5. Let’s see how it goes, Cheers!

GBPAUD Long ideaSorry for gone for little long. Looks like GBPAUD is still in uptrend. As simple and usual I used Fibonacci retracement to find a good spot to long. Risk Reward 1 to 3.5. Cheers let us see how it reacts on 61.8 to 78.6 area first 👌

AUDNZD Long IdeaAUDNZD Daily 61.8 pullback possibly ending. On a 4hr timeframe it shows a reversal pattern. So it might be a possible long trade Risk and Rewards 1:4. Let’s see how it goes ❤️

EURJPY long idea !Used Fibonacci Retracement on daily graph, saw a good support on 78.6. It broke the last lower high and created new higher high. Therefore, if it pulls back to 61.8 area on 4hr chart, I ,ight go long. Risk and Reward 1:3.5

Long Position Idea for GBP AUDUsing Fibonacci retracement. Risk Reward 1:3 ! Let's see what happens.

EURAUD sell to buy projectionPrice grabbed sell side liquidity and then broke structure on the 4h. Price broke minor sell structure, higher low, and is currently retesting, I’m trying to catch a 78% retracement to enter the sell. I believe the sell is to complete the buy retracement that broke structure to the buy side, also expecting price to sell down to the 78% as there is an OB there. As price gets to that OB, I want to see a lower tf change of character. Please let me know what you think and what you see!

BNB c-wave failure plus CMF bear divergenceBNBUSDT is heading a potential downward leg to complete iv-wave of this channel. On the 4H chart we can see a strong bearish correlation between the price action and Chaikin Money Flow bearish divergence, in which we have a c-wave failure case. The next demand zone is confluent with the Fibonacci retracement projection.

ATOMUSD: Holding Support Above 0.786 RetraceAfter crashing below it and bottoming at the 0.886, ATOM has come back above the 0.786 and is Double Bottoming while Bullishly Diverging above a local trendline. If this action holds firm then I think it can see $22-$44.

Inverse head and Shoulders and Double bottom at a 786We've got some decent MACD divergence backing us up here looking to attempt to make a higher low than the right shoulder at a Fibonacci confluence area. I think we may attempt a secondary breakout above the resistance line.

This trading strategy WILL make you TONS of MONEY!Hello, guys!
Today I share a strategy I discovered in 2017 when doing comprehensive Fibonacci research!
Everything in this world starts from 0, so we also use that rule in markets!
Hope you find this educational and stay sharp!!

LINKUSDT Exiting Ending Diagonal from the last impulsive wavePrice action, based on Elliot Waves principles, is falling from peak after complete an Ending Diagonal from the last extended impulsive wave to a potential target at local demand in hourly timeframe in a possible 78,6% retrace as shown on AB=CD pattern, below volume POC and after reject Anchored VWAP from May '22 bottom. Consolidating in a parallel channel as shown within a modified Schiff Pitchfork. Potential swing-downward in a corrective wave target to Dec '22 low re-test. Monthly Inside Bar zone.

Bounce from here?Going to keep this simple. TSLA Bounced multiple time off the .0786 and even though the more a support is tested the weaker it gets, i think going long with a stop under the wicks would be smart. NFA
Love it or hate it, hit that thumbs up and share your thoughts below!
Every day the charts provide new information. You have to adjust or get REKT.
Don't trade with what you're not willing to lose. Safe Trading, Calculate Your Risk/Reward & Collect!
This is not financial advice. This is for educational purposes only.

HSI Anticipating lower high Weekly Analysis, looking for a lower high compared to 22565 with Weekly Hidden Bearish Divergence on both RSI & MACD
Using retraces for entries, tight stop at the .786 in case of possible reversal and full position at the .886
If you agree or disagree with the setup, please let me know and explain ! We're all here to learn and grow off each other!

USOIL TRADE IDEA 1 BEAUTIFUL BOUNCE OFF THE 0.786USOIL had a lovely bounce based on the news off the 0.786 Fib Retracement on the Weekly timeframe and Range Low.
Daily timeframe was printing a oversold signal.
Currently holding the 0.618, if this holds could be good for continuation.

LINKUSDT Gartley AB=CDGartley's AB=CD Harmonic pattern applied on prior swing A-B-C w/ 78% retrace which predicts a potential 127% retrace downward.
Hidden bearish divergences on Chaikin Money Flow and Fisher Transform oscillators.
Price action: T Bar reversal @ peak.
88.6% and 14.6% Fibonacci Retracement PRZ levels.

MIR/USDT touching the 0.786 fibNot saying that it is necessarily going to bottom here, but this pump was caused by LUNA pumping, and if you believe that LUNA, ANC and MIR still have another pump left in them, then this would be a great time to start buying/longing MIR. Be careful though because if this was just a standard pump & dump then it's going to get rekt, make sure to use a wise stoploss. Potential targets as high as $1.37.

ETH - MULTIPLE PATTERNS @ THE 78%Once again we have a corrective rally.
We have just completed multiple patterns in COINBASE:ETHUSD this morning @ the 78% level setting up the next move below 1400.
The good thing about patterns completing @ the 78% is that you dont have to risk much because if we get above 1720 then the pattern are wrong and we look for something else.
I hope this helps. Enjoy the Day!! 👍👍

Soluna: Bullish ABCD PCZ Reached at a .786 RetraceWe have hit an overall .786 from the Macro Low to High and have Completed a Bullish ABCD on the way down to the .786 and now we are looking for this to come back up to the level of C so long as it survives today's earnings.

#USDCHF short, #forex4h time-frame:
price retraced to 0.786 of the previous fall.
1h time-frame:
during this correction movement, a channel formed.
A head and shoulder pattern shaped at top of the channel.
Breaking down the channel and the pattern in 1h time-frame convince me to start down-trend in 4h time frame.

Disregard The Noise. XRP Will Eventually Pump. Bulls Load Up.First things first, I'm not the biggest fan of this centralised thing called XRP.
I don't like the propagandists on YouTube spreading rubbish like "XRP TO 10K, 25K ,50K, 100K" ", The Great Reset " etc..
But feelings don't matter here, and as my mentor repeatedly says - "Emotions man, A Money Killer"
Since it hit 10 cents during the March 20 sell-off, price then rallied 1800% to $1.96, the "Great Sell" then printed and price has since corrected 85% to 29 cents.
XRP never rallied again like the rest of the market, nor did it go on to make a new high like the rest of the top 10 coins, mainly due to the whole SEC saga, which I'm sure everyone is aware of by now.
Price currently hovers in the Fibonacci Golden Pocket, big Volume Profile can be found between there and the 0.786 fib level (19 cents)
A conditional "Incredible Buy" prints along with 5 bullish oscillators. Stochastic Oversold.
Long term Bulls should now be dollar cost averaging into their positions.
Buys from 17 - 19 cents would be excellent.
Can price drop further? Absolutely, I don't try timing tops or bottoms. Market sentiment is extremely bearish.
The financial system is unfathomably complex, and no one, the Fed included, can prepare for every possible scenario as it embarks on its most ambitious Quantitative Tightening program to date.
How will this affect cryptocurrency? Only time well tell!
XRP has a strong supporter base and I believe over time, Ripple will continue to nab customers from the 10,000 financial institutions that Swift has on the payroll.
Good Luck!
Speculative Setup, DYOR. Allow 3-18 Months For all Crypto Ideas.
Credit to @without_worries for allowing use of indicators.

ETHUSD - 1k is on the way!!COINBASE:ETHUSD has seen more selling pressure and hasnt has a bounce yet.
We are approaching the LOG ABCD target around 1500. This could provide some buying to get the bounce but ultimatly will give way to more selling.
Looking at the AI for the year we can expect a low somewhere around SEPT/OCT.
This is where it can be down around the 1k level and another major 78% retracement.
I will post the log chart after.
Interesting couple of months ahead.
I hope this helps. Enjoy the trade.
