USDJPY | Perspective for the new week | Follow-upWe experienced a 125pips move since my publication on this pair last week (see link below for reference purposes) and it appears that the correction of the Impulse leg is done as I anticipate another rally in the coming week.
Even has the Greenback fell during the trading session on Friday, but the structure evolving at the Demand zone reveals signs of life again hereby making it difficult for me to short this market!
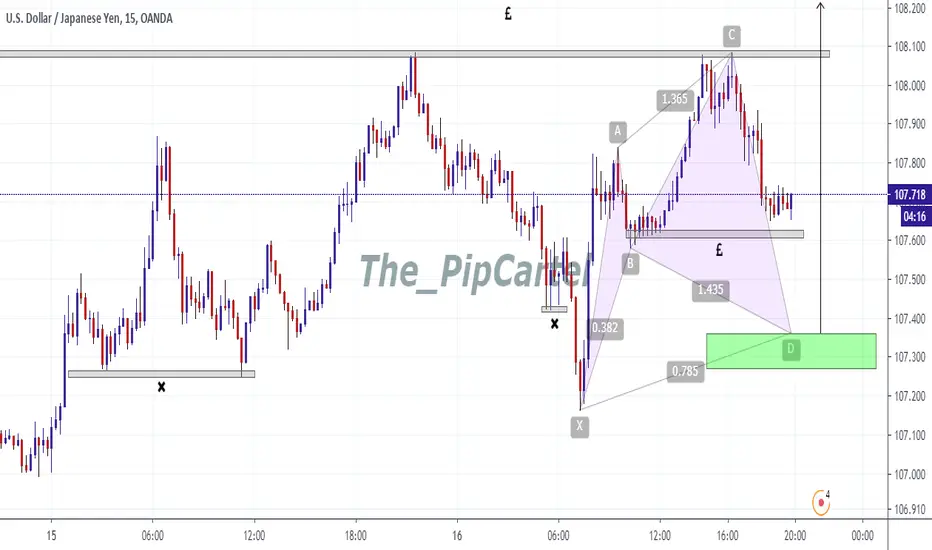
Tendency: Uptrend (Bullish)
Structure: Breakout | Supply & Demand | Trendline | Harmonic pattern (AB = CD)
Observation: i. In the last 9 days, the Bullish Trendline structure reveals the prevailing direction of price action.
ii. Trendlines applied to the highs and the lows of price action insinuate a well deserved Ascending channel which gives a positive bias for a bullish momentum in the coming week.
iii. The significant Breakout of Key level @ Y110.130 on the 16th of June 2021 expresses the strength and capacity of the Buyers at this juncture in the market as the level (Y110.130) which resisted price prior to the Breakout appears to become a new level of Demand @ 78.6% retracement.
iv. With this set-up, I am looking forward to an ABCD pattern transition with parameters explained below;
a. Impulse A-to-B is expected to be in harmony with the potential C-to-D leg.
b. The B- to-C leg is at 78.6% Fibonacci retracement of the A-to-B leg.
c. The C-to-D leg is expected to fall within 127.2 - 1.414% Fib. ext . of the A-to-B @ 111.200 area.
v. With the new Demand zone coinciding with the possibility of a Trend line continuation, It is advisable to stick to buying opportunity above Key level @ Y110.130... Trade consciously! :)
Trading plan: BUY confirmation with a minimum potential profit of 100 pips.
Risk/Reward : 1:5
Potential Duration: 2 to 5days
NB: This speculation might be considered to make individual decisions on the lower timeframe.
Watch this space for updates as price action is been monitored.
Risk Disclaimer:
Margin trading in the foreign exchange market (including commodity trading, CFDs, stocks etc.) has a high risk and is not suitable for all investors. The content of this speculation (including all data) is organized and published by me for the sole purpose of education and assistance in making independent investment decisions. All information herein is for your reference only and I take no responsibility.
You are hereby advised to carefully consider your investment experience, financial situation, investment objective, risk tolerance level, and consult your independent financial adviser as to the suitability of your situation prior to making any investment.
I do not guarantee its accuracy and is not liable for any loss or damage which may result directly or indirectly from such content or the receipt of any instruction or notification therewith.
Past performance is not necessarily indicative of future results.
786 Fibonacci Retracement


EURAUD | Perspective for the new week | Follow-upThe gains accumulated by the Euro remains limited as structure suggest that investors are hesitant to buy the Euro amidst concerns that the Eurozone is in for more coronavirus restrictions in the nearest future.
We had no execution on our last publications as price went the opposite direction with a significant Breakout of the Channel @ AU$1.54500 area ( see link below for reference purposes). Despite the fact that I am yet to disregard my previous speculation, there is a possibility that price might continue to the upside as we experience what looked like a retest/rejection of the Channel @ AU$1.54000 area after the Breakout last week.
Tendency: Uptrend ( Bullish )
Structure: Breakout | Supply & Demand | Harmonic pattern (AB = CD) | Channel
Observation: i. By connecting the lower highs and lower lows of price action with parallel trendlines, it is obvious that price has been on a downward trend caught within a Descending Channel since early November 2020 until a final Breakout happened during last week trading session.
ii. Demand zone (AU$1.52500/1.53500) has held price "Supported" in the last 39 days with clues detailing the weakness of Sellers at this area as buying pressure increases and price finds it difficult to continue respecting the Channel.
iii. The Impulse leg (AB) that began with a Hammer candle leading into the Breakout of the Channel @ AU$1.54500 followed immediately by a rejection/retest of the Channel @ AU$1.53500 (point C) signals a rally continuation that might transpose into an AB = CD pattern with parameters explained below;
a. Leg A-to-B is expected to be in harmony with the potential C-to-D leg.
b. The B- to-C leg pegged a 78.6% Fibonacci retracement of the A-to-B leg @ AU$1.53500.
c. The C-to-D leg is expected to fall within 127.2 - 1.414% Fib. ext. of the A-to-B move @ around AU$1.58500 area.
iii. My yardstick to join the rally shall be above Key levels with Breakout/Retest expectations of my Key level and Bearish Trendline remains @ AU$1.54600 & AU$1.55500 respectively.
iv. This been said, Should price dip into AU$1.53600 in the coming week the possibility of price respecting the Channel becomes feasible hence reverting to my previous publication becomes necessary (see link below)... trade consciously :)!
Trading plan: BUY confirmation with a minimum potential profit of 300 pips.
Risk/Reward : 1:3.5
Potential Duration: 3 to 7 days
NB: This speculation might be considered to make individual decisions on the lower timeframe.
Watch this space for updates as price action is been monitored.
Risk Disclaimer:
Margin trading in the foreign exchange market (including foreign exchange trading, CFDs, etc.) has a high risk and is not suitable for all investors. The content of this speculation (including all data) is organized and published by me for the sole purpose of education and assistance in making independent investment decisions. All information herein is for your reference only and I take no responsibility.
You are hereby advised to carefully consider your investment experience, financial situation, investment objective, risk tolerance level, and consult your independent financial adviser as to the suitability of your situation prior to making any investment.
I do not guarantee its accuracy and is not liable for any loss or damage which may result directly or indirectly from such content or the receipt of any instruction or notification therewith.
Past performance is not necessarily indicative of future results.

Bullish Garley PCZ At Support Above The 200 Week Moving AverageTLT has hit a significant support visible on both the weekly and the monthly at a 78.6% Fibonacci Retrace from the previous low to high. I will expect to see TLT attempt a Bullish Reversal from the horizontal support zone i have highlighted in green. If we get any significant movement below the 200 week moving average then i would exit the trade. As for profit taking levels, i would take some profit once we near the last high and hold the rest as i believe we could go much higher.

$LI - 78.6 retracementAfter completing 78.6% retracement, I've decided to go long.
78.6 and 88.6 are my two favorite retracement levels.
Risk: 9.9%
Reward: 98%

Gold: 78.6% retracement in 1/3 timeDecided to share my bullish bias with this chart on gold.
Bullish bias:
78.6% retracement in 1/3 time
Bullish hidden divergences in volume (and momentum, however volume is plotted on chart)
Initial target is the total distance from A-B projected from C, coming in at aprox. 1998$ for gold, which in turn completes the bearish AB=CD. Other potential targets plotted as .382 and .618 on the chart!
Good luck to everyone buying gold!


Weekly Hidden Bullish Divergence at a 78.6 Retrace.Last week we closed bullishly after bouncing off the 200 week SMA and staying above the 786 retrace, we are showing Hidden Bullish Divergence I think this looks to have potential to be a Bullish Gartley i will put my stop somewhere below the 200 week SMA and as for profit taking targets we're going all the way!

Big Short for TwitterTwitter on the daily has been looking questionable recently with 2 daily spinning tops in a row while quietly going down.
You're also showing an argument for Bearish Divergence on the weekly MACD and RSI with very weak looking price action:
I expect a 78.6% retrace out of this.

weekly fibs say....Bitcoin is out of steam
weekly fibs show we are at a perfect level to turn around.
All time high to 3k swing low fib we just hit the .786
3k swing low to 14k swing high is almost at the 1.272 ($16,741)

Banknifty - AB=CDBanknifty might take support at 22000 as there are trendline support and demand zone too. If it reverse from "C" then 24400 target (SURESHOT) would be in cards , as there is supply zone it might take some time to breakout after some retracement and reach final target of 26000 ...

Agi about to pop!! All on daily. Big Pattern .786 retrace @254
rsi looks ready to leave bearish zone. no longer any selling pressure
potential triple bullish on mac d


EURAUD BIASHere on this pair, we can see an obvious break of structure and shift in momentum. Price created a mini liquidity pool and an obvious sweep of it, the Higher High created gives an indication for trend continuation. At the cartel candle is where ill be looking to take a long position.
If you find this helpful, kindly drop a comment below. NOTE: This isnt a trade signal but for educational purpose.

NIfty - Triangle BreakoutIn daily timeframe nifty has ascending triangle breakout but major concern is 0.786% fib ratio at 11390, which will act as resistance. If nifty able to sustain above 11390 and close above on daily chart then 11900 can be seen in coming days. Also daily trendline is supporting it very well. ISSUE IS RSI NEGATIVE DIVERGENCCE AND NIFTY PE ABOVE 32...
Be Ready for roller coaster ride in coming days. I am expecting a huge fall between 11600-11900...

Grayscale Ethereum ETHE - whale watch sell offGrayscale ETHE touches down on 78% Fibonnacci retracement perferctly to end the week, good 2 day watch. Await break up from here. Whale money moved to other waters...BTC, LINK, etc.

USDCAD | WEEKLY FORECASTAs the Greenback appears to be losing steam across major pairs; A Breakdown of our Key level (1.35500) last week is a significant Bearish signal for us.
Tendency: Downtrend ( Bearish )
Structure: Break-down | Support & Resistance
Observation: i. . 786 retracement of the most recent Bearish Impulse leg culminates at 1.37000 followed by a Bearish momentum.
ii. The Bearish momentum which started last week finally breaks our key level @ 1.35500 which also coincides with a Breakdown of our Bullish Trend .
iii . Expecting a further rally to the downside in the following week(s) with a 1.414 extension target.
Trading plan: SELL confirmation with a minimum potential profit of 350 pips.
Risk/Reward: 1:3
Potential Duration: 4 to 8 days
NB: This speculation can be considered to make decisions on lower timeframes.
Watch this space for updates as price action is been monitored.
Nirvana! Forex
Risk Disclaimer:
Margin trading in the foreign exchange market (including foreign exchange trading, CFDs, etc.) has a high risk and is not suitable for all investors. The content of this speculation (including all data) is organized and published byme for the sole purpose of education and assistance in making independent investment decisions. All information herein is for your reference only and NFTI takes no responsibility.
You are hereby advised to carefully consider your investment experience, financial situation, investment objective, risk tolerance level and consult your independent financial adviser as to the suitability of your situation prior to making any investment.
NFT&I does not guarantee its accuracy and is not liable for any loss or damage which may result directly or indirectly from such content or the receipt of any instruction or notification therewith.
Past performance is not necessarily indicative of future results.

AUD/USD POTENTIAL (LONG)AUD/USD (LONG)
ANALYSIS:
- Consolidation = pending move
- Resistance at key trend level
- Rejection At Fib Level 78.80
- Previous Bullish momentum

USD/CAD Possible Downtrend about to begin
Waiting for confimation confluence
with .786 200EMA and candlestick entry

EURNZD - Looking for long entry on towards the 78.6% Retracement EURNZD is Bullish - We look to Buy at 1.7770
▪️ Continued downward momentum from 1.8179 resulted in the pair posting net daily losses yesterday.
▪️ We have a 78.6% Fibonacci pullback level of 1.7782 from 1.7661 to 1.8227.
▪️ Negative overnight flows lead to an expectation of a weaker open this morning.
▪️ As this corrective sequence continues we look to set longs on a dip at better risk/reward levels.
▪️ Expect trading to remain mixed and volatile.
Stop: 1.7685
Target1: 1.8065
Target2: 1.8150

USDJPY Trade MarkupUSDJPY has been bullish on this timeframe, expecting more bullishness as price to create a higher low at the competion of the cypher patter in alignment with institutional candle mitigation.
Expecting bullishness to clear liquidity at equal highs.