AAL


AALThis is American Airlines, not my favorite sector but a good breakout, the only issue so far is volume is not huge. Potential run higher and looking at the options the Jan 45c are 3.65 with a break even of 48.65 by Jan 16.

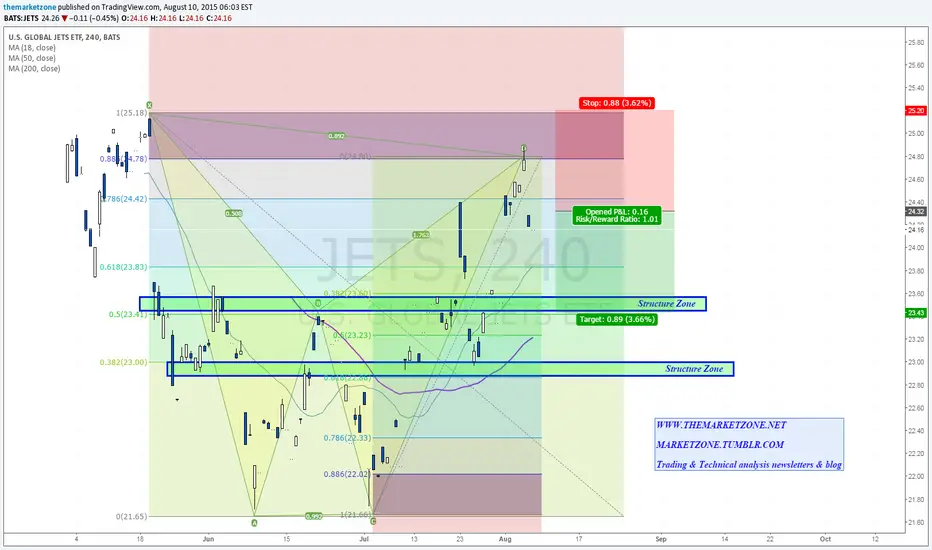
Is it going to run out of Fuel? Bearish Bat completionWith the drop in oil prices, $JETS, the new ETF that holds airline companies like Delta ($DAL), American Airlines ($AAL) and southwest airlines company ($LUV) had a very nice rally during the month of July.
The $ETF rallied all the way up to the 88.6 Fib level to complete a bearish Bat pattern and declined from there.
The pattern's targets are 23.5$ and 23$ which also come with daily support zones.
The current price level offer about 1:1 R/R ration for the short position with stop loss above X and 23.5$ as initial target zone.
This might work with the bullish scenario I posted earlier for oil

AAL Day Trade Retest Gap (Brad Reed Mar16,2015)AAL expected to open at 49.88 for a Retest Gap. To learn to trade this strategy for free, go to www.RealLifeTrading.com

AAL - A Chart Requested With MannersI will start by saying that I believe manners are important. It is a shame that so many people have forgotten they exist.
I want to thank the requester of this chart, a complete stranger, for using his manners :)
Let's move on the the request for a chart of AAL.
Back in late 2013, AAL (the stock) was just getting started. The stock created a double bottom in the first month. After that it was off to the races. All the green circles on this first uptrend line are places you could have began a position or added to your position. Notice the two red circles at the top of the uptrend line? Those are there because I would say that is where the downtrend begins.
The first red circle is the first time AAL "closed below" this "adjusted" uptrend line. It only took AAL two days to get back above the uptrend line. This action kind of negates the fact that it closed below. But those of us who watch stocks know this may have been a precursor for things to come. The second red circle is when the downtrend actually begins.
AAL stayed in this downtrend for about three months. There were several places you could have gone short if you short stocks.
In October of 2014, AAL gapped up over the downtrend line. From there it ran all the way to the old highs of about $44.50. It danced along the resistance line for several trading days before gapping up again. This time the gap up led to a choppy mess. But there is no way you could have seen that coming.
After the second gap up, if I was making good money in AAL, I would have adjusted the uptrend line to where you see it on the chart. The original trend line would have been steeper. It would have touched the bottom of the candles just before the gap up over the resistance line at $44.50 ish. This adjusting of trend lines isn't for everyone. I will do it if I think a stock may continue higher AND I am already making a fair percent return on my original investment.
At the top of the uptrend line you will notice a red circle. This is the first time there is a close below this uptrend line. Even though AAL wound up going higher from there after a pullback, I probably would not have been involved. I am pretty consistent about getting out of the way when one of my trend lines is breached.
At the all time high (January 2015) you will notice another red circle. This is really where the downtrend begins. I only know this because time has passed and there are more candles to evaluate. In February you will notice another red circle. AAL tried to rally back to the all time highs and failed. This failure allows me to draw the downtrend line. I extended it to the extreme right side of the chart because I would say price is following this downtrend line for now. I like to say the downtrend line is in control at this point.
Notice the word "wedge" on the chart? AAL will break out of that wedge at some point. Either above the downtrend line or below the support line at $46 ish. When the price breaks the wedge & closes outside the wedge, you can follow it if you choose. The chances are good that the stock price will continue in that direction.
I hope this chart helps. Thanks again for requesting it.
I Want To Draw A Chart For You!
Put your requests for a chart in the comment section of this idea. I will post them as I have time.

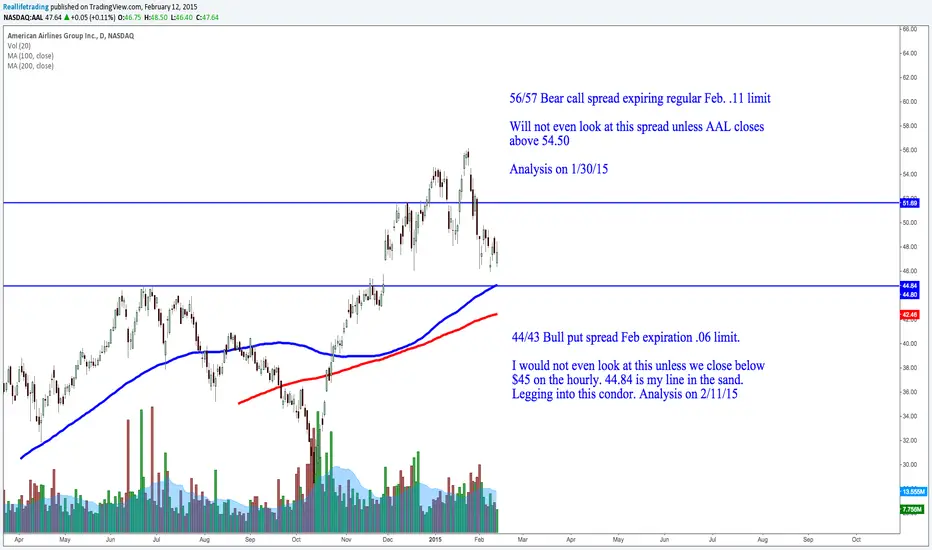
AAL Bear call spreadDue to divergence, a small pop in oil, a gap, the prem, the time frame, the location (all time high) and small weakness in other airlines.

AAL Day Trade Swing Trade (Brad Reed Jan12,2015)AAL expected to open at 50.65 for a Retest Gap. Could be a bearish break away gap for a swing trade. To learn to trade this strategy for free, go to www.RealLifeTrading.com

FLY THE FRIENDLY SKIES?The price of oil has been sliding in the second half of 2014, but airlines have not lowered their prices. Or brought back free meals. Or allowed domestic customers to check in luggage free of charge. So how can one turn flying friendly? Perhaps by purchasing U.S. airline stocks.
The cost of oil has plunged nearly 48% since the end of June and the market remains stuck in one direction. OPEC nations might make less profit and Russia, Iran and Iraq might be faced with significant economic and social issues. However, individual customers should be in the winning column.
Customers have not fully benefited from oil’s collapse. While gas is cheaper at the pump, food, clothes and airline tickets haven’t declined appreciably. Since these companies will not pass on even some of their profits to customers, then customers will need to extract benefits on their own.
U.S. airline stocks such as American Airlines (AAL) and Delta (DAL) have been surging since October 10, as they became easy choices for investors and short-term speculators. These stocks have been moving in the opposite direction than oil (CL1!) and they will remain in demand for as long as oil will be cratering.
The four-week correlation between oil and American Airlines is near perfect high negative levels. It rarely drops below -.8, and then the correlation doesn’t last more than a few weeks. Things have changed — the high negative correlation has been in place for 1 ½ months.
Only a bounce of the four-week correlation above -.8 would suggest profit taking on American Airlines and Delta.

American Airlines Group - Head & Shoulders BounceAAL is looking like it is on track to drop to between $28 and $25 per share middle to end of October (before the earnings report). As the head and shoulders pattern has been completed (passing an averaged neck line : $36-34) and then continued downward, I believe it is a strong position to assume the bottom will be reached soon.
Even if the price falls below $25 (lowest target buy) for the rest of the year I do not foresee a loss in the long 'buy and hold' till end of next summer (2015). Given the strength of the US dollar and overproduction of oil putting downward pressure on fuel price, I would expect the price of AAL to whiplash back up after health scares have passed.
Also, keep in mind the merger of American Air and US Air is in its early stages, a handful of kinks had needed to be worked out before corporate efficiency improved a great deal. It has been mentioned that the merger of all corporate financials, customer information, flight databases, etc, would not be close to complete until 2015.
My hope is that the price will double again (as seen in 2014 peak) and perhaps push even higher.

Bullish On Airlines? Kiplingers had an article on airline stocks that opened with "There's an old wall street joke about how to end up with $1 million worth of airline stocks...Start with $10 million."
"In 2000, nine airlines controlled about 80% of the U.S. markets. Today, just four companies control about the same percentages."
Looking at the major players American Airlines presented the best opportunity for a cheap buy on the pullback. Looking at the technicals, what we have here is a potential Gartley and Bat pattern completion which also lines up with a 61.8 Fibonacci retracement from this stocks all time lows.
Long-term I'm still cautious about ever being too bullish on airline stocks because of the numerous factors that can affect them but as a trader, if you're looking to get long this looks to be a prime area.
Akil
