AAL ( American Airlines Group Inc. ) BUY TF H4 TP = 14.34On the H4 chart the trend started on Aug. 13. (linear regression channel).
There is a high probability of profit taking. Possible take profit level is 14.34
This level, which I have outlined above, is certainly not a “finish” level. But it is the level that has the “highest percentage of hits on target.”
Using a trailing stop is also a good idea!
Please leave your feedback, your opinion. I am very interested in it. Thank you!
Good luck!
Regards, WeBelievelnTrading
Aallong

Ready to collect for long termFollowing weekly. American Airlines break the trendline and got getting confirmation. A nice one to collect for long term.

American Airlines to find support at previuos resistance?American Airlines - 30d expiry - We look to Buy at 15.11 (stop at 14.51)
Broken out of the Head and Shoulders formation to the upside.
Previous resistance at 15 now becomes support.
A higher correction is expected.
We look to buy dips.
Daily signals are bullish.
Our profit targets will be 16.61 and 16.91
Resistance: 16.40 / 16.72 / 17.00
Support: 16.00 / 15.70 / 15.00
Please be advised that the information presented on TradingView is provided to Vantage (‘Vantage Global Limited’, ‘we’) by a third-party provider (‘Signal Centre’). Please be reminded that you are solely responsible for the trading decisions on your account. There is a very high degree of risk involved in trading. Any information and/or content is intended entirely for research, educational and informational purposes only and does not constitute investment or consultation advice or investment strategy. The information is not tailored to the investment needs of any specific person and therefore does not involve a consideration of any of the investment objectives, financial situation or needs of any viewer that may receive it. Kindly also note that past performance is not a reliable indicator of future results. Actual results may differ materially from those anticipated in forward-looking or past performance statements. We assume no liability as to the accuracy or completeness of any of the information and/or content provided herein and the Company cannot be held responsible for any omission, mistake nor for any loss or damage including without limitation to any loss of profit which may arise from reliance on any information supplied by Signal Centre.

AAL $AAL High-Risk Initial Long AAL $AAL High-Risk Initial Long. SL and TP on chart. 10-20x leverage. Move SL on TP. Trail after TP2 1.5 ATR offset and 0.5 ATR step.

AAL Double Bottom RepeatingAAL has seen its first double bottom pump through a bear phase of this indicator
Now it will see its second double bottom pump through similarly the bear phase of the indicator (in green)

AAL looks Close to breakoutAmerican air line looks close to breakout and if AAL successfully break next target is 24$ and after than eyes will be towards 30$.
But if it fails to break out then may visit 15$ again.


$AAL- End of a short and Time for a Long (BULL RUN)Welcome Ladies and Gentlemen once again to another edition of FrancoBlanco's Dreams. From what I can technically see on this chart is the fact that this chart is VERY BULLISH!! Just look at the Fib Retracement Indicator, now take a look at the RSI History Alert Indicator, and let us not forget the CCI indicator. What do all these indicators have in common? All These indicators have one thing in common, and that is a bullish long-term market. We are crossing that red cloud.. NASDAQ:AAL

AAL AnalysisAAL got left behind on the runs last week. Let's see if it wakes up this week.
Ideal entry: close over 12.50 OR red trendline
Safe PT: 13.50
Final PT: 14-14.50

AAL (AMERICAN AIRLINES GROUP INC) LONG SET UPTITLE/(DATE)- BUY AAL
(American Airline) (9/23)
ASSET- STOCK
ORDER TYPE- market first/BUY LIMIT
Time Frame-1Week
ENTRY PRICE 1- $11.50 market ✅
ENTRY 2- $8.50 (pending)
STOP LOSS- $7.50 (40 PIPS)
TAKE PROFIT 1-$14.50 (30 PIPS)
TAKE PROFIT 2- $19.50 (80 PIPS)
TAKE PROFIT 3- $23.50 (120 PIPS)
STATUS: 🏃🏽♂️ACTIVE 🏃🏽♂️

AAL American Airlines Group | SWING - 21. AUGU. 2020Hello Traders Welcome Back.
***
Here is the full analysis for this pair, let me know in the comment section below if you have any questions, the entry will be taken only if all rules of the strategies will be satisfied. I suggest you keep this pair on your watchlist and see if the rules of your strategy are satisfied.
***
Please consider to put a like to my idea for supporting me & subscribe for more ideas.

Risky Play For American AirlinesI think we saw a recent spike from American airlines as buyers are finding interest as price hit the top of previous major structure (green arrows) an s&r play.
Notice the spike of the candle where I have a red arrow drawn. To me this looks like an exhaustion candle as buyers got slapped back down. I some what agree with playing the previous structure as an s&r play, but for me it's too much of a risk.
I would need more time to see trend start to develop for a position on american airlines, as we do sit under Resistance.
Premarket is doing good, but I'm not looking at this from an intraday perspective. I say let it develop.


AALLast time selling volume where here , it follow with strong rise up .
MEANWHILE with VIX Index Journey to 25% start and giving other american index stability on the right levels -which is perfect for pre-election , and all the world hoping and following covid-19 drug news.
ITS buy and hold trade for 2 weeks it would be your responsibility to find the right exit or if u any thing like me
i will hold it until i see it next year at 80 price for share .
which would be at that time very normal when we watch airline Companies passing the corona-virus disaster and Travel restrictions .
it would grant huge safe for high yield and this would make it much much attractive for investors and Speculators

Look Up Into The Sky - AAL TARGET UPDATEWhat we have here is as typical Wedge pattern with the (E) wave ending at around 11-10 USD.
To confirm this movement we have our CCI indicator which seems to indicate that its losing steam on the downtrend.
And to all the haters saying the airline industry is gonna go bankrupt. The federal loans disagree with you.
If you want to buy, now is the time.

Tasty investment opportunity! American Airlines buy signalsAmerican Airlines (AAL), monthly chart: 12 years long(!) support line + Oversold + Hidden divergence + 2 Hammers

AAL Long Position Looking to test out riding what appears to be a bottom and upward trending price movement. Assuming Covid 2.0 doesn't rear its head and affect the movement & support holds around this buy zone ~12.50. Feedback needed! Thank you.

American Airlines breaking bullish afterhour. Added $16 longAmerican Airlines breaking bullish afterhour. Added $16 long
It broke it after hour meaning, this is bullish especially with the recent short internet that came in.
Load up time

Long AAL IntradayLooking at AAL today saw some good movement and it seems to be liking the 17.83 support area. In terms of probability, the stock holds some upside potential atleast until the next resistance 18.55. If the stock opens lower than the 17.83 support I will be looking at a more bearish outlook, a movement towards the 16.93 previous resistance. All in all in my analysis I deduce that
1. if the stock opens higher than the current resistance (18.55) I can definitely see a movement up to the 19.50 region and towards 20.30
2. If the stock opens at the current support (17.83) I can see it move upto to the resistance level 18.55 and profit with a quick scalp
3. if the stock open below the current support (17.83) I can see the stock move down to the previous resistance level (16.93)
My pick: #1
Given the right momentum and bull pressure we can break past the 19.50 region and if so I can place TPs at 19.50, 20.30 and 21.20
Let me know if you guys think of anything else. Just looking to record my ideas and if they help anyone with their own analysis, all the better.

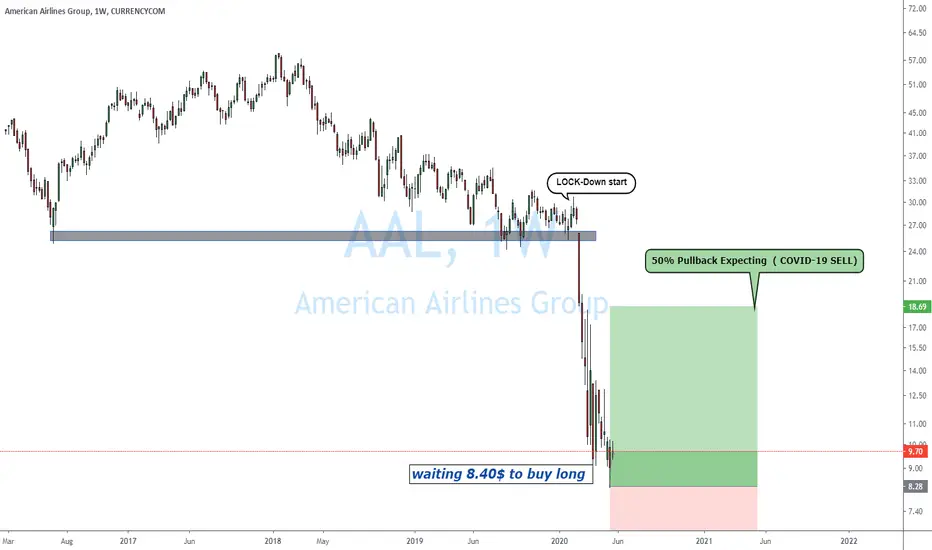
Waiting for BUY AFTER RE-Open world Airlines.NASDAQ:AAL
Let's wait to see if COVID-19 Uncertainty reduce,
Two things we need to watch out the market, ALL stock index expecting for more crush before V-SHAP recovery next 3-6 months, DJI Expecting crush again towards 20,000$ and NASDQ100 8500$ once this crush has done, good to buy airlines stock and all other stocks
Airlines are a tricky and complicated business that, personally I would stand aside but long term good to hold and wait for lockdown end.
🛑SUPPORT/RESISTANCE
✅S1= 9.8$
✅S2=6.9$
✴️R1=13$
✴️R2=24$
Please like, share, comments and follow me to get daily base analysis
Thank you for your support, I appreciate it.