$MULTI Ready to Fall Off!I have been trading Multi off and on for a month or so. I entered a short position on March 20th and added to the position today. Volume here is quite low. $MULTI could continue to hit lower lows and reverse a trend back towards the $5-$7 range. I am playing this as a swing trade based on my overall outlook on crypto market.
AAPL-FB

Beginning of an End (Update on Uber 3)Uber is at the peak of driver's dissatisfaction. Will bribery rescue it once again? No.
It is beside the company's debts and cyber security weakness.
It got no future...

AAPL 185 In SightWeekly put in a strong candle, moving averages have also converged indicating a good amount of liquidity is positioned for AAPL to put in new highs, PT 185.

Update on TESLAThis is how FoxNews Fu**ed up TESLA.
Musk is going loco, he is ruining the company with his wrong and intrusive political ideas;

$AAPL $FB $SPY $QQQ I OptionsSwing WatchlistAAPL 1M I AAPL is barely holding the uptrend on the monthly chart. It looks bearish below $150. AAPL moved lower last week after reporting earnings.
FB 1M I FB managed to hold the uptrend on the monthly chart after it beat earnings last week. $170 seems like a strong support level while $220 is resistance.
QQQ 1D I QQQ is testing March lows as the overall tech sector remains weak. After the biggest tech players reported earnings last week we saw many fade after ER.
SPY 1D I SPY is testing the lows from March. The overall trend remains to the downside as the market leaders have disappointed after reporting earnings.

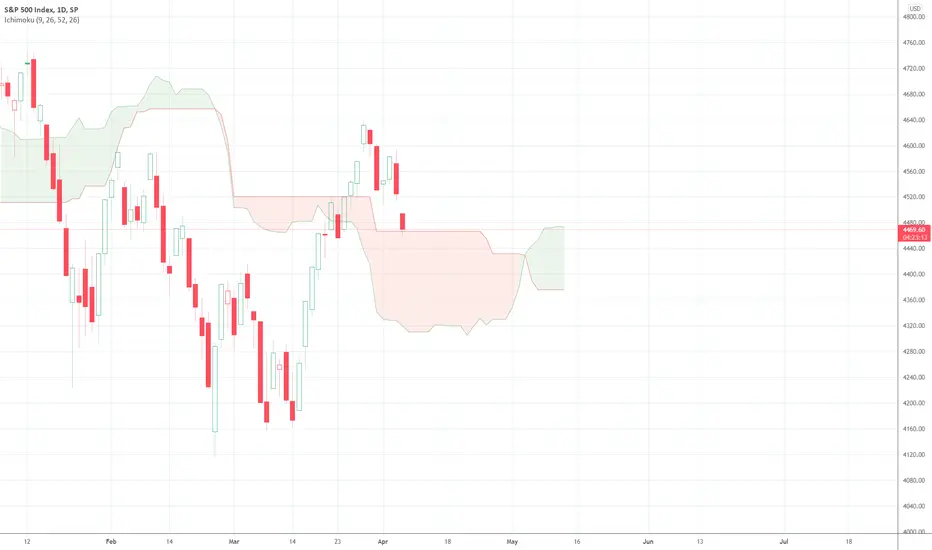
SPX Daily CloudSPX daily bouncing on a massive cloud. This is an absolute must hold for the market...
Weekly Levels Strategies: Support/Resistance Crypto, Stocks, etcBitcoin, Ethereum, Solana, and cryptocurrencies as a whole are caught in consolidation where a breakout to either side will define the trend. Stock market indexes of S&P 500 and Nasdaq have given a bullish signal but where will that change? Commodities like oil, wheat, and corn are ripping. Gold and Silver are giving bullish breakout signals. Tech stocks are teetering on edge while defensive plays like utility stocks are rising.

A review on my February 2022 trades..!What is more important than the trading results???
The strategy behind the trading/investment models..!
After doing lots of research, I decided to combine Warren Buffet, George Soros, and Jim Simons's strategies to build my own trading system.
So far I am happy with the results..!
Why?
Because I beat the market in the past 2 months by far..!
In a bullish market, everyone feels like they are the wolf of the streets, but when rainy days come they have no plan..!
Looking at markets, you see all major indexes are down between -6.27%-13.06% in 2022:
Now let's look at my results:
After a successful January with +6% (stock & options trading) in February 2022, you could make 4.8% if you had taken all the stocks and options trades I offered in February 2022.
*Details of the trades are marked on the charts..!
The significance of this will sine more if you are looking at the negative returns of S&P 500(-2.9%), Nasdaq 100(-4.94%), and Dow Jones(-3.05%) in the very same month!
This makes my compound profit of 11% in the past 2 months..!
If you have followed me for over a year you know this result is far away from the +61% in the first 7 weeks of 2021, but at that time market was very different..!
What is the logic behind my trading strategy in 2022:
The most important one: handling the Volatility in the right way: Decreasing number of trades..!
Jim Simons:
When market volatility surged, Renaissance’s system tended to automatically reduce positions and risk.
The second most important rule that helps in all markets: Win Big and lose small:
If you are looking at the win ratio of my trades it is 50%, but the amount I win in my winner trades is much bigger than my loser trades..!
George Soros:
It's not whether you're right or wrong, but how much money you make when you're right and how much you lose when you're wrong.
Finally:
Warren Buffett:
I insist on a lot of time being spent, almost every day, to just sit and think. That is very uncommon in American business. I read and think. So I do more reading and thinking, and make less impulse decisions than most people in business. I do it because I like this kind of life.”
Now you see why I publish fewer trading ideas in 2022..!
The goal is not to make lots of trades, the goal is to make money constantly and beat the market performance in the long term..!
** Consider combing this with my Crypto, Gold, and OIL ideas, the performance will become double or more..!
related articles:
Best,
Dr. Moshkelgosha M.D
DISCLAIMER
I’m not a certified financial planner/advisor, a certified financial analyst, an economist, a CPA, an accountant, or a lawyer. I’m not a finance professional through formal education. The contents on this site are for informational purposes only and do not constitute financial, accounting, or legal advice. I can’t promise that the information shared on my posts is appropriate for you or anyone else. By using this site, you agree to hold me harmless from any ramifications, financial or otherwise, that occur to you as a result of acting on information found on this site.

𝗔𝗺𝗮𝘇𝗼𝗻 𝗨𝗽𝗱𝗮𝘁𝗲: $AMZN Daily. Bear Trap?IF it can clear this resistance zone I think we may have fuel for a major breakout as that looks like a nasty bear trap 🐻 🪤 under 2.9K
$QQQ $NDX $NQ_F $AAPL $FB $MSFT $GOOG $SPY #Stocks #Trading 📈


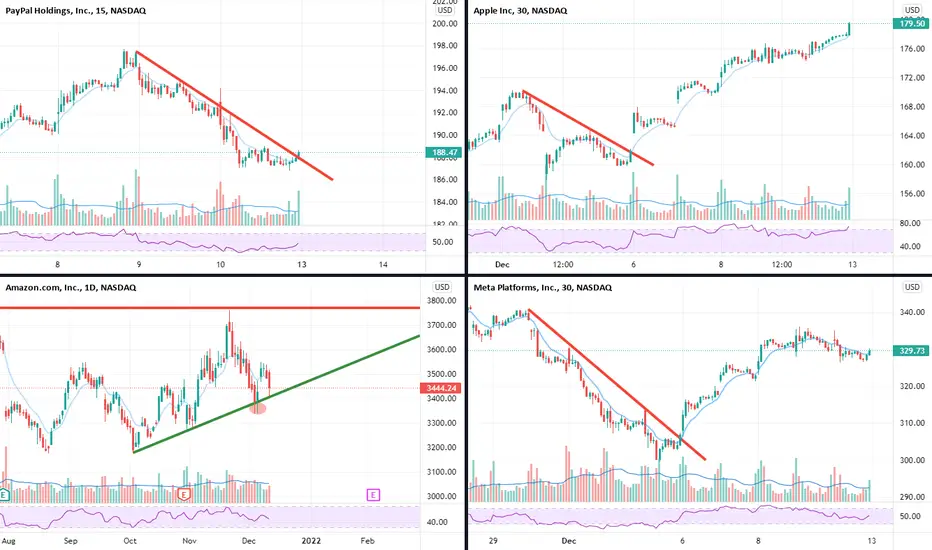
$PYPL $AAPL $AMZN $FB I OptionsSwing WatchlistPYPL 15M I Our OS ALGO picked up some PYPL $192.5c 12/17 @ $1.91. PYPL looks to be holding support near $187.50, and it is holding right above a gap it left last week.
AAPL 30M I As we mentioned last week, AAPL was showing overall strength. It broke out from our downtrend and made an 11%+ move from $161.85 to nearly $180.
AMZN 1D I AMZN is holding an uptrend on the daily time frame since October. There seems to be support near $3,410. Watching AMZN for a possible reversal here.
FB 30M I As we mentioned last week, the $300 level was key support for FB. It broke from our downtrend and made a nearly 10% move in four trading days.
$RBLX $AAPL $U $FB I OptionsSwing WatchlistRBLX 15M I RBLX is down near 20% from recent highs. $112 is acting as support. Watching for a breakout from the current downtrend on the 15 minute time frame.
AAPL 15M I AAPL showed strength the past few days as it managed to outperform its sector and QQQ. We are seeing a double bottom so far near the $160 level.
U 1H I Unity has been on a free fall and has shed 30% of its value in days. Expecting a retest of our trend on the 1 hour time frame. There is a slight div on the RSI.
FB 15M I FB has entered a bear market after falling more than 20% from ATH levels. Seems like $300 is a psychological support level that was defended last week.

FXCM FAANG Basket Moves Into Bullish Stack On the DailyThe above chart show's the daily time frame of FXCM's FAANG Basket. We are using a triple EMA system to assess trend. The short-term green EMA > intermediate orange EMA and the intermediate orange EMA> the slow red EMA (blue rectangle). We note that NFLX reported last week and that the rest of the FAANGs (FB, AAPL, AMZN, GOOG) will report this week. Following their respective releases we will assess the basket's EMAs and their angle and separation. If these develop, it will be regarded as bullish, suggesting that a possible bullish momentum push may be underway.

The Magical 50 days Exponential Moving Average (50EMA)In 2021, we should take the price reaction to 50EMA very seriously! Especially if you like to buy the dips!
I believe it could be single best tool to help you find the best entry and exit point in many tickers..!
Let's review few examples:
1- NASDAQ:NVDA
2- NASDAQ:MSFT
3- NASDAQ:AAPL
4- NASDAQ:GOOG
5- NASDAQ:FB
6- NYSE:CRM
7- NASDAQ:CSCO
8- NYSE:SNOW
9- NYSE:BAC
10- NYSE:XOM
and major indexes:
SP:SPX
TVC:NDX
TVC:DJI
What is Price Action?
Price action is the movement of a security's price plotted over time. Price action forms the basis for all technical analysis of a stock, commodity, or other asset charts. Many short-term traders rely exclusively on price action and the formations and trends extrapolated from it to make trading decisions. Technical analysis as a practice is a derivative of price action since it uses past prices in calculations that can then be used to inform trading decisions.
Price action generally refers to the up and down movement of a security's price when it is plotted over time.
Different looks can be applied to a chart to make trends in price action more obvious for traders.
Technical analysis formations and chart patterns are derived from price action. Technical analysis tools like moving averages are calculated from price action and projected into the future to inform trades.
How to Use Price Action
Price action is not generally seen as a trading tool like an indicator, but rather the data source off which all the tools are built. Swing traders and trend traders tend to work most closely with price action, eschewing any fundamental analysis in favor of focusing solely on support and resistance levels to predict breakouts and consolidation. Even these traders must pay some attention to additional factors beyond the current price, as the volume of trading and the time periods being used to establish levels all have an impact on the likelihood of their interpretations being accurate.
Limitations of Price Action
Interpreting price action is very subjective. It's common for two traders to arrive at different conclusions when analyzing the same price action. One trader may see a bearish downtrend and another might believe that the price action shows a potential near-term turnaround. Of course, the time period being used also has a huge influence on what traders see as a stock can have many intraday downtrends while maintaining a month-over-month uptrend. The important thing to remember is that trading predictions made using price action on any time scale are speculative. The more tools you can apply to your trading prediction to confirm it, the better. In the end, however, the past price action of a security is no guarantee of future price action. High probability trades are still speculative trades, which means traders take on the risks to get access to the potential rewards.
Conclusion:
Monitor asset reaction to 50EMA and define your entry and exit strategy based on this simple tool!
Reference Article::
www.investopedia.com

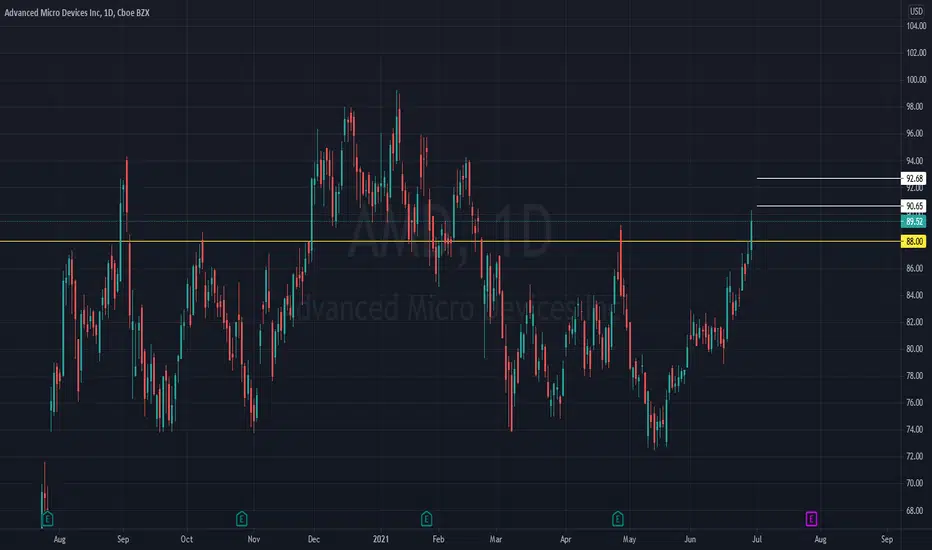
AMD88 was the entry trigger today. If AMD can hold above this level it can make a move higher towards 93 this week.
ABNB: Retest of 21EMA, Then a Rally to the 50DMA?ABNB lost some steam yesterday after testing a 153 handle. We saw some light inflows today at the open, which have now been erased, but we look poised to test the 50DMA sitting around 156.36. We also have room to run toward the upper band of the triangle around 160 if the 50DMA is captured, where we should see strong resistance and possibly a continuation of the recent (persistent) downtrend. A break above the upper band resistance would see us breakout and a new uptrend would form. The major headwind here is sentiment around growth. If the Fed comes off even remotely hawkish, growth is going to tank...

AMZN Approaching Heavy ResistanceAMZN is approaching the upper band of it's 11 month range. I don't expect a breakout to new ATH's, but certainly we may see a retest of the ATH around 3,550 as early as this week (unless the Fed disappoints markets this afternoon by hiking the IOER or RRP/even mentioning tapering bond purchases), followed by a potential retest of the lower band around 2,950.

AAPL Setting up for a Test of 138 Resistance?AAPL is in the process of breaking through it's MA resistances after seeing support at the lower band of the wedge. We have potential upside to around 138 at the upper band, and trendline support just below the MA's around 126. The RSI is sitting around 60 at the moment, so we still have room to run on the daily time frame implying a higher probability of further upside this week (absent any changes in sentiment)...

KSM: PT $675 by Mid-June / $900 by Late June KSM is on schedule to release some of the most advanced technology on the market and the large institutional money is flowing into both DOT and KSM.
KSM is only $3.4B market cap and has a lot of room to run to be properly priced - right now the market is not really aware of the potential of KSM but there will be several large auctions launching over the next 2 weeks on KSM that will raise lots of attention to the network's value.
KSM Parachain Auction Schedule per below:
2021/06/15, 12:00 GMT: First Kusama Parachain Slot auction commences. Bids may be placed.
2021/06/17, 09:00 GMT: First Kusama Parachain Slot auction ending period begins. Only bids made prior to this point will certainly be considered in the final result. Bids made following this point have a linearly reducing chance of being considered.
2021/06/22, 09:00 GMT: First Kusama Parachain Slot auction bidding ends. No bids may be made on this auction following this point.
2021/06/22, 11:00 GMT: First Kusama Parachain Slot auction winner selected. The auction winner is determined as the highest bidder at some randomly selected point over the past five days.
2021/06/22, 12:00 GMT: Second Kusama Parachain Slot auction commences.
2021/06/29, 12:00 GMT: Third Kusama Parachain Slot auction commences.
2021/07/06, 12:00 GMT: Fourth Kusama Parachain Slot auction commences.
2021/07/13, 12:00 GMT: Fifth Kusama Parachain Slot auction commences.
medium.com
Technicals
1) There's Hidden Bullish Divergence on the 4H chart of KSM - Price has made a higher low while the RSI oscillator is making a lower low.
2) Daily MACD has a bullish cross
3) Daily EMA ribbons are all bullishly crossed (not many cryptos have even a single daily EMA bullish cross)
-This is looking ripe for an ATH high to be made in the next few days - I've made an illustrative path the price could take to end of June - don't take it as verbatim. Anything can happen!
I'm also equally bullish on DOT (see chart below)

There is no buyer in the market..!NASDAQ:MSFT
NASDAQ:AMZN
GOOG
NASDAQ:FB
NASDAQ:TSLA
I believe there is no buyer in the market!
look at Tesla, 3 months ago at the same price trading volume was 89 million, today it is 26 million. 71% decrease..! take it seriously.

People make mistakes, Money don't!We have different players in markets, but the summation of their interaction always presents itself as the market price, no matter if you look at the stock, cryptocurrency, commodities, or real estate market.
I believe the most important factor behind any price movement in any market is money flow and the stock market and cryptocurrency market are not exceptions. Whenever we have a positive money flow (influx)in the market, prices will go up. The opposite is also true! if we have a negative money flow (outflux), prices will go down.
Evaluating the money flow must become a habit for long-term investors and short time traders. Because investing in an asset with a negative money flow (outflux) will almost always waste your time and capital as a long-term investor! On the other hand, money flow creates lots of trading opportunities for short-time traders in any market!
This reality is not ignorable, and those who ignore it will pay for that. I usually follow the average trading value to evaluate the money flow of the trend and how strong a trend is. Having said that, we can redefine the bullish trend as prices going up plus money influx, and the bearish trend is when prices go down and we have money outflux.
To have a better idea let's review this on the charts:
NASDAQ:TSLA Weekly chart since 2019.
Red/Green bar chart: Weekly Trading Value estimate(Volume*Closing Price)
Orange line: 4 weeks average Trading Value (if multiply by 4 you can have an estimate of monthly trading value)
A constant increase in monthly trading value from 48 Billion in June 2019 to 844 billion in December 2020 caused an 1863% gain in the same timeframe.
Maximum trading value in one week: 290 Billion, third week December 2020
Maximum trading value in one month: 844 Billion, December 2020
Last week Trading value: 111 Billion (-62% decreased)
Last month Average Trading value: 481 Billion (-43% decreased)
NASDAQ:AAPL Weekly chart since 2019.
Red/Green bar chart: Weekly Trading Value estimate(Volume*Closing Price)
Orange line: 4 weeks average Trading Value (if multiply by 4 you can have an estimate of monthly trading value)
A constant increase in monthly trading value from 134 Billion in January 2019 to 525 billion in August 2020 caused a 288% gain in the same timeframe.
Maximum trading value in one week: 143 Billion, first week September 2020
Maximum trading value in one month: 525 Billion, August 2020
Last week Trading value: 65 Billion (-54% decreased)
Last month Average Trading value: 248 Billion (-53% decreased)
NASDAQ:AMZN
NASDAQ:FB
NYSE:NIO
NYSE:PLTR
NYSE:GME
NASDAQ:BNGO
NASDAQ:RIOT
By now you should be familiar with the power of money in the market and how money flow affects the trend!
Any increase in price without an increase in money flow is not sustainable and creates a profitable short opportunity..!
Moshkelgosha (Sniper Trader)

QQQ holding last trend lineOBV divergence signaled a potential correction, as price were making higher highs, OBV was making a lower high.
On the plus side, we are making higher lows since march lows.
There is a resistance trend line that is still holding, and is now coincident with the 61.8% Fibonacci retracement line.
A buy with a stop below the trend line has worked great the last 3 consecutive times it tested.
If we do keep selling off, I expect the next place we could pause at the $298 level, just below the 200sma.

What is an Advanced Breakout and how to trade it?Hello Tradingview community! Today I want to share something which is pretty rare to see around, the Advanced Breakouts (AB)!
What is an AB? Is an event when the indicator may anticipate the price's movement. Some indicators like the RSI or the OBV are great for this, and in this analysis, I'll use the RSI as an example.
See the movement on the Nasdaq 100 today? While the price did a double bottom, the indicator didn't, and that's a divergence. But when we see the indicator doing higher highs / higher lows while the price isn't, this is an AB! Usually, this anticipates the next movement on the price, in the direction of the AB.
And we have different types of ABs. Some of them are weaker, some are stronger. Let's see more examples. Since the Nasdaq 100 is doing an AB, some of the faangs are doing this too, like FB:
Here is an example of a weak AB. We have almost no divergence, but the indicator is already doing a new high, while the price isn't. The divergence on AAPL is a little stronger:
The RSI did a twin mountains pattern, but it didn't work and now it is doing a new high. The price did no such thing, and has yet to break the previous high. But this AB is not as strong as the one seen on AMZN:
On AMZN's chart it has an inverted head and shoulders, while the RSI has a strong divergence, as it is doing higher highs and higher lows. Also, AMZN's RSI already broke its resistances, while the price is still falling. This is a strong divergence and an incredibly strong AB.
But since the indicator is anticipating the price's movement, some people will trade the indicator, without waiting for the confirmation on the price. This is a mistake, and it could affect the chances of success of your trade. Always wait for the confirmation on the price. For instance, wait for AMZN's inverted head and shoulders to be triggered before trading it, and use the AB as a confirmation of your initial thoughts.
This is it, community! This is the Advanced Breakout and how to trade it! If you liked this trading idea, remember to click on the “Follow” button to get more trading ideas like this, and if you agree with me, click on the “Agree” button 😉.
See you soon,
Melissa.
