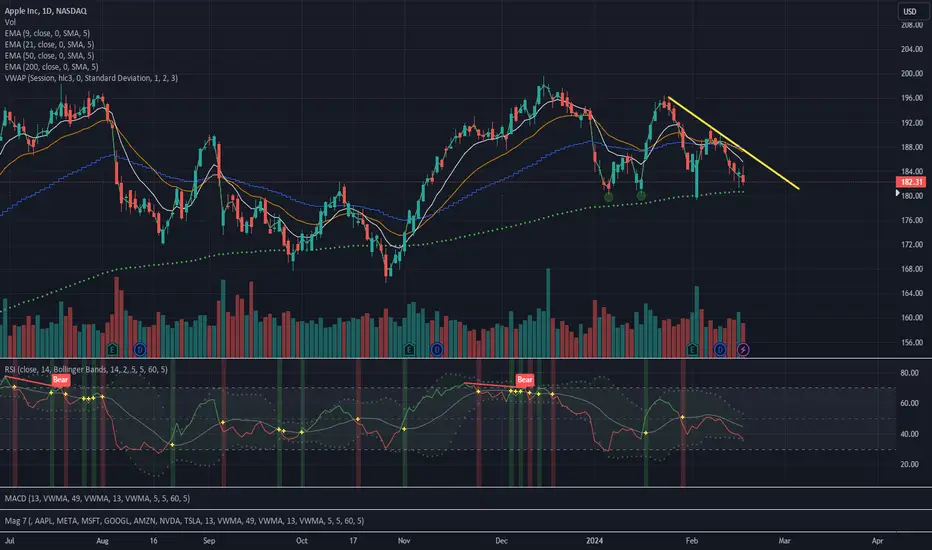
APPLE Long-term buying commencing.Apple (AAPL) is exactly -15% down since the December 14 2023 High and is approaching the Support Zone of the October 26 2023 Low. We are currently on the 3rd major correction of the last 18 months and being that close to both the Support Zone and the bottom of the Channel Down, suggests that institutional buying should be initiated.
If the current overall market volatility evolves into a short-term correction towards the Fed Rate Decision later this month, then there is always the possibility of Apple experiencing another -10% decline. But the upside even from the current level is greater at almost +30% and that is a conservative target based purely on the Higher highs trend-line since the August 17 2022 High.
We recommend buying now and if the price drops more as mentioned, a final buy on the 1W MA200 (red trend-line), which has been untouched for almost 8 years (since June 28 2016)! Our Target for late Q2 is $215.00. Note also that the 1D RSI hasn't been that low (oversold at 23.00) since February 02 2018, which adds more to the bullish case.
-------------------------------------------------------------------------------
** Please LIKE 👍, FOLLOW ✅, SHARE 🙌 and COMMENT ✍ if you enjoy this idea! Also share your ideas and charts in the comments section below! This is best way to keep it relevant, support us, keep the content here free and allow the idea to reach as many people as possible. **
-------------------------------------------------------------------------------
💸💸💸💸💸💸
👇 👇 👇 👇 👇 👇
AAPL

$AAPL is breaking below the strong resistance NASDAQ:AAPL broke below 180 and is marking the upside cycle end. In the video you will see a detailed technical Elliott Wave analysis along with price action and trade setup

$APPL aiming for an IHS pattern perhaps given low RSI$APPL plan for the next few days is based on the potential test of $165.5. I think once we see action around this level, $APPL could bounce nicely to around $175. The chart does not favors a steady recovery. I think as long as $APPL's management is unable to articulate a credible strategy around AI in the short term the stock will continue to be weak. Considering the low RSI, I'd favor a bounce. I think $APPL could support the market if they tank other magnificent 7. We may see NASDAQ:META tanking from the $490s into the $400s for example while $APPL takes of into the $180-190s by Q2 or so. Perhaps it is also a good time for the Board to consider replacing Tim Cook to a visionary, as Tim has been a good operator but for another time. We need someone like John Ives or similar. Let's see what the market brings for $APPL in the coming days. Here's a path that I see could develop> Inverse Head and Shoulders, repairing of some singles around 177-178, and then test of 180.9. Of course market makers will ensure to keep most premiums as usual.

AAPL Drops Below $174 to $177.50 Support ZoneAAPL continues to show weakness by dropping below the light blue support zone for a second time. AAPL is trading below support and there is likely to be a short-term rebound here. I would look for a bounce around $165 to $168.

$AAPL Long call $180. As per my analysis, apple must be Bullish. this is the right time to enter the Dip. Be a smart trader. I am sharing my analysis and important support and resistance for $AAPL.

Stock Market ceiling, 5260$SPX500 hits ceiling somewhere around April to June. (if current trend holds intact)

$APPL is at crossroadsI think NASDAQ:AAPL missed the AI PR train, even if APPL has been developing something with Siri, it is late to the game and the market is not rewarding Apple for a delayed product launch. Perhaps this can be remedied and APPL is probably attempting to do this by cancelling its EV plans earlier this month. Market is saying this is not enough and wants to see Apple walking the talk. I don't think Tim Apple is the right CEO for this new world of Apple, and may soon be replaced with a visionary. I think the hiring of John Ive in replacement for Tim Apple could put APPL in a path towards the $300s, as long as AAPL board does not get this, Tim Apple could bring down apple into the 60s by 2027 or so. So far, our strategy of buying short term puts at 175 to hedge the long calls helped a bit but now we're flat. I may exit the position of AAPL to rethink a bit of what is this story all about.


APPLE What Next? BUY!
My dear subscribers,
This is my opinion on the APPLE next move:
The instrument tests an important psychological level 179.63
Bias - Bullish
Technical Indicators: Supper Trend gives a precise Bullish signal, while Pivot Point HL predicts price changes and potential reversals in the market.
Target - 184.41
My Stop Loss - 177.23
About Used Indicators:
On the subsequent day, trading above the pivot point is thought to indicate ongoing bullish sentiment, while trading below the pivot point indicates bearish sentiment.
———————————
WISH YOU ALL LUCK

APPLE: Market Sentiment & Price Action
Remember that we can not, and should not impose our will on the market but rather listen to its whims and make profit by following it. And thus shall be done today on the APPLE pair which is likely to be pushed up by the bulls so we will buy!
❤️ Please, support our work with like & comment! ❤️

Apple's Market Performance Amidst the Magnificent SevenThe renowned "Magnificent Seven," a collection of tech titans including Alphabet, Amazon, Apple, Meta Platforms, Microsoft, Nvidia, and Tesla, has embarked on a diverse journey since the onset of the year. While certain members, notably Meta Platforms and Nvidia, have dazzled with stellar performances, others, like Apple, have faced a less triumphant trajectory, with its stock dipping nearly 5% year to date, positioning it as the second weakest link within the ensemble.
However, the recent downturn in Apple's shares prompts a closer examination rather than outright dismissal. Let's delve into why Apple remains a compelling prospect for long-term investors.
The decline in Apple's stock followed the disclosure of its financial results for the first quarter of 2024, concluding on December 30, 2023. Despite the tech giant's overall modest performance, particularly with net sales inching up by approximately 2% year over year to $119.6 billion, Apple's earnings per share showcased a robust 16% year-over-year surge to $2.18. Investor dissatisfaction primarily stemmed from the company's lackluster performance in a pivotal market - China.
Sales in China encountered a 13% year-over-year dip, amounting to $20.8 billion, constituting roughly 17.4% of Apple's revenue for Q1 2024. The downturn was attributed to reduced sales of iPhones and other devices. Nevertheless, this setback is perceived as transient, with smartphone sales encountering hurdles in China throughout the previous year, partially due to broader economic challenges affecting various companies, not exclusive to Apple. Tim Cook, Apple's CEO, emphasized Apple's continued dominance in China and other markets, citing data from a Kantar survey.
Analyzing Apple's first-quarter results reveals two optimistic facets, particularly concerning its performance in China. Firstly, the period encompassed 13 weeks compared to the previous fiscal year's parallel quarter, which spanned 14 weeks. Secondly, currency exchange rate fluctuations adversely impacted Apple's sales growth metrics in China.
While the economic slowdown in China may persist temporarily, Apple's long-term growth prospects remain robust. The company's resilience, coupled with the anticipation of an economic rebound, positions Apple favorably for sustained success over the extended horizon.
Apple's iPhone segment continues to spearhead revenue generation, witnessing a notable 6% increase to $69.7 billion in Q1 2024. Among Apple's diverse segments, only the services unit outpaced this revenue growth, boasting an 11.3% year-over-year upswing to $23.1 billion. With services contributing approximately 19% to Apple's overall revenue, this segment is increasingly pivotal for the company's trajectory.
Artificial intelligence (AI) emerges as a significant frontier for Apple. While specific details remain undisclosed, Tim Cook hinted at forthcoming revelations regarding the company's continued investment in AI during the recent earnings conference call. Despite trailing behind industry giants like Microsoft and Alphabet in the AI realm, Apple's adeptness at redefining technologies underscores its potential to thrive in this domain.
Despite recent challenges in the Chinese market, particularly concerning smartphone sales, Apple's diversified growth avenues and robust financial position render it an attractive investment opportunity. Long-term investors are presented with an opportune moment to acquire Apple shares, considering its comparative underperformance vis-à-vis certain Magnificent Seven peers year to date. With its foray into AI, healthcare, fintech, and other sectors, Apple remains poised for sustained success in the foreseeable future.

Apple Analysis: Key Paths AheadFor Apple, two scenarios remain feasible. We continue to believe that we may have witnessed the completion of a significant cycle and anticipate a further correction downwards, expected to range between $115 and $90. Theoretically, according to traditional analysis, this correction should ideally be between $115 and $92. This bearish grand scenario would become invalid if we breach the 138% level before completing the correction.
Shifting to our bullish scenario, it suggests that what we saw in 2021 wasn't Wave (5) but rather Wave (3), followed by a Wave (4) correction and an impending Wave 5. Whether this is fully feasible remains uncertain. It's not entirely dismissible, yet it's hard to fully endorse without reservations. Therefore, we're closely monitoring the overall market sentiment to decide whether to place our limit order on the bullish short-term scenario.

AAPL Share Price Rises Nearly 1%AAPL Share Price Rises Nearly 1% after Scrapping Electric Vehicle Plans
In 2021, the release of an electric car from Apple was expected in 2025, in 2022, the deadline was shifted to 2026. As it became known yesterday from Bloomberg and WSJ, Apple decided to completely abandon the project.
Causes for this decision:
→ the electric vehicle market turned out to be not so turbulent;
→ production and technological difficulties;
→ the strong development of electric vehicle construction in China may also have played a role.
Some employees will be fired, others will be transferred to a more promising department related to developments in the field of AI. Despite the fact that the ambitious project, which lasted about 10 years, failed, the price of AAPL shares rose by almost 1% yesterday as a result of trading — perhaps investors positively assessed the reorientation from electric vehicles to a more promising direction related to AI.
The AAPL stock chart shows that the level of USD 180 per share acts as support; several rebounds from it have already been formed in 2024. And the news about the abandonment of plans to produce electric vehicles caused the last of them. However, how reasonable is it to buy AAPL shares in such a situation?
Issues for bulls may include:
→ the fact that the price of AAPL is significantly weaker than stock indices, which are rewriting historical peaks thanks to NVDA, MSFT and other leaders;
→ the results of reorientation from electric vehicles to AI are a long-term and uncertain prospect;
→ from the point of view of technical analysis of AAPL stock, a downward trend appears on the chart (shown in red). Its upper border is a potential resistance line. And if there is a bearish breakout of the important USD 180 support, it could further resist the bulls' attempts to restore the AAPL share price.
Also causing negativity is that:
→ the price is fixed below the black trend line;
→ MACD is in bearish territory.
However, looking ahead to the next 12 months, analysts surveyed by TipRanks believe Apple shares will avoid a decline and benefit from the current bull market; their average price forecast for AAPL stock is USD 206.15.
This article represents the opinion of the Companies operating under the FXOpen brand only. It is not to be construed as an offer, solicitation, or recommendation with respect to products and services provided by the Companies operating under the FXOpen brand, nor is it to be considered financial advice.

Everything In Our FavorI am a previously successful trader who has been out of the game for a few years but I am getting back in to pay off some short term debt and I need to generate some extra income to pay off this high amount of short term debt. I am choosing options again because that is where I was successful before. I turned $2k into $20k 5 years ago and I believe I still got it! But enough about me, lets dissect each indicator I am using for this long call trade.
D Plus: Showing a green cloud beneath the most recent candles indicating bullish divergence. If you look further back at the last green arrow indicator it did indeed rise and we could be set up for another rise and the next buy signal could be moments away. These signals are so accurate that the creator charges a subscription for. Next!
Triple confirm: Shows several buy signals along with low RSI and lower trade volume. Trade volume could increase tomorrow with AAPL being under bought and speaking of RSI lets take a look at the true RSI indicator.
RSI: The RSI is 36.81 making AAPL extremely underbought. This could help us understand that the price will rise as more buyers will buy in bringing this level back up. Technically right now the price of Apple is a steal according to the RSI and buyers want their deals.
Divergence: Finally divergence, the divergence shows weakening bearish divergence and growing Bullish divergence. This is a sign that the bulls are regaining strength and could take over causing price to rise as buyers are buying Apple up at this price.
What are your thoughts? Would love to see them in the comments!
Good luck and happy trading!

AAPL Technical Analysis and Trade IdeaOn the monthly time frame, #AAPL exhibits a bullish trend with a recent retracement into an equilibrium zone. As we delve into lower timeframes, a base formation becomes evident. Specifically, we observe a double bottom setup followed by a break below the previous lows, a robust rally, and subsequently, a higher low formation.
As we continue analyzing the shorter timeframes, we notice a potential shift in the current downtrend. This change in character suggests the possibility of a structural break. My focus lies on identifying a buy opportunity if we witness a breakout and subsequent retest of the previous high on the 15-minute timeframe.
However, it’s paramount to acknowledge the inherent risks associated with trading. Always conduct thorough research, considering both fundamental market drivers and the broader macroeconomic landscape, in addition to your technical analysis. Implement sound risk management strategies to safeguard your capital.
Disclaimer: This analysis provides a technical perspective on AAPL and should not be construed as investment advice. Tailor your trading decisions to your specific risk tolerance, informed by comprehensive market research and a holistic assessment of all relevant factors.

APPLE My Opinion! BUY!
My dear subscribers,
My technical analysis for APPLE is below:
The price is coiling around a solid key level - 182.48
Bias - Bullish
Technical Indicators: Pivot Points High anticipates a potential price reversal.
Super trend shows a clear buy, giving a perfect indicators' convergence.
Goal - 186.65
My Stop Loss - 180.11
About Used Indicators:
By the very nature of the supertrend indicator, it offers firm support and resistance levels for traders to enter and exit trades. Additionally, it also provides signals for setting stop losses
———————————
WISH YOU ALL LUCK

AAPL Stock: Positive Divergence & Key SupportAAPL (Apple) stock continues to show positive divergence. On the daily chart, if there are no daily closings above the Kaufman Moving Average, the declines may persist. We observe that the orange line serves as a robust support area. If weekly closings occur above the upper band, we can suggest a return to the upward trend. However, if there are closings below the orange line in the 2-day period, a retracement may occur towards the middle band of the lower channel.
WARNING: THIS ANALYSIS IS NOT INVESTMENT ADVICE. CONSIDER YOUR OWN RISK TOLERANCE AND FINANCIAL SITUATION BEFORE MAKING DECISIONS. FUTURE PERFORMANCE IS NOT GUARANTEED; THIS IS MERELY AN OPINION. INVEST PRUDENTLY AND CONDUCT THOROUGH RESEARCH.

APPLE: Long Trade with Entry/SL/TP
APPLE
- Classic bullish pattern
- Our team expects retracement
SUGGESTED TRADE:
Swing Trade
Buy APPLE
Entry - 182.48
Stop - 180.05
Take - 188.29
Our Risk - 1%
Start protection of your profits from lower levels
❤️ Please, support our work with like & comment! ❤️

AAPL has settled into support and is good to go LONGAAPL is shown here on the 15-minute chart. The nuts and bolts of the idea are there as well.
AAPL is done with sideways action. Big players have accumulated their positions in small
parcels t not disturb the status quo. Apple no matter the headwinds nor the tailwinds
of other tech stocks in recent earnings is ready to fly some more on its own merits.
I will bite the apple now.

$AAPL watchlist idea NASDAQ:AAPL continues to hold strong at the 200ema but a break below $180 would be a good opportunity for a short entry. Alternativity is AAPL bounces once again from this level and breaks the yellow trendline the we can look to take a long position over $185.
Bottom Line:
Long over $185
Short under $180

APPLE Bullish Rebound Ahead! Buy!
Hello,Traders!
APPLE is already showing
Signs of growth right after
The stock market open
And as retested support
Of 179.90$ is strong
I think that we will see
A further move up
Buy!
Like, comment and subscribe to help us grow!
Check out other forecasts below too!

✅APPLE LONG FROM SUPPORT🚀
✅APPLE went down again
To retest the horizontal
Support level of 180$
But the level is strong
So we will be expecting
A local bullish rebound
Towards the target of 183.61$
LONG🚀
✅Like and subscribe to never miss a new idea!✅
