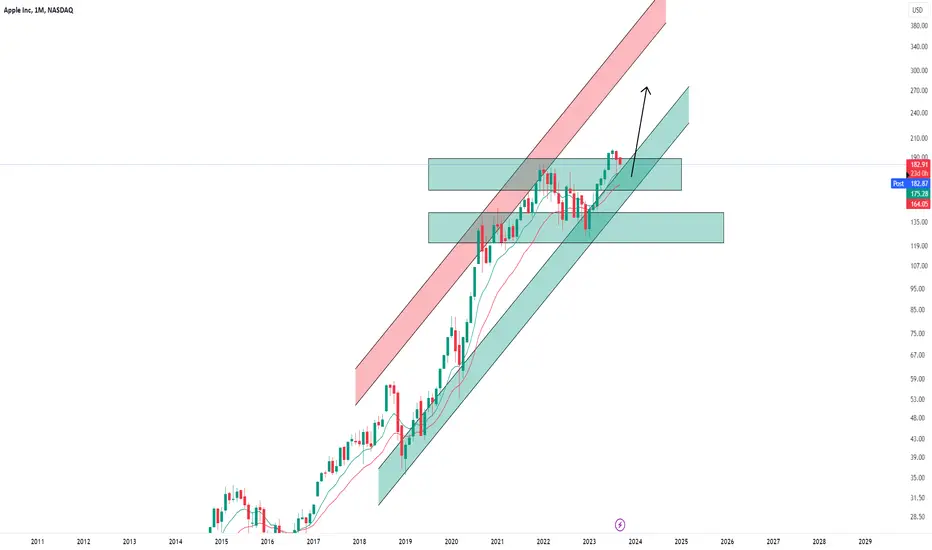
APPLE Local Bullish Bias! Buy!
Hello,Traders!
APPLE is likely to
Make a rebound from the
Support level it is retesting
At around 172.67$ towards
The local target above
At around the 179.5$ level
Buy!
Like, comment and subscribe to help us grow!
Check out other forecasts below too!
AAPL

AAPL, Since Bearish Declines, These Zones Are Important!Hello Traders Investors And Community,
Welcome to this analysis where we are looking at AAPL 4-hour timeframe perspective, the important events happened, the current situation in comparison with the stock-market, what we can anticipate next time and how to handle it appropriately. As the divergence between the real economy and stock market is still fairly high and retailers rushed into the market while smart money staying on the sideline we saw the heavy bearish declines not only in AAPL but also in other important stock values, as mentioned these breakdowns where expected sooner or later and the question now is if the market can recover directly or if more declines follow up with which is not seldom after such established bearish volatility, in this case, I detected the important levels and possible outcomes for the stock value AAPL and outcomes of it in destiny we should consider at the moment.
Looking at my chart you can watch there that the stock just broke below a major trendline marked in blue resulting of past price action, this trendline now confirmed to the downside signaling a strong bearish pace established here, since these breakdowns the stock found support at the 60-EMA marked in grey which is preliminary support that is leading to a marginal rally currently running into the massive resistance-cluster above. When the stock approaches the resistance marked in my chart there is a high possibility that the stock confirms it bearish to the downside till it has support found where it can build up on, when the 60-EMA confirmed to the downside the next important support is the second blue rising trendline, this is the crucial trendline in the structure because when it is broken to the downside the stock will heavily increase bearish selling pressure in the continuation zone marked in my chart.
Overall the stock has established a strong bearishness here where further declines are definitely in the possible spectrum, when the stock closes below the second blue trendline bearishly the 400-EMA marked in red in my chart can be expected to be reached, after that it has to be elevated if more declines will follow or a reversal is possible. The next times will show how the stock is proceeding here when the bearish continuations setting in this does not necessarily mean the stock is one-hundred percent bearish as the ongoing bullish moves were also strong, the stock has some solid fundamentals which cam through the corona increase with the digitalized impact so important for stocks these days and the stock has some solid supports below, however, the bearishness established here should not be ignored and we should be prepared on declines and increasing volatility to not get overwhelmed when it sets in.
In this manner, thank you for watching, support for more market insight, good weekend to you and all the best!
"There are many roads to prosperity, but one must be taken."
Information provided is only educational and should not be used to take action in the markets.

Apple (AAPL) -> The Company Of The FutureMy name is Philip, I am a German swing-trader with 4+ years of trading experience and I only trade stocks , crypto , options and indices 🖥️
I only focus on the higher timeframes because this allows me to massively capitalize on the major market swings and cycles without getting caught up in the short term noise.
This is how you build real long term wealth!
In today's anaylsis I want to take a look at the bigger picture on Apple.
Since the beginning of 2019 Apple stock has been trading in a solid rising channel and just recently rejected the support area at the $130 level.
Apple also perfectly broke above its previous all time high and is coming back for a retest after which I do expect another bullish rally to retest the channel resistance.
- - - - - - - - - - - - - - - - - - - -
I know that this is a quite simple trading approach but over the past 4 years I've realized that simplicity and consistency are much more important than any trading strategy.
Keep the long term vision🫡
AAPL is Bullish in Weekly(W) and H4Technical Analysis:
- Now Apple(AAPL) is doing a wave ((5)) in black
- H1 right side is up
- H4 right side is up and it has a bullish structure
Technical Information:
- As a position trader you should buy in wave (II) in blue
- As a swing trader you should buy in any pull back in H4
- When we'll have more data we can consider a buy in wave IV in red
- WARNING : Don't sell AAPL now


Assessing Apple's Future: Growth, Cash Flow, and ValuationAssessing Apple's Future: Growth, Cash Flow, and Valuation
Introduction
Apple Inc. stands as one of the world's premier businesses, offering investors a remarkable journey over the years. Its stock has outperformed the Nasdaq Composite index with a 46% gain in the past three years, despite its market capitalization remaining below the coveted $3 trillion threshold. As investors look ahead, they grapple with questions about Apple's future prospects. With Apple shares currently trading around $178, it's natural to ponder their potential value three years from now. To answer this, several significant trends must be taken into account.
Robust Revenue Growth
Apple's remarkable performance in the trailing 12 months, with revenue reaching a staggering $384 billion, highlights the company's enormous scale. However, it's essential to recognize that as a company of this magnitude, growth is likely to slow down as significant avenues for expansion become scarcer. Over the last three quarters, Apple experienced year-over-year declines in sales. Nevertheless, from fiscal 2017 to fiscal 2022, Apple achieved an impressive annualized revenue growth rate of 11.5%. This suggests that recent challenges may be more tied to macroeconomic factors than intrinsic issues within the company.
Tempering Expectations
Investors should exercise caution and temper their expectations. Wall Street analysts generally agree that Apple's future trajectory will involve smaller gains, with a projected compound annual revenue growth rate of 3.4% between fiscal 2022 and fiscal 2025. While potential growth may come from emerging markets like India, the United States remains a crucial pillar of Apple's success. Unless Apple introduces another groundbreaking product with significant market potential, its growth is likely to decelerate.
Cash-Generating Powerhouse
Despite its mature phase, Apple remains a cash-generating powerhouse. In fiscal year 2022, the company generated a staggering $111 billion in free cash flow, and for the first three quarters of fiscal year 2023, it produced $80 billion in free cash flow. Additionally, Apple has consistently returned substantial sums of cash to shareholders, including dividends and stock buybacks. Berkshire Hathaway's 6% stake in Apple serves as a source of passive income for Warren Buffett's firm, contributing to Berkshire's decision to retain its Apple holdings.
Valuation Considerations
Apple's remarkable 2023 performance has elevated its stock price, with a trailing price-to-earnings (P/E) ratio of 29.8. Historically, Apple's shares have traded at an average P/E multiple of 20.2 over the past decade, indicating that they are currently trading at a premium to their historical norm. The exact reason for this elevated valuation remains somewhat uncertain, but it could be attributed to investors perceiving Apple as a safe haven in uncertain times.
Looking Ahead
While betting against Apple is challenging, valuation remains a crucial factor. Over the next three years, there's a compelling argument that the stock may not outperform and could potentially underperform the broader market. As the market comes to terms with the fact that Apple's growth prospects are diminishing, the stock may experience a downward rerating. Nevertheless, Apple's financial strength, cash-generating capacity, and brand appeal will continue to make it a compelling investment for many, but prudent consideration of its valuation is essential.

Pt 2 Stock Market & 7 Mega Cap Tech Forecastsupport and resistance guide
DIS PYPL Stock Market & 7 Mega Cap Tech Forecast

Pt 1 Stock Market & 7 Mega Cap Tech Forecastsupport and resistance guide
DIS PYPL Stock Market & 7 Mega Cap Tech Forecast

✅ Daily Market Analysis - MONDAY SEPTEMBER 11, 2023Key events:
UK - BoE MPC Member Pill Speaks
USA - 3-Year Note Auction
Last Friday, the S&P 500 eked out a modest gain, albeit closing significantly below its session peak. Regrettably, all three of Wall Street's primary indices recorded weekly declines, as investors wrestled with worries about interest rates and anxiously anticipated forthcoming US inflation data.
S&P 500 daily chart
Investors have been increasingly alarmed by the sharp rise in oil prices, and their anxiety has grown even more pronounced in anticipation of the release of the Consumer Price Index (CPI) for August, slated for September 13. This report is eagerly awaited as it is anticipated to offer valuable insights into the potential steps that the Federal Reserve may take regarding interest rates.
United States Effective Federal Funds Rate
United States Consumer Price Index
Although yields on the benchmark US 10-year Treasury notes experienced a decline, the increase in US 2-year Treasury yields on Friday appeared to put pressure on the stock market.
US02Y treasury yield
US10T treasury yield
Apple Inc (NASDAQ: AAPL) seems to remain undeterred by concerns about declining demand in China, despite reports indicating that China has extended its ban on iPhones to encompass local government employees and state-owned enterprises.
This development follows recent news that Beijing had restricted the use of foreign devices, including iPhones, by central government workers due to national security concerns.
Apple stock daily chart
Nonetheless, some voices on Wall Street are arguing that the Apple share selloff triggered by these China-related concerns might be overblown. Wedbush, for example, commented that "Any China government agency iPhone ban is way overblown." They emphasized that the ban by a China government agency would only impact "less than 500,000 iPhones out of roughly 45 million" expected to be sold in China over the next year.
In the currency markets, the Japanese yen experienced a significant surge on Monday, driven by remarks from Bank of Japan (BOJ) Governor Kazuo Ueda that raised hopes of a departure from negative interest rates in Japan. This yen upswing contrasted with a weakening US dollar, influenced by the anticipation surrounding the upcoming US inflation data.
USD/JPY daily chart
The yen demonstrated impressive strength, surging over 1% to reach a one-week high of 145.99 per dollar following Ueda's remarks. He indicated that the Bank of Japan (BOJ) might contemplate ending its negative interest rate policy once it comes closer to achieving its 2% inflation target, potentially by the year's end.
In a similar vein, the euro also made gains, rising by 0.36% to $1.0738, marking the end of an eight-week losing streak. Conversely, the dollar index, which had enjoyed eight consecutive weeks of gains, retreated by 0.31% to 104.53.
EUR/USD daily chart
In European stock markets, there were cautious expectations of a modest opening gain. Investors were treading carefully as they awaited the European Central Bank's policy-setting meeting scheduled for later in the week.

Part 2 of 7 Megacap TECH stocks & Stock Market Forecastsupport & resistance guide: Megacap TECH stocks & Stock Market Forecast

Part 1of 7 Megacap TECH stocks & Stock Market Forecastsupport & resistance guide Megacap TECH stocks & Stock Market Forecast

AAPL Rounding Top - Monthly - BEARISH?AAPL forming a ROUNDING TOP on the MONTHLY chart? Could be a macro bearish reversal for this giant before it grows again?
Or will it simply fall to the 150 range and continue bouncing upwards on that yellow trendline?
I am BEARISH in the short to mid-term. The whole market will turn over giving the global macro conditions as well as piling national economic conditions.
AAPL has broken down below it's bullish trendline after an amazing 2023 run. It has bad sentiment right now and has also formed a DIAMOND REVERSAL PATTERN on it's DAILY / WEEKLY.
I think the whole market is in for a downtrend as we head into Q3 / Q4, and the downtrend begins with A for AAPL. It's what props the market up and it will be what drags it down as well
Let me know your thoughts

AAPL Hit as China Imposes iPhone Ban on State Entities
It has come to our attention that the Chinese government has recently banned iPhones from state companies and agencies, which could have significant repercussions for AAPL's market presence and sales in the region.
China has been a crucial market for Apple, contributing a substantial portion of its global revenue. If enforced strictly, this ban may result in a considerable decline in iPhone sales and subsequently impact AAPL's financial performance. As traders, we must stay informed about such market events and evaluate their potential implications on our investment strategies.
Considering the potential risks associated with this ban, I encourage you to exercise caution and consider pausing any further investments in AAPL until we have more clarity on the situation. Apple is expected to release its new iPhone soon, and it would be prudent to closely monitor the developments surrounding this ban before making any investment decisions.
It is worth noting that this is not the first time Apple has faced challenges in China. The company has previously encountered regulatory hurdles and intense regional competition, impacting its market share. However, Apple has demonstrated resilience and adaptability in the past, and it would be wise to await further updates on their response to this ban before taking any action.
As always, conducting thorough research and consulting with your financial advisor before making any investment decisions is crucial. Keeping a close eye on the news and market trends will help us navigate these uncertain times and make informed choices.
Please feel free to comment if you have any questions or concerns. Let's stay vigilant and make well-informed decisions as we approach the launch of the new iPhone.

✅ Daily Market Analysis - FRIDAY SEPTEMBER 08, 2023Key events:
Japan - GDP (QoQ) (Q2)
Canada - Employment Change (Aug)
Canada - Unemployment Rate (Aug)
On Thursday, the global stock markets faced widespread declines, with notable losses observed in the S&P 500 and Nasdaq indices. These drops were primarily attributed to the performance of Apple (NASDAQ: AAPL). Simultaneously, the US dollar strengthened following the release of US jobless claims data that fell short of expectations.
Remarkably, initial claims for state unemployment benefits decreased to 216,000 in the week ending on September 2nd, a drop from the revised figure of 229,000 from the previous week. These numbers marked the lowest weekly claims since February.
Furthermore, a separate report indicated that US worker productivity in the second quarter did not display the vigor initially reported.
Consistently, recent data bolsters the notion that the US economy continues to demonstrate resilience, potentially leading to an extended period of elevated US interest rates.
In a surprising turn of events, Apple witnessed a staggering loss of approximately $200 billion in market capitalization over a mere two days. This substantial decline was attributed to reports suggesting that China is imposing restrictions on the use of iPhones by state employees.
Apple stock daily chart
This setback had a cascading effect on the broader US technology sector, leading to a decline in its overall performance. At the same time, shares of numerous significant Apple suppliers located in Asia also witnessed declines during Friday's trading. It's worth noting that China represents a substantial market for Apple, accounting for nearly a fifth of the company's total revenue. Additionally, both Apple and its suppliers play a crucial role in providing employment to thousands of workers in the region.
This development comes just ahead of a highly anticipated Apple event scheduled for next week. During this event, the tech giant, valued at an impressive $2.78 trillion, is expected to unveil its new iPhone 15 lineup alongside innovative smartwatches.
In the broader market, the Dow Jones Industrial Average managed a modest gain of 57.54 points, equivalent to a 0.17% increase, reaching a level of 34,500.73. Conversely, the S&P 500 experienced a decline of 14.34 points, representing a 0.32% decrease, settling at 4,451.14. Meanwhile, the Nasdaq Composite registered a more substantial drop of 123.64 points, equivalent to a 0.89% decrease, concluding the day at 13,748.83.
NASDAQ Index daily chart
S&P500 Index daily chart
DJI Index daily chart
In addition to tracking market dynamics, investors also paid close attention to remarks from Federal Reserve Bank of New York President John Williams. He raised an intriguing question about whether monetary policy has reached a juncture where it could be considered adequately restrictive to bring about economic equilibrium.
A recent Reuters poll of forex strategists underlines that the strength of the dollar is expected to pose challenges for most major currencies as the year nears its end. The enduring appeal of the US currency has indeed presented hurdles for other currencies in the global marketplace.
US Dollar Currency Index daily chart
Throughout this week, the euro has witnessed a 0.5% decrease and has held steady at $1.0715 during the Asian trading session. Investors are presently evaluating the likelihood that the European Central Bank will opt for a status quo approach rather than moving forward with an interest rate hike in the upcoming week.
EUR/USD daily chart
On another front, the Japanese yen has descended to fresh lows, levels not witnessed in a span of ten months, with its current trading rate at 147.19 yen per dollar. The currency is inching ever closer to the critical 150 mark, a threshold where traders believe there's a substantial likelihood of government intervention to offer support and restore stability to the currency.
USD/JPY H12 chart

Part 2 of 7 Mega Cap Tech stocks | QQQ SPY Forecastsupport & resistance guide 7 Mega Cap Tech stocks | QQQ SPY Forecast

Part 1 of 7 Mega Cap Tech stocks | QQQ SPY Forecastsupport & resistance guide 7 Mega Cap Tech stocks | QQQ SPY Forecast

AAPL LONG with Midas signal reminder NASDAQ:AAPL
1. Clear all drawings and indicators.
2. Got a fibo 0.886 level, price reversed at here (React Don't Predict).
3. Add BandofMidas from indicators. Use Midas factor of 9.( suitable for this chart)
4. Price fall into Midas zone and reversed. Midas line still in pink. Double confirmed.
5. Plan your trade, risk reward ratio. GO Long.

✅ Daily Market Analysis - THURSDAY SEPTEMBER 07, 2023Key events:
USA - Initial Jobless Claims
USA - Crude Oil Inventories
On Wednesday, global stock indices experienced a downturn, while the benchmark US Treasury yield surged, and the US dollar reached its highest point in six months. This surge was driven by strong data from the US services sector, indicating that inflationary pressures continue to be a concern.
The impact of these developments was notably significant on Wall Street, where shares of tech behemoth Apple (NASDAQ: AAPL) took a hit, falling by 3.6%. The Wall Street Journal reported that China had issued a ban on officials working at central government agencies from using iPhones and other foreign-branded devices for official purposes.
Apple stock daily chart
The Institute for Supply Management (ISM) has reported an increase in its non-manufacturing Purchasing Managers' Index (PMI) for August. This uptick suggests that new orders are strengthening, and businesses are experiencing higher input costs. Some investors have taken this data as an indication that interest rates could remain elevated for an extended period. However, the general consensus is that the US Federal Reserve will maintain its current pause on rate hikes during its upcoming meeting later this month.
Adding to the discussion, Fed Bank of Boston President Susan Collins has stressed the importance of exercising caution in the central bank's future monetary policy decisions, despite signs of progress in controlling inflation.
These developments had repercussions in the stock market, with the Dow Jones Industrial Average experiencing a decline of 198.78 points, equivalent to 0.57%, closing at 34,443.19. Similarly, the S&P 500 saw a loss of 31.35 points, or 0.70%, finishing at 4,465.48, while the Nasdaq Composite dropped by 148.48 points, a 1.06% decrease, to conclude the day at 13,872.47.
NASDAQ Index daily chart
SPX Index daily chart
Today, European stock markets are poised to open with losses, driven by fresh signals of slowing growth in both Europe and China. Moreover, concerns about potential tightening measures by the Federal Reserve are further dampening market sentiment.
In Germany, DAX futures have declined by 0.3%, while CAC 40 futures in France have also slipped by 0.3%. Meanwhile, the FTSE 100 futures contract in the UK is down by 0.2%. Earlier economic data revealed a 0.8% month-on-month drop in German industrial production for July, surpassing expectations of a 0.5% decline. This latest data point adds to a string of reports indicating that the largest economy in the eurozone is facing significant challenges and might be at risk of slipping back into recession.
DAX index daily chart
CAC 40 index daily chart
FTSE 100 index daily chart
In addition to the European economic concerns, China's trade data for August painted a challenging picture. Exports in China dropped by 8.8% year-on-year, while imports fell by 7.3%. While these figures exceeded expectations, they highlight the continued strain on China's manufacturing sector, emphasizing the urgency for policymakers to focus on stimulating domestic demand to support economic growth. China's economic performance carries significant weight for Europe's largest companies, and its ongoing challenges have a ripple effect on their financial results.
Shifting our attention to the Bank of Canada (BoC), the central bank recently made a decision in line with expectations by keeping its policy rates unchanged during its interim meeting. While the BoC did acknowledge a reduction in excess demand, it left the door open for potential future rate hikes. The central bank expressed concerns about the persistent pressure on underlying inflation. In summary, the BoC's communication leaned towards a more hawkish stance, pointing out the absence of recent downward momentum in underlying inflation and emphasizing the risk that elevated inflation could become entrenched.
XAU/USD H8 chart
On Thursday, gold prices held steady, although they faced some downward pressure due to the strength of the US dollar and Treasury yields.
The dollar index reached a fresh six-month high, touching 105.03, and was last seen trading at 104.85, reflecting a 0.1% increase. Meanwhile, the euro experienced slight gains, edging up by 0.03% to reach $1.0723.
DXY H8 chart
In contrast, oil prices took a different turn, reversing their earlier declines and ending the day with gains. This shift was primarily fueled by trader expectations of forthcoming reductions in US crude oil inventory.
Brent crude futures settled at $90.60 per barrel, registering a rise of 56 cents, while US crude futures closed at $87.54, marking an increase of 85 cents.
Looking ahead, one of the most significant data releases for today is the euro area wage figures, particularly compensation per employee for the second quarter of 2023. This specific wage measure is closely monitored by the European Central Bank (ECB), and its release holds substantial importance as it serves as the final significant data point before the upcoming ECB monetary policy meeting scheduled for next Thursday.

Apple in Trouble: Shares Fall More Than 3.5% As a result of yesterday's trading, AAPL shares fell more than 3.5%.
The reason is in the news that came from China:
→ According to the WSJ, Chinese central government officials have been ordered not to use iPhones or bring them to the office. Apple's business is very vulnerable to tensions between China and the US, as most of the US company's products are made in China.
→ Chinese Huawei has developed a new high-speed phone that can become a serious competitor to the iPhone. The first batch of the phone, the Mate 60 Pro, priced at USD 960 on a limited pre-order basis, sold out in a matter of hours, causing a sensation on Chinese social media.
With the SHS pattern in the background, AAPL shares are technically weak:
→ the price has tested the bearish gap formed at the beginning of August;
→ USD 188/share AAPL, which acted as support in July, now appears to be resisting;
→ after the August reversal from the lower border of the channel (shown in blue), the bulls failed to return to the upper half of the channel.
Bulls can oppose a serious argument — the price is in an upward channel. And AAPL is one of the leaders in the NASDAQ Technology Index, which is rising on the AI-related boom.
However, AAPL's share price continued to decline in premarket trading, dropping below the USD 180 level, and thus threatening a bearish breakdown of the rising channel in 2023. The nearest support is the level of 176.50, where earlier the price slowed down the fall or turned up.
This article represents the opinion of the Companies operating under the FXOpen brand only. It is not to be construed as an offer, solicitation, or recommendation with respect to products and services provided by the Companies operating under the FXOpen brand, nor is it to be considered financial advice.

Apple Moving Lower for LongerAPPL (1D) - Quick Analysis
Price Chart
Apple's price action has filled it's August gap (White Dotted) and turned lower pushing past the 12, 26, and 50-day EMA's in one swoop. Both RSI and OBV have created trend lines (Yellow Solid) that the indicators look to be respecting with failed retest; as RSI is on the verge of pushing below the 50 level.
What Seems Legit?
This bad boy finally cooling off. It's up 60% YTD. First retest it's 200-day EMA then retest it's major trend line and some good chaos in-between.
Check us out on Twitter for charts not posted here, memes, and news that that doesn't make the news
Chart Key
Yellow Solid = Trend Line
White Dotted = Gap Fill
Green Boxes = Supports / Target Areas

part 2 Stock Market QQQ SPY 7 MEGA cap Tech Forecastsupport and resistance guide Stock Market QQQ SPY 7 MEGA cap Tech Forecast

part 1 Stock Market QQQ SPY 7 MEGA cap Tech Forecastsupport and resistance guide part 2 Stock Market QQQ SPY 7 MEGA cap Tech Forecast
