APPLEAs the chart said, after touching the tough resistant zone we can see low volume around it and I don't think resistant zone be broken.
I assure you we have a tough divergence in this chart.
AAPL
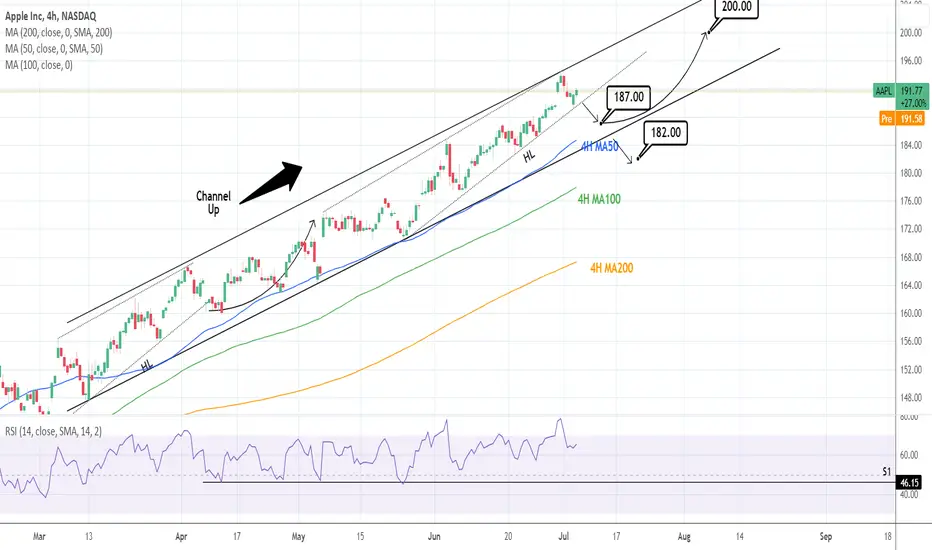
AAPLE: Buy after this minor pull back.Apple is trading inside a four month Channel Up on an almost overbought 1D time frame (RSI = 69.133, MACD = 4.100, ADX = 62.578) supported on the short term by an HL trendline. We expect a pull back near the 4H MA50, which has been the most optimal buy during this Channel Up period, ideally with the 4H RSI near its S1.
We will buy and target the upper band of the Channel (TP = 200.00). A crossing under the Channel Down would be bearish and will force us to close the buy in loss and sell instead to the 4H MA100 (TP = 182.00).
## If you like our free content follow our profile to get more daily ideas. ##
## Comments and likes are greatly appreciated. ##
Part 3 of 7 Mega Tech & QQQ Sp500 Stocks | Key BATTLE zone- QQQ did not set a new high after this move which is the first time in a while so theres a chance for bears to set a daily lower low but they need to show up fast or we are likely heading back to 52 week highs
- Team Clear Bull: TSLA AAPL MSFT
- Team Middle META AMZN
- Team indecision: NVDA GOOGL
- no Team Bear until i see some notable downtrends confirming on these big tech stocks

Part 2 of 7 Mega Tech & QQQ Sp500 Stocks | Key BATTLE zone- QQQ did not set a new high after this move which is the first time in a while so theres a chance for bears to set a daily lower low but they need to show up fast or we are likely heading back to 52 week highs
- Team Clear Bull: TSLA AAPL MSFT
- Team Middle META AMZN
- Team indecision: NVDA GOOGL
- no Team Bear until i see some notable downtrends confirming on these big tech stocks

Part 1 of 7 Mega Tech & QQQ Sp500 Stocks | Key BATTLE zone- QQQ did not set a new high after this move which is the first time in a while so theres a chance for bears to set a daily lower low but they need to show up fast or we are likely heading back to 52 week highs
- Team Clear Bull: TSLA AAPL MSFT
- Team Middle META AMZN
- Team indecision: NVDA GOOGL
- no Team Bear until i see some notable downtrends confirming on these big tech stocks

Buffett's Love for Apple Shares: Discover the Secret SuccessI wanted to share an exciting story that's been making waves in the investment community and will surely bring a smile to your face. It's all about the legendary Warren Buffett and his deep affection for Apple shares. So, please grab a cup of coffee, sit back, and let's dive into the world of Apple and its incredible potential!
Warren Buffett, often called the "Oracle of Omaha," has long been recognized for his impeccable investment acumen. He has built an empire of wealth through a disciplined and patient approach to investing. And guess what? Apple Inc. has become one of his favorite long-term investment choices!
Why does Warren Buffett love his Apple shares so much, you ask? Well, let me unveil the secret. Apple is not just any ordinary company; it's a global tech powerhouse that has consistently demonstrated its ability to innovate, adapt, and dominate the market. From the revolutionary iPhone to the game-changing Apple Watch and the recent introduction of Apple Silicon, their M chips, Apple continues to redefine technology and consumer experiences.
But it doesn't stop there! Apple's financial performance is equally impressive. Apple has consistently outperformed market expectations with a strong track record of revenue growth, healthy profit margins, and a robust ecosystem of products and services. This stability, combined with their unwavering commitment to customer satisfaction, has solidified Apple's position as a trusted brand worldwide.
Now, here's where it gets even more exciting. Warren Buffett's love for Apple shares is not just a personal preference; it's a testament to the company's long-term potential. As an investor, you can follow in his footsteps and consider Apple a safe long-term investment for your portfolio.
So, my dear fellow investors, I encourage you to take a moment to consider Apple as a potential addition to your investment strategy. With its strong financials, innovative products, and unwavering customer loyalty, Apple has all the ingredients for long-term success. By investing in Apple, you can align yourself with one of the world's most respected investors and tap into this tech giant's immense growth potential.
Successful investing requires patience, research, and a keen eye for opportunities. Apple's track record and Warren Buffett's endorsement make it a compelling choice for those seeking stability and growth in their investment portfolios.
Suppose you're ready to take the next step and explore Apple as a potential investment opportunity. In that case, I encourage you to contact your financial advisor or research to evaluate its suitability for your investment goals.

Look back to the past | At least 130% every impulse waveMonthly Chart:
Apple ( NASDAQ:AAPL ) is trading around $191 now.
When I look back to the past over 10 years from 2012 - 2022, I figured out AAPL always increased over 130% from bottom of the previous pullback. You can see that on the chart
And now, I expect NASDAQ:AAPL can go up at least 130% after down ~32.5% from previous ATH ($182.94)
If it come be true, APPL costs $286 in next 2 years and half.
Wait and see what happen
P/S: I'm a iFan

PT 1 of 7 mega tech stocks | QQQ sp500 analysisGOOGL back to team bull. Every mega tech is back to team bull expect NVDA formed an hourly downtrend and AMZN still chopping around

Pt 2 7 Mega Tech stock | QQQ Sp500 AnalysisGOOGL back to team bull. Every mega tech is back to team bull expect NVDA formed an hourly downtrend and AMZN still chopping around

APPLE Good short term sellApple reached the top of the 4 month Channel Up and got rejected.
That is a Higher High rejection and inside this pattern, the minimum decline during such rejections has been -3.25%.
As a result this is still a good short opportunity. A -3.25% decline gives a target of 188.50.
By that time, the 4hour MA50 may come to support again.
If that's inside the RSI's Support Zone, then all the better.
Follow us, like the idea and leave a comment below!!

Will Apple Continue To Rise? 🍎Stock: Apple (AAPL)
Time Frame: Weekly Chart
Direction: long
Comment:
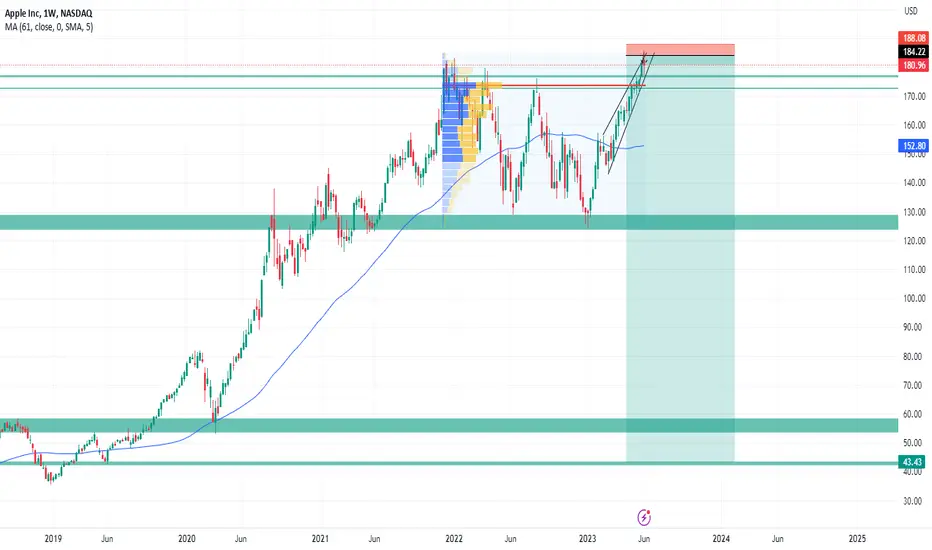
At the end of last week, Apple reached new all-time highs. In this analysis, I will focus on the weekly chart to show you where I believe Apple is heading. It is evident that Apple successfully broke out of a clearly visible triangle pattern and subsequently experienced a bullish rally of approximately 30 %. This surpassed all previous resistances. Previous supports have now become relatively strong supports, especially around the $170 price level. 📈
I now expect a short-term correction followed by a continuation of the uptrend. Considering the Fibonacci levels, we can see that the 0.382 level precisely corresponds to the previous significant resistance, which has now become a support. I anticipate a correction to this level ($175-180) and then further upward growth. Furthermore, the weekly timeframe indicates that Apple is not slowing down. The chart shows a near absence of red candles, meaning that buyers have complete control over the overall bull market. 💹
------------------------------------------------------------------------------------------------------------------------------------------------
Market capitalization since 2018
In 2018, Apple became the first American company to exceed a market capitalization of 1 trillion dollars. This milestone was achieved due to the success of the iPhone and other company products. Apple also leverages its ecosystem and services, such as the App Store and iCloud, which contribute to its market value. 💰
In 2023, Apple surpassed another significant milestone and became the first company with a market capitalization exceeding 3 trillion dollars. This success reflects the ongoing popularity of Apple's stocks and the trust investors have in its portfolio of products and services. Apple continues to pursue its innovative approach and expands its portfolio with new technologies and markets, helping it maintain its position as one of the world's leading technology companies. 🚀
------------------------------------------------------------------------------------------------------------------------------------------------
Remember, this contribution serves as an informative analysis and should not be construed as financial advice. Stay informed, stay connected, and happy investing! 🌟📈
------------------------------------------------------------------------------------------------------------------------------------------------
💼💰❤️ Trade like a pro, laugh all the way to the bank! Like and subscribe for more money-making !" 💼💰❤️

Pt2 Bull Break Lack follow through? | 7 Mega Tech Trend Analysis- Tesla stock 1 trillion mark $315
- NVDA AAPL MSFT TSLA stock team bull
- AMZN META team middle / bull
- GOOGL team bear

Apple's Dominance in Consumer Tech: Insights for Smart InvestorsSmart investors are well aware of three key aspects concerning Apple, the tech giant that consistently captures Wall Street's attention. With a market cap of $2.9 trillion, Apple stands as the world's most valuable company, dominating headlines in 2023. Notable developments include plans to shift manufacturing away from China, the introduction of a groundbreaking virtual/augmented reality (VR/AR) headset, and venturing into fintech by launching a savings account.
The start of 2023 witnessed an impressive surge of around 50% in Apple shares. This remarkable growth, coupled with the company's reputation for consistent expansion, has captivated investors, fueling anticipation as its market cap approaches the extraordinary $3 trillion mark. Given its robust long-term prospects, gaining a deeper understanding of Apple and considering investment opportunities is a prudent move for investors.
Outlined below are three crucial insights that intelligent investors possess regarding Apple.
Apple Reigns Supreme in the World of Consumer Tech
Apple has established itself as the undisputed king of consumer tech with unparalleled brand loyalty. Since the debut of the first-generation iPhone in 2007, the company has consistently achieved remarkable growth. In fiscal 2022, revenue from its smartphone segment witnessed a solid 7% year-over-year increase. Apple's ability to maintain strong consumer demand, even during challenging economic conditions, sets it apart.
In 2022, the entire tech market faced macroeconomic headwinds, leading to a slump in growth. Competitors like Samsung and Xiaomi experienced substantial declines in smartphone shipments, with drops of 19% and 24%, respectively, in the first quarter of 2023. However, during the same period, Apple's iPhone segment reported a noteworthy 2% rise in revenue, demonstrating the resilience of its business.
The widespread popularity of the iPhone has become a significant advantage for Apple when promoting its other products and services. The seamless connectivity among Apple devices has facilitated the company's dominance in market shares for tablets, smartwatches, and headphones. Additionally, its digital services such as Apple TV+, Music, Fitness+, and more have emerged as the second-highest-earning segment for the company.
Considering Apple's track record of success when venturing into new product categories, the recently unveiled Vision Pro headset, combining virtual reality (VR) and augmented reality (AR), holds promising long-term potential. Investing in this tech giant could mean investing in the future leader of the rapidly expanding $31 billion market.
Apple Quietly Embraces AI Advancements
While tech giants like Microsoft, Alphabet, and Advanced Micro Devices heavily emphasize "artificial intelligence" (AI) during their earnings calls, Apple has taken a different approach. Rather than explicitly labeling its technologies as AI, the company focuses on highlighting the new features it develops using AI models and machine learning.
This strategic move to avoid direct AI references serves Apple well, setting it apart from other companies in the industry. By sidestepping direct comparisons, Apple mitigates potential stock volatility while effectively integrating AI technology into its products.
During its Worldwide Developers Conference on June 5, Apple unveiled various AI-driven features across its product lineup. For instance, the iPhone's autocorrect functionality now utilizes a model similar to ChatGPT, learning from user text and typing patterns. Additionally, AirPods Pro can automatically disable noise cancellation when the wearer engages in conversation.
As a prominent player in the consumer tech sector, Apple's ability to manufacture devices that bring AI into the hands of the public positions it as a significant contributor to the sector's development.
Apple's Stock Valuation Slightly Pricey
Apple's stock has experienced a bullish run this year, driven in part by the anticipation of reaching a $3 trillion market cap. However, the rally seems disconnected from the company's recent financial performance, as it reported revenue declines for two consecutive quarters: a 5.5% decrease in the first quarter and a 2.5% decrease in the second.
Consequently, Apple's price-to-earnings ratio (P/E) has surged by 54% since the beginning of the year and currently stands at 33. Typically, a P/E ratio below 20 is considered favorable, implying a good value proposition. Hence, Apple's stock is slightly expensive at its current price point.
Nevertheless, it's worth noting that Apple's shares remain comparatively cheaper than many of its peers. Among the "Big Five" tech companies, only Alphabet boasts a better P/E ratio than Apple, according to the chart.
While a recent rally may have impacted the value of Apple's stock, it's important to consider the long-term perspective. Over the past five years, the company's shares have witnessed an astonishing surge of approximately 320%. This impressive growth demonstrates the potential for substantial returns on investment over an extended period.
Furthermore, Apple's expanding presence in emerging fields like AI and VR/AR positions the company for continued success. With a strategic focus on these technologies, Apple is likely to maintain its current trajectory of growth and innovation. By holding onto Apple stock for the long term, investors stand to benefit from the company's ongoing advancements and their potential impact on the market.

Daily Market Analysis - MONDAY JULY 03, 2023Key News:
USA - Independence Day - Early close at 13:00
UK - Manufacturing PMI (Jun)
USA - ISM Manufacturing PMI (Jun)
Friday marked a momentous day on Wall Street as the three major indices experienced a robust surge, igniting a wave of optimism among investors. Notably, the Nasdaq, renowned for its focus on technology stocks, achieved an extraordinary feat by posting its largest first-half gain in the past 40 years. This remarkable milestone underscored the resiliency and strength of the technology sector, which has been a driving force behind the market's upward trajectory.
Adding to the positive sentiment was the phenomenal achievement of tech giant Apple, as it soared to a market valuation of $3 trillion. This significant milestone was a testament to the company's enduring appeal and relentless pursuit of innovation. Not since January 2022 had Apple reached such heights, and this remarkable accomplishment further solidified its position as one of the most influential and valuable companies in the world.
Apple's stock performance on Friday was nothing short of impressive. Closing at $193.97, it recorded a notable increase of 2.3%, with the stock even reaching a new all-time high of $194.48. This surge in Apple's stock price was fueled by a combination of factors, including the growing investor enthusiasm for growth stocks and the unwavering confidence in Apple's ability to conquer new markets.
Investors' renewed faith in growth stocks, particularly in the technology sector, has been a driving force behind the recent market surge. The allure of exponential growth potential and groundbreaking innovations has captivated market participants, leading to increased allocations in companies like Apple. Moreover, Apple's unwavering commitment to excellence and its track record of success have bolstered investor confidence, making it an attractive choice for many.
Apple's ability to penetrate and thrive in new markets has further fueled investor optimism. The company's forays into various sectors, such as healthcare, augmented reality, and autonomous vehicles, have been met with great anticipation. Investors believe that Apple's strong brand, vast resources, and exceptional product ecosystem position it favorably to succeed in these emerging industries. This confidence in Apple's long-term prospects has propelled its stock to new heights.
As the market continues to evolve and navigate through various challenges, the impressive performance of the Nasdaq and Apple serves as a beacon of hope and optimism. Their achievements not only symbolize the resilience of the technology sector but also provide a glimmer of possibility for future growth and innovation. Investors are closely watching these developments, eager to capitalize on the momentum and potential opportunities that lie ahead in the ever-evolving world of technology.
Apple stock daily chart
On the last day of the second quarter, investors displayed a heightened level of interest, primarily influenced by the Federal Reserve's closely observed indicators, which pointed to a moderation in US inflation. According to a report released by the Commerce Department, the Personal Consumption Expenditures (PCE) index showed a 3.8% increase, lower than the 4.3% figure recorded in April. When excluding the volatile prices of food and energy, the core PCE index saw a growth of 0.3%, slightly lower than the previous month's 0.4% rise.
BEA, US Personal Consumption Expenditures (PCE) index
The release of this data has instilled optimism among investors, raising the possibility that the Federal Reserve's cycle of raising interest rates could be approaching its conclusion. The decrease in Treasury yields, which was triggered by the alleviation of inflationary pressures, has played a role in fostering this positive market sentiment. Burns McKinney, a portfolio manager at NFJ Investment Group in Dallas, Texas, emphasized the impact of declining yields on the overall market conditions.
In terms of performance, the Nasdaq index delivered its strongest first-half showing in four decades, delivering a remarkable gain of over 31%. Notably, the Nasdaq 100 index, comprising prominent technology stocks, achieved its highest first-half gain on record, surging by approximately 39%.
On Friday, the S&P 500's growth index experienced a rise of 1.4%. Alongside Apple, other popular stocks favored by investors, including Microsoft, Nvidia, Amazon, and Meta Platforms, significantly contributed to the positive performance of the S&P 500. These stocks registered gains ranging from 1.6% to 3.6%, capitalizing on their impressive rallies propelled by strong earnings and the increasing interest in artificial intelligence.
S&P 500 indice daily chart
NASDAQ indice daily chart
As we embark on the first full week of July, there are several noteworthy events lined up on the economic calendar.
One such event is the Reserve Bank of Australia (RBA) rate decision, scheduled for Tuesday at 5:30 am GMT+1. This decision holds significant interest as market participants eagerly await to see whether the central bank will increase its Official Cash Rate (OCR) by 25 basis points (bp) to 4.35% or maintain the status quo. The RBA's rate decisions have been closely monitored, particularly due to the surprise 25bp rate hikes in the previous two meetings.
The most recent monthly Consumer Price Index (CPI) data revealed a 5.6% increase in the twelve months leading up to May. Although this figure is lower than April's 6.8% and market expectations of 6.1%, it still plays a role in shaping the RBA's decision-making process. Additionally, strong employment data and uncertainties surrounding China's economic recovery have contributed to a 63% probability of the RBA keeping rates unchanged this week.
Market participants will be closely watching the outcome of the RBA rate decision as it has the potential to impact not only the Australian economy but also global market sentiments.
Australia interest rate
In the United States, the upcoming releases of the ISM Manufacturing and Services Purchasing Managers' Index (PMI) will draw considerable attention. The Services PMI has been indicating contractionary conditions for several months, and the release scheduled for Monday at 3:00 pm GMT+1 is expected to continue this trend. Forecasts suggest a range between 48.3 and 46.7 for the Services PMI.
On Thursday at 3:00 pm GMT+1, the ISM Services PMI will be released, which has remained in expansionary territory but experienced a decline from 51.9 in April to 50.3 in May. The median expectation for June's release is 51.0. It is worth noting that the past three months have exhibited a range between 52.0 and 50.0 in the Services PMI readings.
These PMI releases provide valuable insights into the health of the manufacturing and services sectors in the US. Market participants will be closely monitoring these indicators as they can influence market sentiment and provide indications of economic trends and business activity levels.
US ISM Purchasing Managers Index (PMI)
One of the most highly anticipated data releases in the United States this week will be related to the labor market indicators. On a day preceding the non-farm payroll report for June, both the ADP non-farm employment change and JOLTS job openings data will be published at 1:30 pm GMT+1.
Market participants will closely watch these indicators as they provide crucial insights into the state of the labor market. They serve as important precursors to the official non-farm payroll report, which is scheduled for release on Friday. The median consensus among analysts is for an addition of 225,000 new payrolls in June, which marks a decrease from the robust figure of 339,000 recorded in May.
In addition, the unemployment rate is expected to remain unchanged at 3.7%, while average hourly earnings are projected to match the previous month's value of 0.3%. It is worth noting that a strong jobs report for June would increase the likelihood of a rate hike later in the month.
These labor market indicators are closely monitored as they provide valuable insights into the overall health of the US economy, the pace of job creation, and potential wage growth. The data can significantly impact market sentiment and influence monetary policy decisions.
US Unemployment rate
In its June meeting, the Federal Open Market Committee (FOMC) decided to maintain the Federal Funds target rate at its existing level. However, the committee signaled a hawkish stance, indicating a potentially more aggressive approach to monetary policy. This was reflected in the FOMC's dot plot, which outlines individual policymakers' projections for interest rates.
Based on the dot plot from May, the FOMC projected two additional rate increases by the end of 2023. This suggests a tightening monetary policy in the near future. Market participants have taken note of this guidance, and as of now, they are pricing in an 80% probability of a 25 basis point hike at the next FOMC meeting scheduled for July 26.
Following the anticipated rate hike in July, there is speculation that the FOMC may pause its tightening cycle and potentially even consider rate cuts in 2024. However, it's important to note that market expectations and projections can change based on incoming economic data and the evolving policy stance of the Federal Reserve.
These market expectations regarding future rate movements are crucial for investors and can significantly impact various asset classes and market sentiment. Traders and market participants closely monitor such probabilities and projections to make informed decisions and position themselves accordingly in the financial markets.

🍏 Apple (AAPL): unfolding the bullish triangle●● Preferred count
● NASDAQ:AAPL , 🕐TF: 2W
Fig.1
The wave count on the weekly interval has not changed. More than a year ago, we were waiting for the beginning of a sideways correction in wave ((iv)) of 3 , and, as the analysis of younger time periods shows, it has begun.
__________________________
● NASDAQ:AAPL , 🕐TF: 2D
Fig.2
At the moment, the triangle (a)-(b)-(c)-(d)-(e) is predicted as the most frequent pattern that appears in the position of the fourth wave of the impulse . Moreover, the alternation rule requires the appearance of a sideways correction.
__________________________
● NASDAQ:AAPL , 🕐TF: 12h
Fig.3
At the end of the triangle, a long trading setup will open.
__________________________
__________________________
●● Alternative count
● NASDAQ:AAPL , 🕐TF: 1W
Fig.4
Globally alternative markup does not require revision either. The only clarification is the following: development of the ending diagonal in the wave (5) of ③ is probable.
______________________________________________
📚 Elliott Wave Guide & Ellott Wave Archive ⬇️⬇️⬇️⬇️

Apple -> New All-Time-HighHello Traders and Investors ,
my name is Philip and today I will provide a free and educational multi-timeframe technical analysis of Apple 💪
Starting on the monthly timeframe you can see that after Apple broke out of the clear triangle formation in confluence with the bullish moving averages, Apple created a strong rally of 30% towards the upside, breaking major resistance.
The weekly timeframe is also showing that Apple is not slowing down at all, there are barely any red candles which means that buyers are 100% in control of the overall bullish market.
And after Apple gapped higher on Friday, the daily timeframe is certainly ready for a short term technical pullback to fill the gap, but then there is definitely a higher chance that the next move on Apple stock will be again towards the upside.
Keep in mind: Don't get caught up in short term moves and always look at the long term picture; building wealth is a marathon and not a quick sprint 📈
Thank you for watching and I will see you tomorrow!
My previous analysis of this asset:

TSLA going back to 1 Trillion? | 7 Big Tech updates- TSLA 1 trillion mark 315 i took the wrong market cap it was 829 instead of 892. Its 20% away from the current price at 315 resistance
- NVDA TSLA AAPL MSFT team bull
- AMZN META team middle / bull
- GOOGL team bear

AAPL Upward Channel OverextensionAAPL has been leading the market over the past couple of months after running more than 55% from its recent bottom and hitting that mythic $3 trillion dollar market cap.
For the past two months AAPL has been trading within a clear upward channel clearly respecting the top and bottom of the trend. AAPL has been making a series of higher lows and higher highs while making slight pullbacks to key demand levels.
Last week AAPL finally broke up from the wedge pattern on the hourly to finally head up to test the top of the channel trend again. After the gap up and run last week AAPL is starting to look overextended on the hourly while we are also spotting a possible bearish divergence in the RSI forming.
Careful going long on AAPL as so far it is being rejected at this supply zone and we have picked up bearish activity betting on a pullback to $191.50. Risk/reward doesn't favor going long as it is overextended even from EMAs.
Bulls are looking for a break above the channel or $195, target $196.33 or our 0.619 fib extension. Bears are happy as long as AAPL doesn't break above the supply zone and remains below $195.

Part 3 | All 7 Big Tech | QQQ Sp500 Price level Trend Guide- QQQ still doesnt have a hourly downtrend confirming so daily lower high is not set.
- SPY weekly bullflag confirm, so far no follow through yet but we ran out of time so it doesnt count as a rejection for me until i see hourly downtrend
- TSLA potentially shaping up an equilibrium
- NVDA bull break above 420 back into its all time highs sideways chop zone
- AMZN fifth rejection from its 131 chop zone still above support though
- GOOGL still the weakest only tech in a daily downtrend
- MSFT went form daily downtrend to uptrend today
- META same as AMZN in a chop zone rejection 5th time from its resistance.

Part 2 | All 7 Big Tech | QQQ Sp500 Price level Trend Guide- QQQ still doesnt have a hourly downtrend confirming so daily lower high is not set.
- SPY weekly bullflag confirm, so far no follow through yet but we ran out of time so it doesnt count as a rejection for me until i see hourly downtrend
- TSLA potentially shaping up an equilibrium
- NVDA bull break above 420 back into its all time highs sideways chop zone
- AMZN fifth rejection from its 131 chop zone still above support though
- GOOGL still the weakest only tech in a daily downtrend
- MSFT went form daily downtrend to uptrend today
- META same as AMZN in a chop zone rejection 5th time from its resistance.

Part 1 | All 7 Big Tech | QQQ Sp500 Price level Trend Guide- QQQ still doesnt have a hourly downtrend confirming so daily lower high is not set.
- SPY weekly bullflag confirm, so far no follow through yet but we ran out of time so it doesnt count as a rejection for me until i see hourly downtrend
- TSLA potentially shaping up an equilibrium
- NVDA bull break above 420 back into its all time highs sideways chop zone
- AMZN fifth rejection from its 131 chop zone still above support though
- GOOGL still the weakest only tech in a daily downtrend
- MSFT went form daily downtrend to uptrend today
- META same as AMZN in a chop zone rejection 5th time from its resistance.

Celebrating Apple's Historic Milestone: Market Cap Hits $3 Trill
Apple Inc. has achieved an extraordinary milestone - our market capitalization has soared to an unprecedented $3 trillion! 🎉🍏
As you may know, Apple's journey to success has been nothing short of remarkable. From the launch of the iconic iPhone that revolutionized the smartphone industry to the introduction of groundbreaking services like Apple Music, Apple Pay, and Apple Fitness+, they have consistently pushed the boundaries of what technology can do, enriching the lives of millions worldwide.
This significant milestone highlights Apple's strength and presents a remarkable opportunity to consider further investing in Apple stock.
Here's why we believe Apple continues to be an excellent investment opportunity:
1. Continued Innovation: Apple's commitment to innovation remains at the core of its DNA. With upcoming products and services in the pipeline, they are poised to redefine numerous industries and create new growth opportunities.
2. Strong Financial Performance: Apple has a consistent track record of delivering strong financial results and a robust balance sheet provides a solid foundation for long-term growth and stability.
3. Expanding Ecosystem: Apple's ecosystem, encompassing hardware, software, and services, creates a seamless user experience that fosters customer loyalty and drives revenue across various verticals.
Consulting with your financial advisor to evaluate your investment strategy and make informed decisions is recommended as always.

S&P 500 Favors Breakout. Bears and Recessionists = MisanthropesThe bears enjoyed their cycle to the maximum, peak fear is behind us.
Observe your favorite pundits to determine if they have shifted their perception yet. Many have not, Many remain Bearish and are greedily awaiting one more Deep Indiscriminate Sell Off.... they will likely wait forever.
The first rule of any technology used in a business is that automation applied to an efficient operation will magnify the efficiency. The second is that automation applied to an inefficient operation will magnify the inefficiency.
Long SPX = Long Human Innovation and Business Ingenuity!
