Apple (AAPL) share price slips towards psychological $200 levelApple (AAPL) share price slips towards psychological $200 level
Yesterday, Apple shares (AAPL) fell by 2.5%, edging closer to the key psychological threshold of $200. Moreover, the stock is underperforming the broader market, which reached new highs earlier this week — a move AAPL has yet to replicate.
Why is AAPL’s stock price declining?
According to media reports, investors may have grown concerned after OpenAI acquired a startup founded by Jony Ive, Apple’s former chief designer, for $6.5 billion.
The move is being interpreted as OpenAI’s first step toward launching a physical AI-powered device — one that could, eventually, pose a challenge to Apple’s hardware, even if not in the near term.
Technical analysis of the AAPL chart
Bulls may be hoping the AAPL price finds support at the confluence of two key levels:
→ the psychological $200 mark;
→ support from the second half of May (the lower blue trendline).
However, the broader technical context raises some bearish concerns:
→ the $215–222 zone, which previously acted as support, is now capping price advances (as highlighted by the arrows);
→ the red descending channel appears to define the current trend trajectory — and its relevance may be reinforced if the price drops and consolidates near its median line, signalling a balance between buying and selling pressure.
This article represents the opinion of the Companies operating under the FXOpen brand only. It is not to be construed as an offer, solicitation, or recommendation with respect to products and services provided by the Companies operating under the FXOpen brand, nor is it to be considered financial advice.
AAPL

AAPL Opportunity Behind the Noise🍏Apple’s trading around $205, and while it’s not at bargain basement levels, there’s real opportunity if you look beyond the headlines.
📰 What’s going on?
Trump’s back in the news pushing for Apple to shift iPhone production back to the U.S. and markets don’t like it. But here’s the thing: Apple’s already working on reducing China risk by moving production to India and ramping up AI features. The long-term vision? Still solid.
📊 The setup I’m watching:
Entry levels:
🔹 $194 – Light buy
🔹 $180 – Add with confidence
🔹 $166 – Back up the truck?
Targets:
🎯 $209 – Easy bounce
🎯 $230 – Mid-term strength
🎯 $260+ – Full recovery mode
💡 Why I like this play:
Apple isn’t just a phone company. It’s a cash-flow machine sitting on mountains of capital, pushing hard into AI, and building a services empire. Tariff talk can shake the chart, but that’s often when smart entries happen.
⚠️ Disclaimer: This is not financial advice—just sharing my personal trade plan. Do your own research and always protect your capital.
If you're waiting for the "perfect" moment, you might just miss the move. Stay alert. 📈💬

Vanguard Mega Cap Growth ETF (MGK): FAQ guide before investing🚀 Vanguard Mega Cap Growth ETF (MGK): A Deep Dive into Holdings and Hypothetical Returns
🌟 The Vanguard Mega Cap Growth ETF (MGK) is a popular exchange-traded fund offering investors access to some of the largest and most dynamic growth-oriented companies in the U.S. market. MGK closely tracks the CRSP US Mega Cap Growth Index, emphasizing mega-cap stocks.
🎯 Key Features of MGK
💰 Expense Ratio: 0.07%, a cost-effective choice for investors.
📊 Assets Under Management: Around $25.42 billion.
💵 Dividend Yield: 0.44%, distributed quarterly.
🏆 Top Holdings:
🍎 Apple Inc. (AAPL): 14.34%
🖥️ Microsoft Corp. (MSFT): 11.93%
🎮 NVIDIA Corp. (NVDA): 10.70%
📦 Amazon.com Inc. (AMZN): 7.63%
📱 Meta Platforms Inc. (META): 4.33%
🔌 Broadcom Inc. (AVGO): 3.54%
🚗 Tesla Inc. (TSLA): 3.22%
💊 Eli Lilly and Co. (LLY): 3.20%
💳 Visa Inc. (V): 2.76%
🔍 Alphabet Inc. (GOOGL): 2.31%
📌 Sector Allocation:
💻 Technology: ~52.8%
🛒 Consumer Discretionary: 15.9%
📡 Communication Services: 11.0%
📈 Performance Overview
MGK has consistently demonstrated strong returns:
🗓️ Year-to-Date (YTD): 0.96%
📅 1-Year Return: ~21.09%
📆 3-Year Return: ~23.26%
📊 5-Year Return: ~19.26%
💸 Hypothetical Investment Scenarios
Assuming an average annual return of 19.26%, here's how various investments might grow over five years:
💲 $10,000 Investment:
Year 1: $11,926
Year 2: $14,219
Year 3: $16,951
Year 4: $20,207
Year 5: $24,070
💲 $100,000 Investment:
Year 1: $119,260
Year 2: $142,190
Year 3: $169,510
Year 4: $202,070
Year 5: $240,700
💲 $1,000,000 Investment:
Year 1: $1,192,600
Year 2: $1,421,900
Year 3: $1,695,100
Year 4: $2,020,700
Year 5: $2,407,000
⚠️ Note: These returns are hypothetical and assume consistent annual performance, which may not reflect actual market volatility.
🔑 Considerations for Investors
🎯 Concentration Risk: MGK heavily invests in technology and a few major stocks, tying its success closely to these specific companies.
📉 Market Volatility: Although historically strong, MGK can be highly volatile, particularly during tech-sector downturns.
📈 Long-Term Growth: Ideal for investors seeking significant long-term capital appreciation through prominent U.S. growth firms.
📌 In Summary: MGK provides focused exposure to U.S. mega-cap growth stocks with a strong track record. Investors should consider portfolio diversification carefully due to its sector concentration.

$SPY Daily Chart Taz Plan - May 2025 into June-July Breakdown📉 SPY Daily Chart Trading Plan — May 2025
Thesis:
Price has returned to the exact level ($594.20) where the February impulse breakdown began. This zone is acting as a Lower High rejection within a broader bearish structure. A clean rejection here opens the door to multiple inefficiency fills below.
🔍 Structure Breakdown:
Feb High (ATH): $613.23
Feb Open: $592.67
Feb Close (last green candle before impulse): $594.20
Current Price: $594.20
Marked LH: $592.50
This is a rally back into rejection, not strength.
📉 Key Zones & Gaps:
🔺 Gap Supply: $566.48 – $578.50
🔺 Wick Gap: $558 – $566 → Needs a full-body candle to initiate fill
🟥 FVG (4/22): $528 – $541.52
🧱 Major Support: $481.80
🧠 Trade Plan:
Short Entry 1 (Confirmation-Based):
🔻 Red candle rejection under $592.50 = starter short
🔻 Watch RSI and MACD for momentum fade
Short Entry 2 (Gap Breach):
🔻 If $578 is broken and retested → scale in
🔻 Gap fill expected quickly once triggered
Short Entry 3 (Wick Gap):
🔻 Body close through $558 = last add
🔻 Sets up for final flush to FVG
🎯 Targets:
$578.50 → $566.48 (Gap Fill)
$558 → $541.52 (Wick Gap & FVG Top)
$528 – $530 (FVG Close)
$481.80 (Long-Term Panic Target)
❌ Invalidation:
Daily close > $595.50 = Pause thesis
Weekly close > $600 = Structural shift, short squeeze zone
🧠 Final Thoughts:
This isn’t just a gap fill play — it’s a structural fade from a lower high back into memory. The Feb impulse wave left behind layers of inefficiency, and price just tapped the origin of the breakdown.
Momentum is peaking. If this is a trap, the downside should begin immediately.
Let the chart prove it.

$MSTR Monthly Top Form: “Backwards 4” + Multi-TF RSI DivergenceBefore we begin... trading view is restricting my post for an indicator.. maybe someone reported it... not sure... doesn't seem like a problem... it's a TD Sequential ...
🔍 The Setup — Monthly “Backwards 4” Pattern + Multi-Timeframe Breakdown
We’re now forming the 5th candle in what I call the “Backwards 4” formation, or the upside-down lowercase ‘h’ — a recurring reversal structure I’ve tracked at macro tops.
Structure breakdown:
✅ Strong monthly green candle
2–3. 🔻 Two red candles that retrace the body but don’t break it
✅ A second green candle that re-tests the highs and baits breakout buyers
❌ Final candle closes red → confirms exhaustion → multi-month drawdown begins
We saw this exact setup in early 2021 before MSTR collapsed from $1,000+ to $134. The pattern is now repeating — but this time it’s backed by RSI + MACD divergences on all major timeframes.
📊 Multi-Timeframe Technical Breakdown
📆 Monthly
Inside the “Backwards 4” zone now (candle 5)
RSI Bear Divergence: price made new highs but RSI keeps printing lower highs
MACD flattening after extended expansion
Volume fading for 3 months straight
📌 Momentum is dying while price floats. That’s not strength — that’s late-cycle distribution.
📆 Weekly
TD9 printed this week at the top of a tight 5-month box
RSI rejected at 63.61 — exact same rejection level as last cycle highs
MACD histogram curling while price stayed flat
Range: ~$338–$430 → energy has been spent
📌 This isn’t breakout behavior — it’s a liquidity trap.
📆 Daily
Double top attempt failed at $406
MACD crossed bearish, histogram turning red
RSI Bear Divergence Confirmed:
Price made higher highs from April to May
RSI made lower highs, tagging 66.90 vs. 74.70 earlier this year
📌 Daily has now logged 3 bearish RSI divergence peaks since February.
📋 Trading Plan (as of May 17, 2025)
Position: No current short — stalking ideal entry
Entry Zone: $406–$410 rejection zone (upper box resistance)
Trigger: Daily close under $390 confirms failed breakout
Add Confirmation: Weekly close under $375 = trend shift
Stop: Above $430 monthly high (invalidates breakout fade)
Target 1: $320–$290 (May red close zone)
Target 2: $262 (range midpoint / fib retrace)
Target 3: $240 (prior base support)
Stretch Targets: $175 and $102 if macro breaks down
Waiting for clean structure breakdown before initiating core position. This is a setup worth being early but precise on.
🧠 Final Thoughts:
This is one of my highest conviction macro top setups.
The “Backwards 4” is showing up again with RSI and MACD fading across the board. Price is floating under resistance on weakening momentum, and volume confirms it.
If May closes red, we likely begin a multi-month correction.
I’m watching for the breakdown trigger under $390 to begin building short exposure, targeting sub-$300 by month-end and lower into summer if momentum continues to unwind.
📉📦 Let’s see how it finishes.

Stock Market Forecast | TSLA NVDA AAPL AMZN META MSFTStock Market Forecast | CME_MINI:NQ1! NASDAQ:QQQ AMEX:SPY CME_MINI:ES1!
Mag 7 Forecast | TSLA NVDA AAPL AMZN META MSFT GOOGL

$QQQ Over $523.5 for a retest of Highs. Lower High Setup?As you can see on the notes in the chart, several 5 counts lead to sell offs in the last Quarter. Will this trend continue or will we run it to a 9 Count again? 3 Days left. Watch these levels as I have a possible selloff to May open Price. This would effectively follow my 10D chart forecast of new lows in the next 30-40 trading days, if not 20 for significant damage either way. I will continue to update as we go.

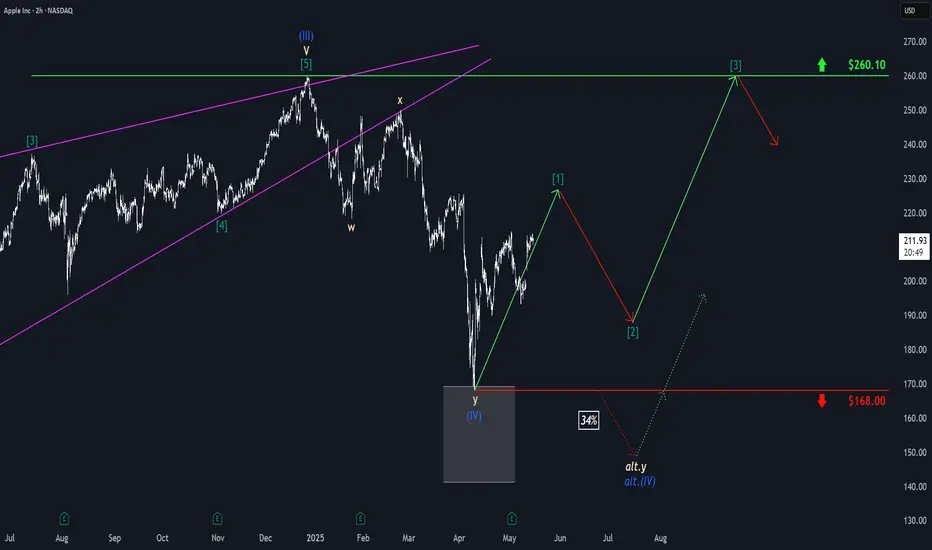
Apple: Wave [1] IntactDespite a significant setback, Apple managed to gather new momentum on the upside and continue its work on the green wave . The impulse structure remains intact, and we expect a new high imminently before the next countermovement with wave follows. The stock should not breach the support at $168 to enable wave to initiate the next upward phase. If the price does fall below the $168 mark, our 34% likely alternative scenario will allow for a new low of wave alt.(IV) in blue, though the rise would also continue after this lower low.
AAPL Trade Plan – 2025 Outlook📊With global markets reacting to renewed tariff talk from Trump, Apple (AAPL) NASDAQ:AAPL could face short-term volatility—but that’s also opportunity. As fears of a trade war ripple across Asia and Europe, AAPL may temporarily dip, especially with supply chain exposure in China.🍏📉📈
📌 Entry Zones (Buy the fear, not the panic):
1️⃣ 194 – Light entry as weakness sets in
2️⃣ 180 – Strong support historically
3️⃣ 166 – High-conviction zone if macro panic escalates
🎯 Profit Targets (Scale out as strength returns):
✅ 209 – Quick recovery zone
✅ 230 – Pre-fear valuation
✅ 260+ – Full macro recovery with bullish momentum
📈 Strategy: Let the news create emotion. You trade the levels.
⚠️ DISCLAIMER: This is not financial advice. Just sharing my personal trading plan based on current macro trends and technicals. Always do your own research and manage your risk.

AAPL | Apple Stock | Three Drives Down PATTERNThe Three Drives / Three Dives Down pattern is usually short term bearish , but near term and long term bullish .
Previously, we saw a -32% correction. This time, it could be a little higher if we consider the previous neckline support:
The only way I see this paying out differently, is if the price captures the current resistance zone, and CLOSES above it:
__________________
NASDAQ:AAPL

AAPL LOOKING BULLISH 14TH MAY 2025Aapl is looking good to go long at current price as every demand is being respected and price is looking to go deeper into tbe supply zone.
So I will be going long with STOCKS ONLY.
If you any doubts do let me know in the comments below

AAPL Wait for Break Out Fibo LevelSignal for AAPL NASDAQ:AAPL
Direction: Buy 🟢
Entry Price: $214.41 (Wait For Fibonacci breakout level as shown in the chart) ✋
Profit Target: $236.90 (targeting the upper resistance level indicated in the chart) 🤑
Stop Loss: $198.75 (below the recent consolidation low for a 2:1 risk-reward ratio)
Risk-Reward Ratio: 2:1
Position Size: Risk 1-2% of your portfolio (e.g., for a $100,000 portfolio, risk $1,000-$2,000)
Entry Timing : Enter on breakout confirmation above $214.41 (Fibonacci level), ideally at the next 4H candle close after the break
Confidence Level: 70%
Why This Signal?
Price Action: AAPL is approaching a key Fibonacci level at $214.41 after consolidating between $203.75 and $214.41. A break above this level signals bullish momentum toward $236.90.
Technical Indicators:
Breakout above the 50-day and 200-day moving averages.
News Sentiment: Mixed with US-China trade tensions (per Forex Factory), but AAPL’s fundamentals remain strong with recent positive sentiment on X.
Follow for the best AI Generated Signals based on Latest Models.
Ash

$SPX Urgent! My <3 & My Soul: Slow Bleed Crash to 3k by Q4 26' Do be warned. Very important post here. I put my heart and soul into this. I made a video earlier and then it got deleted by accident, so I made a less happy one right after. I've got news for all the bulls and investors out there that feel they will be able to continue buying every single dip out there. Get ready for the dip that keeps dipping. Big names already cracking heavy. NASDAQ:META NASDAQ:TSLA NASDAQ:AMD NASDAQ:NVDA to name a few. Big tech is getting cleaned out and layoffs are on the rise. Tariffs create huge amounts of uncertainty. I don't feel like this is rocket science. Buffet is all cash. 89% of Hedge Fund managers believe the US market is the most expensive its ever been and Tutes have been selling at the highest rate ever before. I think it's time the US finally gets a shake down. Bullish conditioning has been running rampant, and I've seen Social Media Accounts discourage charting and only paying attention to price action? Price action involves the entire collective, not just one Timeframe. Anyways, here's an overlay from 01' ... the only one I could find that matches. Says short 560 around May 7th and then take profits around 500 again. Let's make this a nice one. Calls till 560 into May then flip to Puts into June. From then short 530 every time you can. $450 is My first target after we break previous lows. I will update as we go. Have a good one yall.

Trade Idea: $MSFT Short to $418 and beyond into JuneTriple bearish divergence is evident on Volume, RSI, and Momentum. The 9-count sell signal on the daily chart further supports the likelihood of a sell-off at this point. If the price falls below $425, a swift decline to $418 is anticipated, where the true test of the Fair Value Gap (FVG) below will occur. The Fair Value Gap open is at $392.45. Stop would be above yesterday's high at $439.50 ...

Stock Market Forecast | TSLA NVDA AAPL AMZN META MSFTStock Market Forecast | CME_MINI:NQ1! NASDAQ:QQQ AMEX:SPY CME_MINI:ES1!
Mag 7 Forecast | NASDAQ:TSLA NASDAQ:NVDA AAPL AMZN META MSFT GOOG

$SPY Its time according to my chart.. Lower high is the trigger I posted two charts for reference to the current situation. With a historic rally right into resistance and a fractal analog that matches, I have no choice but to remain bearish. These are my studies. Sometimes Impatience leads to things like Impulsive Entries and Exits, Revenge Trading, and at times, even Blown Accounts. Times like those should be followed by a regroup and a reset.
The 9 Count Sell Signal Triggered with a Reset is on Technical Inidators for a move lower. I do believe we are going to consolidate for several days but nothing further than the second week of May. Today Bulls got extremely bullish and still were not able to hold the highs into the close. The test of the 200 day SMA was rejected and several days near these leveles whether above or below, would prove the downside move more possible. The monthly on SPX is my biggest indicator, personally. If it follows the pattern I'm following then after a test of the 10WMA, we will roll back over on the next 10 day candle. The market ran through a death cross without stopping, which if anyone were to study for several minutes, they would be able to see any first attempt at a death cross to the upsde is almost immediately met with a selloff back to the lows of the breakout move. Good luck everybody.

AAPL – Long Trade Setup (Support-Based Reversal Opportunity)Apple (AAPL) is pulling back toward a key support zone between $197–$198, aligning with both previous structural support and potential demand zone behavior. This setup offers a favorable risk-to-reward profile for a swing long entry.
🔹 Entry Zone:
$197 – $198
🎯 Take Profit Targets:
🥇 $210 – $215
🥈 $225 – $233
🛑 Stop Loss:
Just below $190

From $1 to $10 doing 900% in 2 days $KIDZ💣💥 $1 to $10+ in 2 days +900% NASDAQ:KIDZ similar to AMEX:GPUS
Shortsellers attempted similar tricks during the day and got squeezed the same way on both 🤣 making us awesome gains along the way
Please 🐻 attempt to do it again on next setups.
3 Buy Alerts in $3.50 - $4.00 range more than enough money made into vertical to $10+

Apple Shares (AAPL) Drop Below $200Apple Shares (AAPL) Drop Below $200
Late last week, Apple released a quarterly report that beat analysts’ expectations:
→ Earnings per share: actual = $1.65, forecast = $1.63
→ Revenue: actual = $95.36bn, forecast = $94.5bn
However, today AAPL stock price is below the psychological $200 mark, over 7% lower than last week’s high (point E).
Why did AAPL shares fall?
According to media reports, investors were concerned about weaker-than-expected services revenue and disappointing sales in China. These factors have renewed fears that the ongoing US–China trade tensions could have a deeper impact on Apple going forward.
Bearish sentiment may also have been amplified by Warren Buffett’s decision to step down as head of Berkshire Hathaway — as we noted yesterday — since his company is one of Apple’s major shareholders.
Technical Analysis of Apple Shares (AAPL)
Key AAPL price action patterns (marked) show a sequence of lower highs and lows, forming the basis for a downward channel. Fibonacci ratios reinforce bearish characteristics in price movements:
→ The rise from B to C is approximately 50% of the decline from A to B
→ The rise from D to E is around 50% of the decline from A to D
This technical picture suggests a potential bear market, where rallies may be corrective rebounds following impulsive drops. This strengthens the scenario in which AAPL shares could continue falling within the established descending channel.
This article represents the opinion of the Companies operating under the FXOpen brand only. It is not to be construed as an offer, solicitation, or recommendation with respect to products and services provided by the Companies operating under the FXOpen brand, nor is it to be considered financial advice.

$MSFT BEST TRADE EVER? SUB $400 incoming by Mid JuneHey everybody, I hope that rally didn't kick your arses the way it did mine. You know, it's like I'm allergic to taking upside atm due to how bearish the MACRO is. Of course, with time, I'm going to assume I get most of my downside Price Targets in the next several years.
If you refer to the previous 23% Run to the 200DMA from the 50day in 2023 , NASDAQ:MSFT produced a 9 COUNT SELL SIGNAL , RALLIED for a week, and then dropped to new lows. That is what I am expecting here.
NASDAQ:MSFT looks absolutely ripe for the taking. We just rallied 17% and got the 9 COUNT SELL SIGNAL . Mind you, Gaps galore below. The Monthly and the Weekly both have Gaps . Charts do not like that, let me tell ya. I'm excited if you can't tell. NASDAQ:META and NASDAQ:AVGO look great as well. I'm still cautious about a spike out but I figure if we continue higher, i will have opportunity to grab more for cheaper as I am very confident in this move. The price moved above the DEATH CROSS and above the 200DMA . Not ever a healthy move if it moves Vertically from the 50 day and Crosses above both MA's without a stop. Mid June NASDAQ:MSFT should be at new lows.

APPLE Set To Grow! BUY!
My dear friends,
Please, find my technical outlook for APPLE below:
The price is coiling around a solid key level - 205.25
Bias - Bullish
Technical Indicators: Pivot Points High anticipates a potential price reversal.
Super trend shows a clear buy, giving a perfect indicators' convergence.
Goal - 208.36
About Used Indicators:
The pivot point itself is simply the average of the high, low and closing prices from the previous trading day.
Disclosure: I am part of Trade Nation's Influencer program and receive a monthly fee for using their TradingView charts in my analysis.
———————————
WISH YOU ALL LUCK

Stock Market Forecast | TSLA NVDA AAPL AMZN META MSFTStock Market Forecast | CME_MINI:NQ1! CME_MINI:ES1! QQQ SPY SP:SPX
Mag 7 Forecast TSLA NASDAQ:NVDA AAPL AMZN META MSFT

APPLE: Bullish Continuation is Expected! Here is Why
Our strategy, polished by years of trial and error has helped us identify what seems to be a great trading opportunity and we are here to share it with you as the time is ripe for us to buy APPLE.
Disclosure: I am part of Trade Nation's Influencer program and receive a monthly fee for using their TradingView charts in my analysis.
❤️ Please, support our work with like & comment! ❤️
