AAPL - Vision Pro HypeUp channel between the two diagonal lines
I expect an extension of gains due to the hype release of the vision pro product from AAPL
I am excited for the future of "black mirror" type technology.
Small down channel in white that has been broken.
AAPL

APPLE (AAPL) Analysis - W3 develop
Save time. Technical Analysis in just a few words.
Daily Timeframe. AAPL is currently developing a bigger 3rd Wave on the upside.
Long term direction: LONG
It looks like Wave 3 is still unfolding on the upside. A correction will come soon, then a final Wave 5 will push on the upside (probably by the end of the year).
That's it. Have a nice day!
DISCLAIMER: The ideas shared in this context are strictly for educational purposes and should not be considered as financial or legal advice. Each individual bears full responsibility for their own trades and decisions.

Get your 'headset' around Apple's key reversal dayWhat costs $3500 and leaves the user vulnerable to being pranked from ‘friends’ whilst wearing it? Yes, Apple’s augmented reality headset, which comes in ~3x more than one made by Meta. You can read up on all its features and Apple’s latest announcements elsewhere. As what we’re focussing on today is that Apple’s stock closed lower on the day it unveiled its latest anti-social device. And the fact it occurred after a false break to a fresh record high should also serve as a ‘reality’ check to bulls. At least over the near term.
Sure, the daily chart is clearly in an uptrend. But it has hit a stumbling block at its previous record highs set in 2022. Moreover, RSI has reached overbought and the day closed with a key reversal bar – which is a bearish outside / engulfing candle on high volume, which suggests all is not well at these highs. Furthermore, the OBV indicator (on balance volume) has failed to break above its own cycle high despite prices continuing north which suggests potential weakness to the underlying trend.
From here, bears could either seek to fade into minor rallies within the key reversal day, and set an initial downside target around 157.77 gap support. A break beneath which brings the 170 handle / 172.15 HVN (high volume node) into focus for bears.

RRR setting up for a massive profit run?I have several time frames I have charted for this going over everything I see. RRR is red rock resorts in Las vegas nevada, and both my fav casino which is off strip about 15 mins and one of my fav stocks to play.
I am huge on wyckoff , demand and supply, volume tracking, price targets based off the prior, and control box master pattern targets ideologies.... I also have my ESVO lines or ribbon that also encompasses volume and price. Combining all of these things paints a picture across all time lines and when they match up its set to run!
I have used this same TA on my AAPL, ENPH (up and down), AIG, GNRC, Li, IOT, Bili, TRKA, & PSNY, option plays. I enjoy looking far out to see what the end result is going to be and then aligning all the time frames to optimize the in and out. a lot of times when you look at larger time frames you are caught in the up and down which can mess up your theta on an option play. So thats why in this trade I am aligning all the time frames. the only one left is the 15 min time frame. which I will post an update to this when I finish this post.
Do me a favor if you find any of my info intriguing pls hit the boost so others can see it.
by iCantw84it
05.17.23

TSLA NVDA AAPL | Market SPY QQQ Detailed Trend Guide- Tesla TSLA broke above monthly uptrend today, and lacking a little follow through due to QQQ being flat, although there is still 25 days left in the month so still got time.
- Nvidia NVDA forming a 4h equilibrium, also potential H&S
- AAPL looking like sell the news, potential blow off top but need a lot of a bigger drop for it to be a blow off top.
- SPY and QQQ testing golden pocket ratio zone resistance.

APPLE Made a new All Time High! Can it extend the gains?Apple Inc. (AAPL) just made a new (historic) All Time High (ATH) today by breaking above $183.00 and is simply extending the rise on the Channel Up pattern that started on the January 03 2023 market bottom. At the same time it has already hit our short-term target (165.00) and is near completing our final target of 190.00. This is the target set we called for on our last Apple analysis on March 06 (see chart below):
The basis of this target is the 2.0 Fibonacci extension from the Right Shoulder of the Inverse Head and Shoulders (IH&S) pattern that priced the January bottom. The 1D RSI however has reached a level, the 76.50 Resistance, which since last August has caused two rejections. We do expect a rebound on the 4H MA50 (yellow trend-line) but if broken, be ready to add buys on the 1D MA50 (blue trend-line) which has been holding as Support since January 25. The long-term Support from now on is the 1W MA50 (red trend-line), which is traditionally the Support on new multi-month rallies such as the current one.
-------------------------------------------------------------------------------
** Please LIKE 👍, FOLLOW ✅, SHARE 🙌 and COMMENT ✍ if you enjoy this idea! Also share your ideas and charts in the comments section below! **
-------------------------------------------------------------------------------
💸💸💸💸💸💸
👇 👇 👇 👇 👇 👇

🍎Apple🍎 was able to break the descending channel!!!Apple has been moving in a descending channel for over a year📅.
But it's been a few days since Apple was able to break the upper line of the descending channel , and a valid sign of failure and the completion of a pullback can be a Runaway Gap .
I expect Apple to grow at least until the first 🟡 PRZ (Price Reversal Zone) 🟡.
If you want to know about the types of chats, you can read the following article.👇
Apple ( AAPLUSD ) Analyze, Daily time frame⏰.
Do not forget to put Stop loss for your positions (For every position you want to open).
Please follow your strategy, this is just my Idea, and I will be glad to see your ideas in this post.
Please do not forget the ✅' like '✅ button 🙏😊 & Share it with your friends; thanks, and Trade safe.

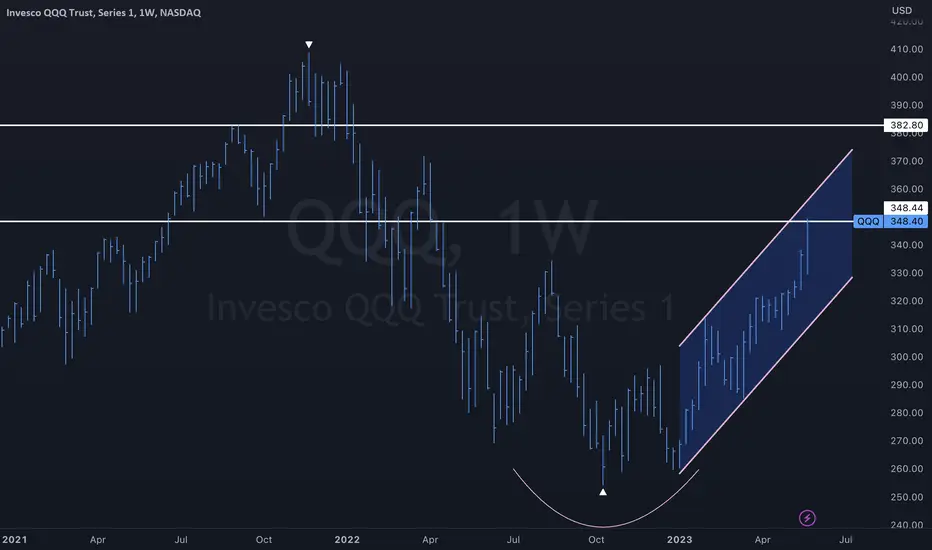
QQQ OUTLOOK 06/05 - 06/09QQQ crushed it again last week, testing a breakout above the channel we drew last week. Investors will look at Apple’s press conference at WWDC 2023 (Monday at 1:00PM EST). It’s safe to say that whichever way Apple moves, NASDAQ:QQQ will follow.
Technical Analysis: Although we got 2 candle bodies to close above the bullish channel, we still have yet to have a full candle body with wicks close above the trend line. I do think we will have some sort of consolidation this week.
Bulls will want to see price action continue above last week’s open at 352.71. Last week’s .618 retrace is around 350, so look to see if dips will be bought at fib retraces. To the upside, we can target the gap fill above from 356.78-359.93.
Bears will have control if we cannot hold a consolidation within last week’s price range. If we lose last week’s low of 346.51, another significant golden pocket retrace can be found around the monthly level at 338.19.
Upside Targets: 354.65 → 356.78 → 358.97 → 359.93 → 362.54 Extended: 364.57
Downside Targets: 352.46 → 350.72 → 349.65 → 348.54 → 346.51
If we lose last week’s low:
Extended: 344.57 → 341.31 → 339.60 → 338.19 → 336.67

TSLA NVDA AAPL MSFT GOOGL AMZN Detail Trading Guide with Levels- most of all these big tech stocks and market itself are due for weekly consolidation so the most likely scenario for me in the next coming weeks is more so a sideways or slight dip action.
- the size of this consolidation pull back will determine our next move
- Tesla about to form its first monthly uptrend since ATH
- Nvidia potential 4h head and shoulders pattern
- AAPL & MSFT potentially testing ATH

Apple On a Major Resistance, Take a Close Watch on this LevelAAPL has reached a significant resistance level on the weekly chart, showing signs of selling pressure. If the price revisits this level, it could repeat the previous selling pattern. However, if a clear breakout occurs, a new all-time high may be established, indicating a continuation of the current bullish trend.

AAPL: Navigating the Push to $166-$167 and its Impact on SPXOn March 28, merely three days ago, I highlighted the inverted head and shoulders pattern observed in AAPL's stock price. In this particular case, the pattern indicated a bullish continuation. I discussed the support and resistance flip that transpired at the $156 mark. At that time, AAPL was trading just below $156.50, and I projected a bounce to $166, provided that the stock found support at $156. Currently, with AAPL at $164, I maintain my expectation of a push towards the $166-$167 range in the upcoming sessions.
AAPL's performance has contributed significantly to the upward movement of the SPX in recent days. While not the sole reason, AAPL's strong showing is indeed a critical factor, given its heavy weighting in the index. Other stocks, such as TSLA, have also performed well, further bolstering the SPX.
This week, the SPX has experienced multiple gap-ups, and as AAPL approaches the $166-$167 price target, I recommend using this opportunity to reduce risk exposure. It is plausible that we may see a short-term pullback from these levels, even for those with a bullish outlook.
EDUCATION - Head and Shoulders - Continuation
Technical analysis is a vital tool for traders looking to identify trends and make informed decisions in the financial markets. Among the many chart patterns that traders rely on, the head and shoulders pattern stands out as a widely-recognized and powerful indicator. However, the lesser-known inverted head and shoulders pattern can also serve as a continuation pattern in an uptrend rather than a reversal formation. I'd like to dive into this a little bit in case there are readers that did not understand how I came to the conclusion I came to with AAPL.
Understanding the Inverted Head and Shoulders Pattern
The traditional head and shoulders pattern is characterized by three consecutive peaks resembling a head and two shoulders. Conversely, the inverted head and shoulders pattern consists of three troughs, with the middle trough being the deepest and the other two at roughly the same level. While the conventional head and shoulders pattern typically signifies a bearish reversal, the inverted version can signal either a bullish reversal or a continuation of an existing uptrend.
Identifying the Inverted Head and Shoulders Continuation Pattern
To effectively spot an inverted head and shoulders pattern in an uptrend, traders should look for the following characteristics:
1. Preceding Uptrend: The pattern must form within an existing uptrend to qualify as a continuation pattern.
2. Distinct Troughs: The pattern should have three clear troughs, with the middle one (head) being the lowest and the other two (shoulders) being roughly equal in depth.
3. Neckline: Connecting the highs of the two shoulders forms the neckline, a resistance level that the price must break through to confirm the pattern.
4. Volume: Ideally, volume should decrease as the pattern forms and increase upon breaking the neckline, signaling the continuation of the uptrend.
Trading the Inverted Head and Shoulders Continuation Pattern
When utilizing the inverted head and shoulders continuation pattern in trading, consider the following steps:
1. Confirmation: Wait for the price to break above the neckline with an increase in volume. This confirms the pattern and suggests the continuation of the uptrend.
2. Entry: Enter a long position when the price breaks above the neckline.
3. Stop-Loss: Place a stop-loss order below the right shoulder to minimize potential losses.
4. Profit Target: Calculate the profit target by measuring the distance between the neckline and the head. Add this value to the neckline's breakout point to determine the target price.

✅APPLE RISKY SHORT🔥
✅APPLE has been growing recently
And the stock seems locally overbought
So as the price is approaching a horizontal resistance of 182$
Price decline is to be expected
SHORT🔥
✅Like and subscribe to never miss a new idea!✅

Apple Potential Selling SoonTaking a look into Apple, we have some indicators that we may see some selling here soon. It has formed a descending channel.
Indicators:
- MACD is in an average area of a bullish move before a sell off.
- RSI slightly surpassed the last high of Aug 2022 but it is still not overbought yet, we simply have room to head down if it does.
- MFI (Money Flow Index) seems to have peaked and is slightly sinking.
Comments:
We're still waiting on Apple earnings which have been pushed to May 5th for some reason. We do see a head and shoulders have formed. If we do see a sell off which would need to start soon in order to confirm the prediction, we should see a bounce in the HKEX:138 - HKEX:142 area about a month or two into selling, before heading back down. You can confirm this by looking blue arrows. The bounce typically happens in the same timeframe and percentage down after the selling has begun. Further more, this has been the longest bounce since the selling started in early 2022. This rally has about exhausted itself, especially in the face of decaying economic data.
For giggles, I overlaid the Feds Balance Sheet and amazing coincidence when the sheet explodes up, equities also exploded up. The balance sheet rises ALWAYS precedes the markets going up. Tale tale that when Apple started to sell off Feb 23rd, the balance sheet grew THEN Apple's stock prices started to rally yet again. But, as we can see the balance sheet has begun unwinding. Amazing seeing how markets have been weaker and weaker, ending in the red or flat. I believe this is a tale tale sign of another wave down.
There is more talk of banking issues, and now commercial real estate issues. Let's see what transpires by summer. The Fed all but confirmed a recession and blamed it on the banking crisis.

AAPL Set To DropAAPL is set to drop based on multiple indicators on this hourly chart. Some key indicators to look at are: Divergence+ Sell signal. These signals are strong and have a high accuracy, so accurate the creator charges a subscription and as a retired options swing trader who does not currently use the indicator for personal use has made enough money off the script to pay for it the rest of my life. As a small trader ( <50k annual income and no starting investment funds ) has made tens of thousands of dollars with this script. I swear by their accuracy! The red cloud above the most recent candles is also bearish divergence, the outlined red is where the RSI is above 70 and the MACD also shows growing bearish divergence with plenty of room for the price to drop.

Apple -> Pump Might Be Over NowHello Traders,
welcome to this free and educational multi-timeframe technical analysis .
On the weekly timeframe you can see that Apple stock is currently retesting a quite massive previous weekly resistance area at the $180 level which is now definitely pressing price lower.
You can also see that over the past couple of weeks, Apple had a massively bullish rally of about 45% towards the upside without any real correction, so I am now just waiting for a short term rejection away from the resistance before I then do expect more upside continuation.
On the daily timeframe you can see that market structure is still massively bullish overall, there is no sign of Apple stock slowing down yet, so I am simply waiting for some bearish rejection at the current levels before I then do expect a short term correction towards the downside.
Thank you for watching and I will see you tomorrow!
You can also check out my previous analysis of this asset:

$AAPL , Analysing Trends, Patterns, and IndicatorsNASDAQ:AAPL
Greetings, fellow traders! I am thrilled to present my analysis and insights on TradingView, where I will be sharing trend analysis, chart patterns, and technical indicators to help you navigate the exciting world of the stock market. It's important to note that I maintain a neutral stance and base my decisions solely on identifying promising opportunities.
As an observer of market trends, my goal is to provide you with comprehensive and visually appealing charts that showcase the potential opportunities I see. Please remember that I am not a financial advisor, and any investment decisions you make should be thoroughly researched and evaluated based on your own risk tolerance and financial goals.
In each analysis, I will walk you through the patterns and indicators I have identified, highlighting key support and resistance levels, trendlines, and other critical technical aspects. My approach is to objectively present the information and allow you to interpret it as you see fit. Whether you choose to go long or short in the stock market is entirely up to you.
My main focus is to share the knowledge and insights I have gained from studying charts and technical analysis. By doing so, I hope to contribute to your trading journey and help you become a more informed and confident trader. It is important to continuously learn and adapt to the ever-changing dynamics of the market.
I invite you to join me on this exciting journey as we explore the fascinating world of trading together. Feel free to provide feedback, ask questions, and share your own perspectives in the comments section. Your engagement and participation are greatly appreciated.
Remember, trading carries risks, and it is essential to conduct thorough due diligence before making any investment decisions. I am here to provide information, but the responsibility lies with each individual trader to make their own choices.
Thank you for taking the time to explore my charts. I hope you find value in the insights I share, and may they contribute to your trading success. Happy trading!
Disclaimer: I am not a financial advisor. The analysis and opinions expressed here are solely based on my observations and should not be considered as financial advice. Please consult with a licensed professional before making any investment decisions.

APPLE Short From Resistance! Sell!
Hello,Traders!
APPLE is going up now
But a very strong horizontal
Resistance is ahead at 182$
From where I think we will
See a bearish correction
And a move down
Sell!
Like, comment and subscribe to help us grow!
Check out other forecasts below too!

NVDA TSLA MSFT GOOGL AAPL AMZN | Support & Resistance Guide- Support & Resistance guide for all 6 big tech stocks NVDA TSLA MSFT GOOGL AAPL AMZN
- psychological 1 trillion dollar level for NVDA 405
- TSLA wedge pattern still in play
- zero red flags on the chart for MSFT and AMZN need hourly downtrends to confirm for any signs of bears

$AAPL Tops out in August This chart of NASDAQ:AAPL shows that it makes a monthly high in the month of August, is it going to be the same this year?

$QQQ Parallel channel uptrend NASDAQ:QQQ parallel uptrend continues into resistance. Holiday hangover next week should be light volume which favors the upside.
$QQEW Inverse head n shoulders NASDAQ:QQEW Inverse head n shoulders ready to break out. it needs to consolidate next week before it can break out. equal weight nasdaq 100

Is Paypal a Memestock?Mounting debt may be an issue, but there's no way NASDAQ:PYPL should look like this from a chart perspective.
While NASDAQ:NVDA became the 6th largest company in the world today, Paypal used to be a $400+ billion dollar enterprise, but it looks like junk now.
What gives? The company still throws off more than $30b in revenue a year, pricing it at only 2.5x sales???
A lot of worry has been put into NASDAQ:AAPL launching their new payments platform, but no actual product has hit the market yet. Until then, PayPal is still for sure the global leader and an undervalued player relative to its peers.
Maybe NASDAQ:EBAY will buy them back?

APPLE Will Go UP! Buy!
Hello,Traders!
APPLE is trading in an
Uptrend in a rising parallel
Channel and the price is
About to retest the rising
Support from where a
Rebound is likely
Buy!
Like, comment and subscribe to help us grow!
Check out other forecasts below too!
