394% Biggest gainer of the day $ONVOPerfect dip buy with minimum risk before the pop back to highs for easy money 🎯
All that while the rest of the market ends the day in deep red
+17.0% realized profit on the day while NASDAQ:TSLA NASDAQ:AAPL NASDAQ:NVDA NASDAQ:PLTR and the rest of the market all 🔻
AAPL

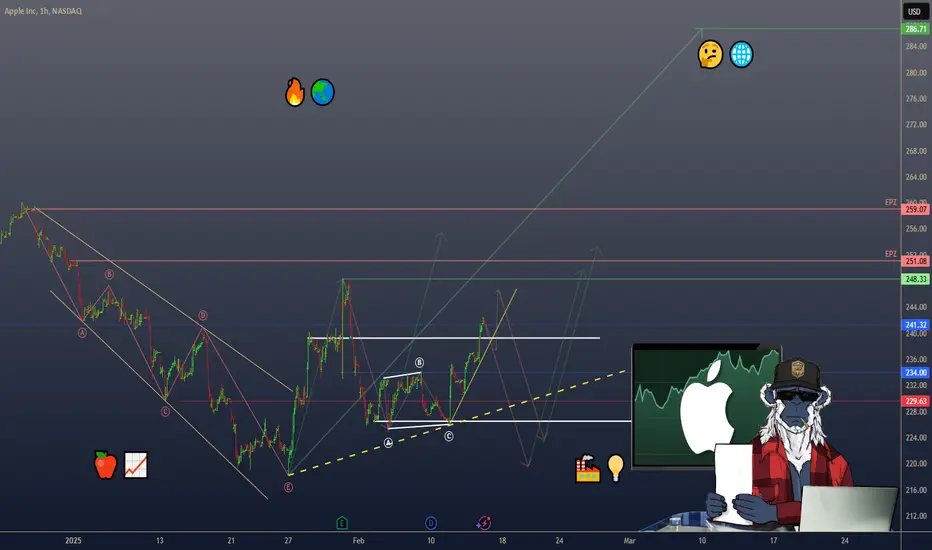
Apple: Top and DropAs part of Apple's ongoing wave (2) correction, we assume that the subordinate turquoise wave X still needs to conclude in the short term before the price can drop into our magenta Target Zone between $209.57 and $196.05. There, we anticipate a bullish reversal, which should offer trading opportunities for the long side and mark the starting point for the next major upward move. Alternatively, there is a 37% chance that the low of wave alt.(2) has already been reached, which will be confirmed if the price surpasses $260.10.

AAPLAAPL price is in a correction phase. Now the price is near the resistance zone. If the price cannot break through 259, it is expected that the price will drop. Consider selling the red zone.
🔥Trading futures, forex, CFDs and stocks carries a risk of loss.
Please consider carefully whether such trading is suitable for you.
>>GooD Luck 😊
❤️ Like and subscribe to never miss a new idea!

$SPY $SPX OLD CHART BAR PATTERN COVID CRASH NOW!!!!Holy crap.... I just came across an old chart and literally in the nick of timeI tell you. All I'm going to say is... I'm a pattern chart trader and this is the COVID bar pattern attached to our daily from like a year ago almost and I loaded up an old layout to do work and boom... here we are... Good LUCK ... Not sure what the trigger will be but we are here.
AAPL Price Analysis: Targeting $270 by December 2024Hello Traders,
I'm sharing my latest analysis on AAPL, currently trading at $226.5. Previously, on August 23, 2023, I predicted that AAPL would hit its first target of $220 and its second target of $250. As you can see in the attached chart, AAPL has been making significant progress.
On the weekly chart, a flag pattern has emerged in the middle of the chart. I’ve drawn a parallel channel surrounding this flag pattern and aligned the channel’s upper and lower lines with the Fibonacci levels of 38% and 61.8%. By projecting these lines to the 100% level, I’ve identified a target price of $270, a key level based on important angular calculations.
Target 🎯: $270
When? Based on the time it took for AAPL to move from the 0% level at $55 to the 50% level at $165, which was 86 weeks or 602 days, I anticipate a similar timeframe for the move from the 50% level to the 100% level (yellow circles on chart). This places the expected date to reach $270 around December 23, 2024.
NASDAQ:AAPL

Stock Market Analysis | TSLA NVDA AAPL AMZN META GOOGL MSFTStock Market Forecast | NASDAQ:QQQ AMEX:SPY SEED_ALEXDRAYM_SHORTINTEREST2:NQ NYSE:ES
Mag 7 Forecast | NASDAQ:TSLA NASDAQ:NVDA NASDAQ:AAPL NASDAQ:AMZN NASDAQ:META NASDAQ:GOOGL NASDAQ:MSFT

APPLE: Bearish Continuation & Short Signal
APPLE
- Classic bearish formation
- Our team expects fall
SUGGESTED TRADE:
Swing Trade
Sell APPLE
Entry Level - 245.60
Sl - 251.83
Tp - 233.21
Our Risk - 1%
Start protection of your profits from lower levels
❤️ Please, support our work with like & comment! ❤️

Apple Inc. (AAPL) Forming a Potential W-Pattern – A Bullish SignApple Inc. (AAPL) Forming a Potential W-Pattern – A Bullish Signal
Apple Inc. (AAPL) appears to be shaping a significant W-pattern, a well-known technical formation often associated with bullish momentum. From a psychological standpoint, this pattern suggests a potential buying opportunity.
Should fundamental factors align with this technical setup, I anticipate a strong upward move, targeting my 3 TP levels at $245, $250, and $260.
To maximize profitability and maintain a disciplined approach, traders should consider managing risk effectively.
Holding positions for optimal gains becomes easier when avoiding excessive leverage—or better yet, trading with no leverage at all.
Trade with caution.
Always align technical insights with fundamental analysis before making investment decisions.

New highs area +$1,000/share unlocked for NasdaqSeems like 2 months of sideways downtrending (since mid December) is over for Nasdaq.
Unless any surprise political shock news come out (we all know that can be a challenge with Trump) we could see Nasdaq reach $23,000 per share area in drawn upcoming green period.
This would also reflect directly on upward momentum for several bluechip stocks:
Apple Inc. NASDAQ:AAPL
Microsoft Corporation NASDAQ:MSFT
Amazon.com Inc. NASDAQ:AMZN
Alphabet Inc. NASDAQ:GOOGL
Meta Platforms Inc. NASDAQ:META
NVIDIA Corporation NASDAQ:NVDA
Tesla Inc. NASDAQ:TSLA
Intel Corporation NASDAQ:INTC

Stock Market Forecast | TSLA NVDA AAPL AMZN META GOOGL MSFTStock Market Analysis | SPY QQQ, NQ ES
Mag 7 Analysis | TSLA NVDA AAPL AMZN META GOOGL MSFT

APPLE: Bears Will Push
The price of APPLE will most likely collapse soon enough, due to the supply beginning to exceed demand which we can see by looking at the chart of the pair.
❤️ Please, support our work with like & comment! ❤️

APPLE ($AAPL) – Q1 FY25 EARNINGS & WHAT’S NEXT APPLE ( NASDAQ:AAPL ) – Q1 FY25 EARNINGS & WHAT’S NEXT
(1/8)
Revenue: $124.3B (+4% YoY) – A new all-time record! Services soared +14% to $26.3B, offsetting a slight dip in iPhone sales. Let’s see how Apple’s holding up. 🍎📈
(2/8) – EARNINGS BEAT
• EPS: $2.40 (beat by $0.06)
• Gross margin: 46.9%, topping estimates 🔥
• Despite China sales dropping 11% to $18.51B, Apple still racked up big gains elsewhere 🌏
(3/8) – SECTOR SNAPSHOT
• Market cap $3.5T+, P/E ~30
• Some call it pricey vs. tech peers, but brand strength + services + potential AI expansions = possible undervaluation 🤔
• Compares favorably to Microsoft, Samsung, etc., given stable product + services synergy 🌐
(4/8) – RISKS TO WATCH
• Geopolitical: China manufacturing & sales reliance → Trade tensions? Tariffs? 🏭
• Innovation Pace: Competitors could leapfrog Apple in AI or other emerging tech 💡
• Regulatory: Antitrust cases (App Store) could pinch profitability ⚖️
• Economy: Premium pricing in downturn—brand loyalty helps, but can’t ignore recession effects 💸
(5/8) – SWOT HIGHLIGHTS
Strengths:
Legendary brand loyalty & huge install base
Growing services revenue (+14%!)
Massive cash reserves for R&D & buybacks
Weaknesses:
Heavy dependence on iPhone sales
China manufacturing concentration
Opportunities:
AI, AR/VR expansions (Vision Pro, maybe more)
Emerging markets → untapped smartphone penetration 🌍
Services sector continuing to expand ⚡
Threats:
Fierce competition (especially in China) 🦖
Trade tensions & supply chain hiccups 🌐
Shifts in consumer tech tastes or new disruptors
(6/8) – CHINA SALES DENT
• China down 11%—that’s a chunk given its importance
• Local giants (Xiaomi, Huawei) are snapping at Apple’s heels 🦾
• Will Vision Pro + AI upgrades woo Chinese consumers back? 🤔
(7/8) – Is Apple undervalued at a $3.5T market cap & P/E of 30?
1️⃣ Bullish—Brand power + AI = unstoppable 🍀
2️⃣ Neutral—Solid, but watch those China risks 🔍
3️⃣ Bearish—Too expensive, competition’s rising 🐻
Vote below! 🗳️👇
$3 to $8.77 vertical +182% after I told you about it at +40%!$3 to $8.77 vertical with 2 Buy Alerts right before the speed up 🚀💵 NASDAQ:AIFF
Hottest stock of the day, it was on my premarket watchlist while still only at +40% premarket 🔎 You have been warned on time
Who cares about -5% NASDAQ:TSLA and +3% NASDAQ:AAPL when so much more can be made here with catching just a piece of the move

Stock Market Forecast | TSLA NVDA AAPL AMZN META MSFTStock Market Forecast | SPY and QQQ
Mag 7 Forecast | TSLA NVDA AAPL AMZN META GOOGL MSFT

Your Most Requested Stocks Are Here - 15 Stocks, 15 Analyses!Hello readers,
Just a few days ago, I ran a "poll" - huge thanks to everyone who participated in the comments! The response was amazing: 130 mentions, 80 different stocks, and 15 tickers that stood out with multiple mentions. Stay tuned as I break down the most requested ones!
I initially planned to let this run longer, but interest has cooled off a bit, so I’ve decided to wrap it up and start summarizing the results so you can analyze them through the weekend.
Now, let’s get to it:
✅ A technical breakdown of 15 stocks.
✅ Key price levels and volatility zones to watch.
✅ Possible scenarios and setups based on the charts.
Some charts tell a clear story, while others… well, let’s just say not all price action is tradable and I’ll explain why.
Which stocks made the list? Scroll down and let’s dive in!
15. Microsoft (MSFT)
Looking at Microsoft's price movements, I wouldn’t rush into a position just yet. The stock has been stuck in this price zone for more than a year. While buying at the current levels could work out, there is also a risk that it remains in this range for another year.
Instead, I see two scenarios that offer a better approach:
1. This scenario relies on waiting for a pullback. A better price = better future returns. If the price drops to $290–$355/360, I would be ready to buy. Lower price levels often offer new liquidity, providing stronger momentum in the years ahead.
2. Wait for confirmation instead of guessing. Let the market show that investors are willing to push MSFT to higher levels before entering. Over the past year, the price action has established a resistance zone at $450–$460. A monthly close above this level would provide confirmation. However, patience is still key because the round number $500 could act as an obstacle. After a breakout, you have another two options:
Buy immediately after the breakout is confirmed - monthly close needed - or wait for a rejection from $500 before entering. This could provide an opportunity to buy at a similar price but with more confirmation and a stronger support level. This approach increases the chances that investment starts working more efficiently and from a better technical position.
14. Robinhood Markets (HOOD)
There isn’t much to say, the stock is flying. However, to add an educational perspective, these small pauses in the movement can create liquidity zones after a pullback.
If the stock pulls back and you find yourself wondering “Where is the right spot to enter?”, these pause areas provide potential opportunities. While this isn’t necessarily a setup, using these pullbacks effectively can help scale up your position in the stock or initiate a new one.
Many traders hesitate, thinking, "It's too expensive, it's too expensive," suddenly the price pulls back to a pause area. When that happens, you already know what to do - set your alerts.
13. Salesforce (CRM)
Confirmed Breakout:
We have three clean previous yearly highs - we mark them.
As investors, not traders, we focus on the strongest zone - we connect them.
Within this zone, there is a minor round number at $300, and for me, the strongest retest area is currently at $270–$300.
This level could serve as a key support zone for potential future entries.
12. Intel Corporation (INTC)
This is quite a difficult chart with poor price action, making it challenging to navigate. Personally, I wouldn’t take any action until one of these two scenarios becomes valid.
Deeper pullback for liquidity – The drop has been strong and intense and we could see lower prices as in 1996. A move below the current support level could attract new liquidity and hopefully, make the stock more attractive to investors.
Break above the strongest resistance – This scenario is highly time-consuming. Right now, the stock is trading below a major resistance area, and recovering won’t be easy, especially after such a sharp drop from a 2023 positive price trend. A break above $28 would make it more attractive for me.
For those already holding INTC, selling could be a strategic move. You could potentially buy back at lower prices, reducing the risk of having your investment stuck for several years. Given the current price action, breaking back above resistance will be a difficult battle - there are much better opportunities.
11. Novo Nordisk (NOVO_B)
I mentioned this stock on TradingView a few months ago, as well as at a financial conference in Estonia. The price has moved a bit but here is the initial technical thesis:
The key area remains 500–600 DKK, with the following criteria:
- A small pause in price movement, similar to what I discussed in the HOOD analysis.
- 50% retracement from the all-time high—for large-gap stocks, this level can offer strong volatility, if the fundamentals, in general, remain stable.
- The round number at 500 DKK, which could act as a psychological support level.
10. Coinbase (COIN)
A year and a half ago, I posted an analysis on TradingView about COIN, currently up almost 300% , highlighting an Inverted Head and Shoulders pattern. That pattern is also present today but on a much larger scale. Hopefully, history repeats itself and the outcome will be the same ;)
Currently, we have a massive Inverted Head and Shoulders pattern. This pattern becomes valid only after a breakout from the neckline. Which has already happened! The price has also tested the neckline, but the movement has remained limited due to the strong resistance zone at $260–$290. Despite this, there has been a minor breakout above this level and from a technical standpoint, the price is currently trading within a potential buying zone for those interested.
Key criteria:
- A bullish Inverted Head and Shoulders pattern is in place.
- The neckline breakout has already occurred.
- A minor breakout above the strong $260–$290 zone suggests further potential.
9. Meta Platforms (META)
"Pause areas" – If someone randomly picks stocks each month, for example, Apple this month, Amazon or Meta next month, then these price levels can be extremely useful for deciding what to buy.
For META, the key picking areas are marked on the chart as reference points for potential pickers:
8. NIO (NIO)
Mentioned three times, and I feel sorry for those expecting a useful analysis on NIO - I don’t have one. Technically, there is nothing to work with here.
The price action is basically dead, moving randomly without any clear structure. Yes, I could draw lines and mark support levels but that would be misleading for both - you and me.
Volume has dropped significantly compared to previous movements. When volume declines this much, previous price levels become irrelevant. As I mentioned at the beginning, if there’s something to analyze, I’ll share it. Right now, there isn’t.
-------------
Closing Section (For TradingView Post), that wraps up the first eight stocks from the picks! I hope you found this analysis valuable but that's not all!
The remaining 7 stocks are now live on my Substack-ENG, including:
🔹 Tesla (TSLA) – Will history repeat itself?
🔹 Amazon (AMZN) – Smart entry levels instead of buying at all-time highs.
🔹 Palantir (PLTR) – The high-risk, high-reward case.
…and four more stocks that were highly requested!
Substack-ENG link is in my BIO (clicking the website icon), or you can find it by scrolling up - just below the main image.
See you there,
Vaido
Disclaimer:
This post is not investment advice, and the ideas presented are not recommendations to buy or sell any securities. It is intended for educational and analytical purposes, reflecting my personal view of the current market situation. Every investor should conduct their own independent analysis and consider the risks before making any decisions.

Golden Pocket March Rally? Downside Gap Fill by 2/28? $SPYA break of the current High would invite a straight shot to the 1.61 Golden Pocket Above. Anything Below leaves room for Election Rally Gap Fill. Keep an eye on the fib. Don't try to be a HERO inside of the box. Wedge forming. March may lead to a large decline. Be wary.

750 dolla spy.gm,
wanted to share my outlook on the stock market today.
---
fear is accelerating. uncertainty is going parabolic in a way we haven’t seen since the covid crash. people are running. insiders are exiting. the herd is collectively turning bearish.
but i’m bullish.
---
here’s exactly why:
-quantitative easing is coming back.
-rate cuts are on the horizon.
-the us dollar is depreciating.
-economic expansion is inevitable.
-the artificial intelligence boom is just getting started.
---
while most people fumble their bag up here, drowning in fear, we look for significantly higher prices into 2026.
---
ps. i left out upside targets and timeframes because none of that matters at the moment. only the structure does. if you like the structure, use it. don't give me any credit. i don’t need it.
if you make a dolla this next year, donate a tenth of it to someone who needs it more than you. the universe will handle the rest.
🌙

Apple (AAPL) Recovers 50% from Recent DeepApple (AAPL) Recovers 50% from Recent Decline – Technical Outlook & Forecast
Apple Inc. (AAPL) has made a strong recovery after experiencing a sharp decline earlier this month. The downturn, which affected several major U.S. tech stocks, was largely triggered by the release of China’s AI model, DeepSeek, on the 21st. However, the broader market has since rebounded, regaining much of the lost ground.
Technical Analysis
AAPL is currently trading at a key technical level, the 50% Fibonacci retracement of its recent decline. This indicates a partial recovery from the previous drop, positioning the stock at a potential decision point for traders.
Support Level: $231
Resistance Level: $260
Current Price Area: Near 50% Fibonacci retracement
Trade Plan
Given the recent recovery, I anticipate a potential pullback before further upward movement. My strategy is as follows:
Entry: Waiting for a pullback to $237
Stop Loss (SL): $231 to limit downside risk
Take Profit 1 (TP1): $260, aligning with resistance levels
Conclusion
AAPL's recovery from its recent dip suggests strong buying interest. However, market volatility remains a factor, so careful risk management is essential. Trade with caution and follow your risk strategy.

AAPL Shares Drop Amid Trump’s Tariffs Despite Strong EarningsAAPL Shares Drop Amid Trump’s Tariffs Despite Strong Earnings
Last week, Apple (AAPL) reported quarterly earnings that exceeded analyst expectations:
→ Earnings per share: $2.40 (expected: $2.35)
→ Revenue: $124.3 billion (expected: $124.2 billion)
Zacks analysts called the results “favourable,” yet Apple’s stock movement tells a different story:
→ On 31 January, shares opened with a bullish gap around $247, briefly improving AAPL’s weak start to the year.
→ By 3 February, the stock closed near $227, marking a 7.4% decline over just two sessions.
The downward pressure on AAPL may be due to:
→ Shifting sentiment around U.S. tech leadership in AI, following the success of Chinese startup DeepSeek’s free chatbot.
→ Trump’s tariffs, particularly the new 10% levy on Chinese imports, which could impact Apple’s future performance.
According to BofA Securities analysts:
→ The impact on profits should be “limited,” as around 80% of Apple devices can be manufactured outside China.
→ AAPL remains attractive, with a “buy” rating and a $265 price target, supported by stable cash flow, strong earnings, and AI-driven opportunities.
Technical analysis of Apple (AAPL) stock shows that the price has been forming a long-term upward channel (marked in blue) since summer 2024, with the following key observations:
→ Bearish perspective: The price has sharply dropped from the upper half of the blue channel (as shown by the arrow), testing a potential bearish breakout of the previous uptrend (marked in black) from late 2024.
→ Bullish perspective: The lower boundary of the channel, around $222, may serve as a key support level, potentially preventing further declines.
Trade on TradingView with FXOpen. Consider opening an account and access over 700 markets with tight spreads from 0.0 pips and low commissions from $1.50 per lot.
This article represents the opinion of the Companies operating under the FXOpen brand only. It is not to be construed as an offer, solicitation, or recommendation with respect to products and services provided by the Companies operating under the FXOpen brand, nor is it to be considered financial advice.

Head & Shoulders reversal pattern: AAPL chartBeautiful symmetric reversal Head & Shoulders pattern is in the making.
We have three peaks with the highest in between called Head.
Left and right peaks are "shoulders".
The line between valleys of the Head is called Neckline.
This pattern reverses the price course at the climax.
Trading technique:
Sell entry is triggered on the breakdown of the Neckline
Stop loss is at the invalidation point - breakup of the Right Shoulder (red dashed line)
Take profit is set at the height of the Head subtracted below Neckline (blue dashed line)

US100 Trade LogUS100 setup: Long position with "1:4 RRR" and "0.5% risk" based on accumulation and gap fill breakout.
- Entry within the "1H FVG" , targeting a push towards the "daily Kijun" .
- Structure confirms a potential continuation move, though risk remains controlled.
- Powell’s recent remarks and market liquidity shifts may fuel volatility.
- Stops placed below the accumulation zone; aiming for an extended move if momentum holds.

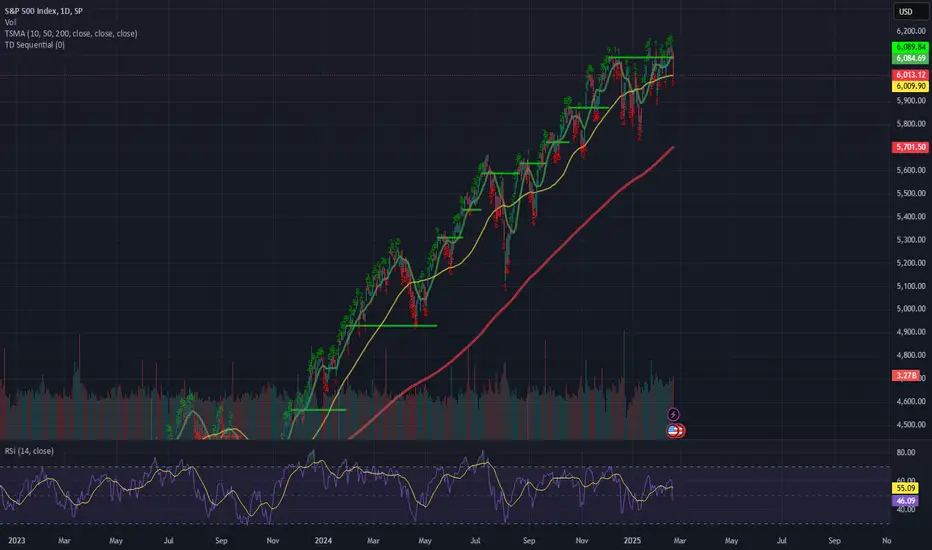
-10% CRASH Bears coming, Bulls, BTD for a Blow off Top $SPYDecline Ahead, we have the exact same chart on the monthly. I guess that means we could have just one month at least of red. This is a weekly chart with the same pattern as the monthly on SPX. I will post it shortly. We have a 9 Count Sell Signal with a 13 Count Follow up. The 14th Candle takes a 10% dip. On several occasions in this candle combo. I will attach a link to another example.

-10 Decline in the next month, Buy the dip for a Blow off top Refer to a Previous Post. Blow OFF TOP COMING. BUT NOT BEFORE A COUPLE OF SCARES. Short the RIP. BUY THE DIP. Patience. 4-6 weeks of 10% moves back and forth... Accumulate the wins for the Longs... Hold for a year... Short everything Mid 26' if it gets that far MCFLY
