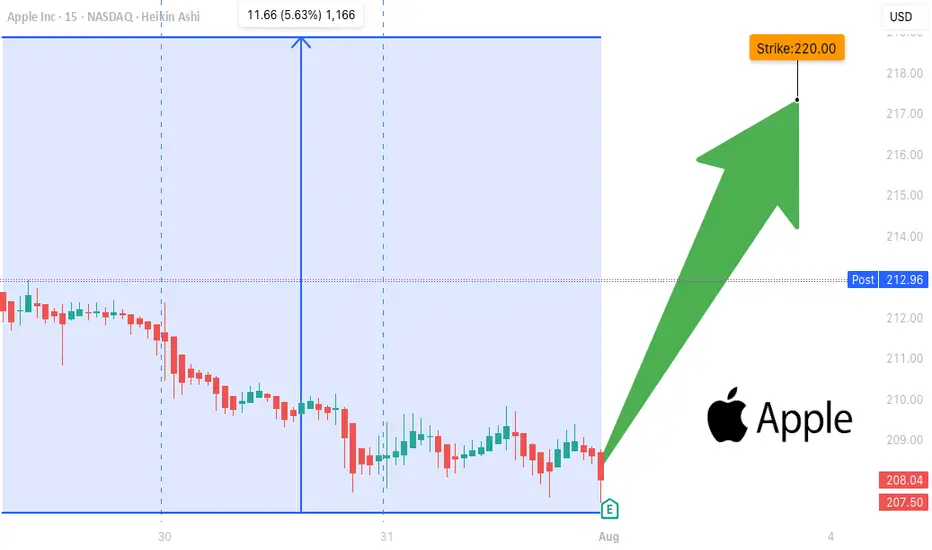
Apple (AAPL) Shares Jump Following Earnings ReportApple (AAPL) Shares Jump Following Earnings Report
Yesterday, after the close of the regular trading session, Apple released its earnings report, which surpassed analysts’ expectations:
→ Earnings per share: actual = $1.57, forecast = $1.43;
→ Revenue: actual = $94.04 billion, forecast = $89.35 billion.
As a result, AAPL shares surged in the post-market, rising from $207.57 to $212.51.
Media Commentary:
→ The company reported a 13% year-on-year increase in iPhone sales.
→ However, according to Tim Cook, tariffs have already cost the company $800 million and this figure could exceed $1 billion in the next quarter.
Technical Analysis of the Apple (AAPL) Stock Chart
Following the volatility in April 2025, price action has justified the construction of an ascending channel (marked in blue). The $216 level, which has acted as a key reference point since March, remains a significant resistance area, because:
→ It has consistently prevented AAPL from reaching the upper boundary of the channel;
→ Even in the wake of a strong earnings report, the price failed to break through this level in post-market trading.
If the $216 level continues to cap gains in the coming days – despite the positive report – the stock might pull back towards the median line of the blue channel (following the post-market rally). This zone often reflects a balance between supply and demand. While such a retracement would appear technically justified, it may raise concerns among shareholders, particularly when compared to the more aggressive price rallies seen in the shares of other tech giants, such as Microsoft (MSFT), as we discussed yesterday.
From a more pessimistic perspective, peak A may turn out to be yet another lower high within a broader bearish structure that has been forming on the AAPL chart since December 2024, when the stock reached its all-time high around the $260 level.
This article represents the opinion of the Companies operating under the FXOpen brand only. It is not to be construed as an offer, solicitation, or recommendation with respect to products and services provided by the Companies operating under the FXOpen brand, nor is it to be considered financial advice.
Aaplanalysis

AAPL EARNINGS TRADE SIGNAL (JULY 31)
### 🍏 AAPL EARNINGS TRADE SIGNAL (JULY 31) 🚀
📊 **AAPL Call Play** — Earnings Strategy
🧠 Multi-model conviction: **75% Bullish Bias**
---
### 🔍 Fundamental Drivers
✅ TTM Revenue: +5.1%
✅ Gross Margin: 46.6%
✅ 8 straight earnings beats
⚠️ Sector shift: growth → value = caution
📉 TTM EPS Est: \$8.31 (+29.4% growth est.)
🧮 **Score**: 8/10
---
### 💰 Options Flow Breakdown
🔥 IV Rank: 0.70
🔵 Bullish OI @ \$220C = 25,950 contracts
🔻 Skew: Heavy puts @ \$197.5 / \$200
⚠️ Gamma squeeze possible near \$220
📈 **Score**: 8/10
---
### 📉 Technicals
📍 RSI: 39.3 (Oversold)
📉 Trading below 20DMA (\$211.64)
🟥 Low volume pre-earnings = low conviction
📌 Support: \$207.5 | Resistance: \$220
📉 **Score**: 6/10
---
### 🌐 Macro Setup
⚠️ Supply chain pressures
⚠️ Regulatory risk ongoing
🔄 Growth → Value rotation still underway
🌐 **Score**: 5/10
---
### 🧠 Trade Setup (Call Option)
* 🎯 **Strike**: \$220
* 💵 **Entry**: \$0.87
* 📅 **Expiry**: 08/01 (2DTE)
* 📈 **Target**: \$2.61
* 🛑 **Stop**: \$0.43
* ⚖️ **Risk**: 2% of portfolio
* ⏰ **Timing**: Enter before close, report after market
🧮 Expected Move: ±5.0%
🔒 Confidence Level: 75%
---
### ⚙️ Exit Plan
✅ Profit: Exit @ \$2.61
❌ Stop: Exit @ \$0.43
🕒 Time Exit: Force close within 2 hours post-earnings
---
📣 **EARNINGS SCALP PLAY**
— AAPL is oversold w/ strong EPS beat history
— Bullish OI stacking at \$220
— High gamma setup, low IV risk = 💥
\#AAPL #EarningsTrade #CallOption #TradingView #0DTE #OptionsFlow #GammaSqueeze #UnusualOptions #AppleEarnings #SwingTrade #TechStocks
AAPL can we hit 260?
Appears we are making a correction down to the levels of 208 then if that does not hold 205 with a possible drive up to the 260.
Question is are we going drive deeper with the correction ?
Be Careful folks this is a wild one
Trade Smarter Live Better
Kris/Mindbloome Exchange

Apple May Dip to $203 FVG Before Resuming UptrendFenzoFx—AAPL (Apple) is bullish, testing the $210.0 resistance while Stochastic warns of an overbought market.
A dip to the bullish FVG at $203.0 is likely before the uptrend resumes.

Apple (AAPL) Shares Consolidate Ahead of WWDCApple (AAPL) Shares Consolidate Ahead of WWDC
Today, 9 June, marks the start of Apple’s Worldwide Developers Conference (WWDC) — an event that traditionally attracts significant attention from investors and traders.
It is fair to say that WWDC 2025 begins against a rather negative backdrop:
→ Since the start of 2025, AAPL stock price has fallen by 19%, and Apple has lost its title as the world’s most valuable company, now trailing behind Microsoft and Nvidia.
→ Expectations raised by last year’s conference — particularly regarding new AI features in the iPhone — were not fully realised. As Barron’s noted, in March, an Apple spokesperson admitted that the new Siri “will take longer than we thought to implement these features. We expect to roll them out next year.”
Technical Analysis of the AAPL Chart
AAPL price movements are forming a narrowing triangle pattern:
→ The red trendline highlights sustained downward pressure on AAPL shares in 2025 — partly driven by concerns over the impact of the ongoing trade war;
→ On the other hand, the area below the psychological $200 level may attract buyers willing to take on risk.
WWDC 2025 could well provide fresh hope for the bulls and prompt an attempt to break out upwards from the triangle pattern.
This article represents the opinion of the Companies operating under the FXOpen brand only. It is not to be construed as an offer, solicitation, or recommendation with respect to products and services provided by the Companies operating under the FXOpen brand, nor is it to be considered financial advice.

Apple (AAPL) share price slips towards psychological $200 levelApple (AAPL) share price slips towards psychological $200 level
Yesterday, Apple shares (AAPL) fell by 2.5%, edging closer to the key psychological threshold of $200. Moreover, the stock is underperforming the broader market, which reached new highs earlier this week — a move AAPL has yet to replicate.
Why is AAPL’s stock price declining?
According to media reports, investors may have grown concerned after OpenAI acquired a startup founded by Jony Ive, Apple’s former chief designer, for $6.5 billion.
The move is being interpreted as OpenAI’s first step toward launching a physical AI-powered device — one that could, eventually, pose a challenge to Apple’s hardware, even if not in the near term.
Technical analysis of the AAPL chart
Bulls may be hoping the AAPL price finds support at the confluence of two key levels:
→ the psychological $200 mark;
→ support from the second half of May (the lower blue trendline).
However, the broader technical context raises some bearish concerns:
→ the $215–222 zone, which previously acted as support, is now capping price advances (as highlighted by the arrows);
→ the red descending channel appears to define the current trend trajectory — and its relevance may be reinforced if the price drops and consolidates near its median line, signalling a balance between buying and selling pressure.
This article represents the opinion of the Companies operating under the FXOpen brand only. It is not to be construed as an offer, solicitation, or recommendation with respect to products and services provided by the Companies operating under the FXOpen brand, nor is it to be considered financial advice.

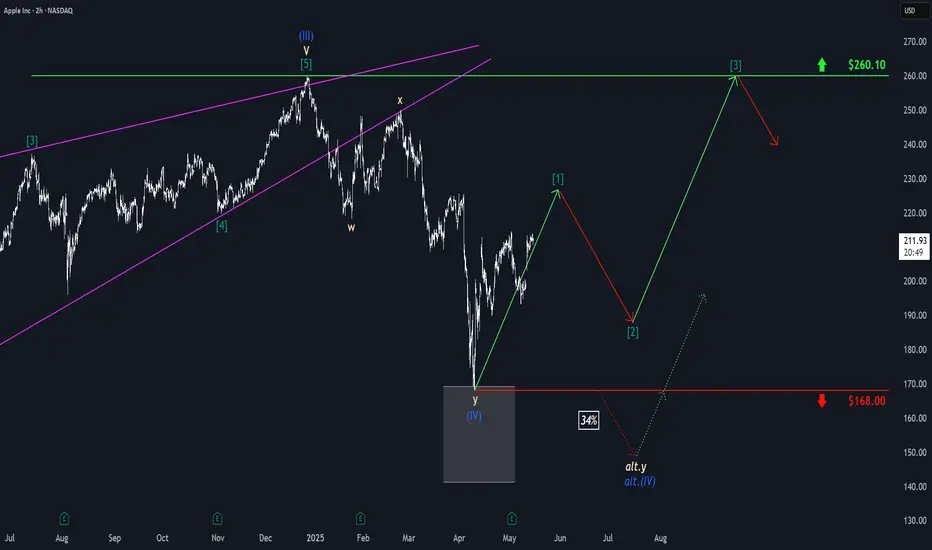
Apple: Wave [1] IntactDespite a significant setback, Apple managed to gather new momentum on the upside and continue its work on the green wave . The impulse structure remains intact, and we expect a new high imminently before the next countermovement with wave follows. The stock should not breach the support at $168 to enable wave to initiate the next upward phase. If the price does fall below the $168 mark, our 34% likely alternative scenario will allow for a new low of wave alt.(IV) in blue, though the rise would also continue after this lower low.
Apple Shares (AAPL) Drop Below $200Apple Shares (AAPL) Drop Below $200
Late last week, Apple released a quarterly report that beat analysts’ expectations:
→ Earnings per share: actual = $1.65, forecast = $1.63
→ Revenue: actual = $95.36bn, forecast = $94.5bn
However, today AAPL stock price is below the psychological $200 mark, over 7% lower than last week’s high (point E).
Why did AAPL shares fall?
According to media reports, investors were concerned about weaker-than-expected services revenue and disappointing sales in China. These factors have renewed fears that the ongoing US–China trade tensions could have a deeper impact on Apple going forward.
Bearish sentiment may also have been amplified by Warren Buffett’s decision to step down as head of Berkshire Hathaway — as we noted yesterday — since his company is one of Apple’s major shareholders.
Technical Analysis of Apple Shares (AAPL)
Key AAPL price action patterns (marked) show a sequence of lower highs and lows, forming the basis for a downward channel. Fibonacci ratios reinforce bearish characteristics in price movements:
→ The rise from B to C is approximately 50% of the decline from A to B
→ The rise from D to E is around 50% of the decline from A to D
This technical picture suggests a potential bear market, where rallies may be corrective rebounds following impulsive drops. This strengthens the scenario in which AAPL shares could continue falling within the established descending channel.
This article represents the opinion of the Companies operating under the FXOpen brand only. It is not to be construed as an offer, solicitation, or recommendation with respect to products and services provided by the Companies operating under the FXOpen brand, nor is it to be considered financial advice.

Apple (AAPL) Shares Plummet Over 9% Following Trump's TariffApple (AAPL) Shares Plummet Over 9% Following Trump's Tariff Announcement
Many stock indices declined after the US President announced the introduction of tariffs for multiple countries, as we reported yesterday morning. During yesterday’s trading session, the sell-off in equities intensified.
According to media reports, market participants had hoped that the tariff threats were mere rhetoric and a negotiation tactic. However, many were shocked by both the number of countries affected and the scale of the imposed tariffs. Several well-known technology companies led the market downturn.
How Do Trump's Tariffs Impact Big Tech Companies?
Significant tariffs were imposed on Chinese imports, yet Apple manufactures around 90% of its iPhones in China. Many affordable products sold on Amazon are also set to become more expensive, as they are sourced from China.
Meta Platforms' advertising business could suffer considerable losses as companies worldwide cut advertising budgets. Nvidia and Broadcom may also struggle, given that the tariffs apply to many electronic devices incorporating their chips.
As a result, shares of Apple (AAPL), Amazon (AMZN), Meta Platforms (META), Broadcom (AVGO), and Nvidia (NVDA) fell by approximately 9% by the close of trading yesterday.
Microsoft (MSFT) shares, however, proved more resilient, dropping just 2.3%, as software products are not easily subject to tariffs. Moreover, software developers do not rely on international supply chains.
Technical Analysis of AAPL Chart
Apple’s stock price fluctuations have formed a trend channel (shown in blue), with:
→ The upper boundary acting as resistance since last autumn, although bulls managed to push the price above it during the Christmas rally. We previously highlighted Apple’s overbought condition and the possibility of a correction on 27 December 2024.
→ New data indicates that resistance has now shifted to the median at around $225.
This puts the lower boundary of the trend channel at risk of a bearish breakout. In the coming days, AAPL’s chart may see a bearish assault on the psychological $200 level, which proved significant in August 2024.
This article represents the opinion of the Companies operating under the FXOpen brand only. It is not to be construed as an offer, solicitation, or recommendation with respect to products and services provided by the Companies operating under the FXOpen brand, nor is it to be considered financial advice.

APPLE, will we see 200$ again ?Hello traders, Hope you're doing great. What are your thoughts about NASDAQ:AAPL ?
for upcoming weeks, I expect an upward correction at first and after that I expect a SELL OFF situation in the market that causes a huge drop in stock market, my first Target is 200$.
This post will be Updated.
Trade Safe and have a great week.

Apple (AAPL) Share Price Drops Over 7% in Two DaysApple (AAPL) Share Price Drops Over 7% in Two Days
As previously reported, AAPL shares had their worst January since 2008, but the challenges for investors have continued. The Apple (AAPL) stock chart shows that:
- Yesterday, the price dropped below $218 during trading—the lowest level since September last year.
- Compared to Friday’s closing price, the decline over the first two days of this week amounted to approximately 7.7%.
Why Has AAPL Stock Fallen?
Yesterday, we noted that bearish sentiment was prevailing in the stock market, leading the Nasdaq 100 index into correction territory. Market conditions were further dampened by news that Apple had delayed the release of an AI-powered update for its digital assistant, Siri 2.0, increasing selling pressure.
What Could Happen Next?
Technical Analysis of Apple (AAPL) Stock
Key price reversals, marked with red dots, outline a downward channel (shown in red). The median line, which previously acted as support (indicated by an arrow), has now been broken, suggesting that bears may expect it to act as resistance going forward.
From a bullish perspective, the lower boundary of the red channel, reinforced by the September low around $214, could serve as an area where selling pressure might ease—if AAPL continues to decline.
AAPL Share Price Forecast
According to TipRanks:
- 18 out of 33 surveyed analysts recommend buying AAPL stock.
- The average 12-month price target for AAPL is $251.
This article represents the opinion of the Companies operating under the FXOpen brand only. It is not to be construed as an offer, solicitation, or recommendation with respect to products and services provided by the Companies operating under the FXOpen brand, nor is it to be considered financial advice.

Apple: Top and DropAs part of Apple's ongoing wave (2) correction, we assume that the subordinate turquoise wave X still needs to conclude in the short term before the price can drop into our magenta Target Zone between $209.57 and $196.05. There, we anticipate a bullish reversal, which should offer trading opportunities for the long side and mark the starting point for the next major upward move. Alternatively, there is a 37% chance that the low of wave alt.(2) has already been reached, which will be confirmed if the price surpasses $260.10.

AAPL Shares Drop Amid Trump’s Tariffs Despite Strong EarningsAAPL Shares Drop Amid Trump’s Tariffs Despite Strong Earnings
Last week, Apple (AAPL) reported quarterly earnings that exceeded analyst expectations:
→ Earnings per share: $2.40 (expected: $2.35)
→ Revenue: $124.3 billion (expected: $124.2 billion)
Zacks analysts called the results “favourable,” yet Apple’s stock movement tells a different story:
→ On 31 January, shares opened with a bullish gap around $247, briefly improving AAPL’s weak start to the year.
→ By 3 February, the stock closed near $227, marking a 7.4% decline over just two sessions.
The downward pressure on AAPL may be due to:
→ Shifting sentiment around U.S. tech leadership in AI, following the success of Chinese startup DeepSeek’s free chatbot.
→ Trump’s tariffs, particularly the new 10% levy on Chinese imports, which could impact Apple’s future performance.
According to BofA Securities analysts:
→ The impact on profits should be “limited,” as around 80% of Apple devices can be manufactured outside China.
→ AAPL remains attractive, with a “buy” rating and a $265 price target, supported by stable cash flow, strong earnings, and AI-driven opportunities.
Technical analysis of Apple (AAPL) stock shows that the price has been forming a long-term upward channel (marked in blue) since summer 2024, with the following key observations:
→ Bearish perspective: The price has sharply dropped from the upper half of the blue channel (as shown by the arrow), testing a potential bearish breakout of the previous uptrend (marked in black) from late 2024.
→ Bullish perspective: The lower boundary of the channel, around $222, may serve as a key support level, potentially preventing further declines.
Trade on TradingView with FXOpen. Consider opening an account and access over 700 markets with tight spreads from 0.0 pips and low commissions from $1.50 per lot.
This article represents the opinion of the Companies operating under the FXOpen brand only. It is not to be construed as an offer, solicitation, or recommendation with respect to products and services provided by the Companies operating under the FXOpen brand, nor is it to be considered financial advice.

Apple (AAPL) Stock Price Analysis: Worst Start to the Year SinceApple (AAPL) Stock Price Analysis: Worst Start to the Year Since 2008
On 27 December, while analysing Apple (AAPL) stock, we noted: "Traders should consider the possibility of a pullback below the key psychological level of $250, with the price potentially retreating to the lower purple boundary."
A month later, Bloomberg reports:
→ By the close of trading on Friday, 24 January, the company's shares had fallen 11% since the start of 2025, marking the worst performance among the "Big Seven" companies.
→ This represents the worst start for AAPL shares since 2008, when the global financial crisis was in full swing.
→ Apple has also significantly underperformed the S&P 500, which has risen approximately 3.7% this year and hit a new record high earlier this week.
Can the bulls reverse this disappointing trend?
Technical Analysis of the AAPL chart shows:
→ The price remains within a broad ascending channel (which began in June when the company unveiled its Apple Intelligence tools), but it has now fallen into the lower half of the channel.
→ After briefly dipping below the November low at $219.50, the price recovered – a bullish sign of a Liquidity Grab, suggesting that Smart Money may be turning bullish.
Given this, it is reasonable to expect the downward trend to weaken, with market participants likely adopting a wait-and-see approach ahead of the company’s quarterly earnings report, scheduled for 30 January.
Wall Street analysts are optimistic, forecasting earnings of $2.35 per share and gross revenue of $124.2 billion (compared to $0.97 per share and $94.93 billion in the previous quarter).
Trade on TradingView with FXOpen. Consider opening an account and access over 700 markets with tight spreads from 0.0 pips and low commissions from $1.50 per lot.
This article represents the opinion of the Companies operating under the FXOpen brand only. It is not to be construed as an offer, solicitation, or recommendation with respect to products and services provided by the Companies operating under the FXOpen brand, nor is it to be considered financial advice.

Apple: As Expected…Apple has made progress as part of our primary scenario, gradually edging lower toward our magenta Target Zone between $209.57 and $196.05. In this price range, we anticipate the low of the magenta wave (2) and, subsequently, a reversal to the upside. On the other hand, we consider it 37% (previously 40%) likely that AAPL will stage an immediate breakout above the resistance at $260.10 without first reaching our Target Zone.

Apple (AAPL) Stock Price Drops Below $240Apple (AAPL) Stock Price Drops Below $240
The last time Apple (AAPL) stock traded below the $240 mark was in late November last year.
Bearish sentiment is being driven by negative news surrounding the company:
→ CNBC reports analysts' views that the excessively thin design of the new iPhone SE 4 models will complicate sales in China. The analysts also note a decline in the appeal of the Apple Intelligence feature.
→ Investment firm Moffett Nathanson downgraded Apple’s stock rating from "Neutral" to "Sell" and lowered its target price for AAPL from $202 to $188. According to analysts, the 30% growth in Apple stock for 2024 is largely unjustified.
→ Criticism from Mark Zuckerberg, who believes that Apple has not invented anything groundbreaking for a long time.
As we mentioned on 27 December, Apple’s stock appeared overbought and vulnerable to a correction.
Technical analysis of the AAPL chart today shows that the price has dropped to:
→ The median of the current channel (marked in blue);
→ The $235 level, which previously acted as resistance.
Therefore, it is plausible that in the short term, this block formed by these two lines may provide support to the falling price. This hypothesis is supported by the long lower wick on Friday’s candle, indicating increased buyer activity.
According to TipRanks:
→ Analysts' 12-month price target for AAPL stock averages $244.77;
→ Of 29 analysts surveyed, 19 recommend buying AAPL stock, while 3 recommend selling.
This article represents the opinion of the Companies operating under the FXOpen brand only. It is not to be construed as an offer, solicitation, or recommendation with respect to products and services provided by the Companies operating under the FXOpen brand, nor is it to be considered financial advice.

Apple (AAPL) Stock Ends the Year Near Record HighsApple (AAPL) Stock Ends the Year Near Record Highs
In 2024, Apple Inc. (AAPL) shares surged by approximately 35%, fueled by the introduction of Apple Intelligence, a groundbreaking AI technology integrated into the company's ecosystem. This feature, designed for iPhones and other Apple products, enhances both productivity and user experience.
Following the June launch of Apple Intelligence, AAPL stock price saw a sharp rise (indicated by the arrow), marking the beginning of a steady upward trend within a channel (highlighted in blue) that remains intact.
In early August, a sell-off in Japan's stock market and fears of a global recession defined the channel's lower boundary.
The stock subsequently rebounded, with prices fluctuating around the channel's central line (bolded) throughout autumn. This balance signified equilibrium between buyers and sellers.
As 2024 comes to a close, AAPL shares exhibit a strong upward momentum, resembling a Santa Claus rally. A new, steeper upward channel (depicted in purple) has emerged on the chart.
Analyst Predictions and Market Sentiment
Analysts are optimistic about AAPL’s prospects. Daniel Ives of Wedbush recently raised his price target for AAPL from $300 to $325, citing the underappreciated potential of Apple's AI initiatives. Ives believes the company is entering a multi-year iPhone upgrade cycle, driven by artificial intelligence integration.
Looking ahead to 2025, analysts project record-breaking iPhone sales of approximately 240 million units, marking a historic achievement for Apple. This momentum could drive AAPL shares to new highs. While the long-term outlook is positive, near-term risks remain.
Current technical indicators suggest AAPL may face a short-term correction:
- The price is approaching the upper boundary of the channel.
- The RSI indicates overbought conditions, with signs of a potential bearish divergence.
Traders should consider the possibility of a pullback below the key psychological level of $250, with the price potentially retreating to the lower purple boundary.
TipRanks Insights:
- Analysts’ average price target for AAPL by the end of 2025: $245.28.
- Among 29 analysts, 19 recommend buying, while 2 suggest selling.
This article represents the opinion of the Companies operating under the FXOpen brand only. It is not to be construed as an offer, solicitation, or recommendation with respect to products and services provided by the Companies operating under the FXOpen brand, nor is it to be considered financial advice

AAPL trendline breakdown possible . US Stock216 below trendline breakdown possible
expecting 205 can test soon
what is your view

BUY AAPL Apple at current levels (175 to 176) for T1 180 T2 195BUY AAPL Apple at current levels for T1 180 T2 195
Its less than 2 minute video where I have explained the entry and stop loss
Expecting the target to be achieved in a month or 2

AAPL Technical Analysis and Trade IdeaOn the monthly time frame, #AAPL exhibits a bullish trend with a recent retracement into an equilibrium zone. As we delve into lower timeframes, a base formation becomes evident. Specifically, we observe a double bottom setup followed by a break below the previous lows, a robust rally, and subsequently, a higher low formation.
As we continue analyzing the shorter timeframes, we notice a potential shift in the current downtrend. This change in character suggests the possibility of a structural break. My focus lies on identifying a buy opportunity if we witness a breakout and subsequent retest of the previous high on the 15-minute timeframe.
However, it’s paramount to acknowledge the inherent risks associated with trading. Always conduct thorough research, considering both fundamental market drivers and the broader macroeconomic landscape, in addition to your technical analysis. Implement sound risk management strategies to safeguard your capital.
Disclaimer: This analysis provides a technical perspective on AAPL and should not be construed as investment advice. Tailor your trading decisions to your specific risk tolerance, informed by comprehensive market research and a holistic assessment of all relevant factors.

🍏💻 Apple Inc. (AAPL) Analysis 🌐📱📊 Industry Impact:
Apple, a technology giant, known for smartphones, tablets, and smart devices.
🔄 Customer Retention:
Ability to retain existing customers and attract new ones evident.
Half of recent Mac and iPad buyers were new to those products.
🚀 Innovation and Product Launch:
Continuous innovation highlighted by the upcoming Apple Vision Pro spatial computer.
Vision Pro mixed-reality headset set to launch early next month.
💡 Market Positioning:
Initial pricing challenge at $3,499 for widespread adoption.
Positions Apple as a significant player in the virtual reality (VR) and Metaverse space.
📈 Market Analysis:
Bullish outlook on Apple (AAPL).
Suggested entry above the $172.00-$174.00 range.
🎯 Upside Target:
Upside target set in the $230.00-$240.00 range.
📣 Conclusion:
Apple's innovation and market positioning contribute to a positive outlook.
Entry suggestion and upside target align with potential growth in the tech sector.
Stay informed for evolving developments! 📰💹 #AppleInc #AAPLAnalysis #TechMarket 🌐📊

Apple(AAPL)- Weekly Forecast is Bullish Technical Analysis:
- Apple is doing now wave ((3)) in black
- H1 right side is turning down
- H4 right side is up
Technical Information:
- If you're a swing trader, you can buy wave ((4)) in black when it completes ABC correction
- For position trader , you must wait for wave II in red to complete in next 6 months

AAPL ~ Snapshot TA (Daily / Nov 2023)NASDAQ:AAPL chart mapping/analysis.
Clear breakout of descending parallel channel (white).
Bull target(s)
Overhead gap fills
Previous ATH (~197.70)
Ascending trend-line resistance (green dotted)
Upper range of ascending parallel channel (light blue)
Bear target(s)
Descending parallel channel (white) aka "return to scene of crime"
23.6% Fib
Ascending trend-line (green dotted) + 38.2% Fib confluence support zone
Descending trend-line (white dotted)
