#AAPL - UPDATED EMA CHART Updated chart providing a more elongated perspective on the definitive trend line.
Its more than obvious that when the price intersects the ema you have a significant
bullish upswing. The breakouts are substantial usually occurring over a 30 bar period
with the most significant movement occurring from June 29th, through July 13th.
Prior movements from the intersecting points (since March) have a included
a $27 gain from June 4th, through June 11th, and a $29 gain from June 15th,
through June 23rd.
In this chart the line only dips below the intersecting ema 4 times (since March)
and averaged less than a $3 drop over a period of 2-3 days.
The chart maybe simple, but it makes abundantly clear when to buy.
Aaple


ANALYZE: AAPLafter all i notice on the chart my probability the trend go up to test the resistance line

ANALYZE: AAPLafter all i notice on the chart high probability the trend go up to test the support line


AAPL at historical equilibrium!!! (Vibrational Analysis)I see markets are like a song and they create a vibration which can be visually observed as trend curves going up and down an equilibrium. Price has a tendency to move inside the vibration which would be low energy state.
Now when the price breaks outside the vibration, which I term as a deviation, this has an important impact on the future structure of the vibration, acting like an external force.
My entire concept is pretty deep and I wouldn't be able to share my entire philosophy here. However, though this chart I have tried to give a glimpse of this methodology. Pretty well if it makes sense to you.
So currently as per my analysis, as you will see in this chart, price is at the historical equilibrium. If this equilibrium turns into a support, we would be entering a huge bull cycle with an aim of $2500 per Apple share.


Apple $AAPL "Long Term Outlook"I have checked the historical trend and expect a major pull back in 2022
12 months Consensus Price Target: $314.83
if you find my charts useful, please leave me "like" or "comment".
Please don't trade according to the ideas, rely on your own knowledge.
Thx


APPLE LONG Trading PlanApp Store revenue is booming as people stay at home. Analyst expects increased App Store downloads and in-app purchases to bring in an extra $500 million in revenue for Apple's third fiscal quarter. And if that revenue is driven mostly by subscriptions, as has been increasingly the case for Apple, it could mean a permanent step up in revenue for the high-margin services business.
Key Trading Plan:
i) LONG when the price reaches the pull back area at 326.14 with the target Take Profit point at 360.
Author:
S.I.D. Aizu

AAPLL, Trade Between The Lines, Continuation After Confirmation!Hello Traders Investors And Community and welcome to this analysis about the recent events, the current price-structure and what we can expect the next times in the stock with the largest market-cap at the moment AAPLE! As we have seen massive supply entering the last hours and days in all important global markets due to new corona-fears resulting of a second wave and the following economic damage which can affect the markets similar to the beginnings in march, we need to keep in mind that the corona-crisis isn't over yet and that the real economy is still struggling to conform to the status quo seen before the crisis. The last weeks the stock could gain in percentage and also developed a new a-t-h but that can change according to technical signals I detected therefore it is principal to look at the 4-hour local timeframe.
As we can examine when looking at my chart now is that the stock established three uptrend lines in the prior developed uptrend from which two already broken to the downside and the third remaining now. Such a structure can signal a reversal when the third and final trendline is broken as each trend-line signals one step to the final destination into a bearish environment. Currently, the price maintains still above the uptrend line marked in blue and it is also possible that it will consolidate even make some up bounces there but the possibility is very marginal that it holds this trend-line for ever therefore when it is broken to the downside we can expect more supply entering the market and a test remaining of the all-time-high level we have at 325 which will be an important test of the supply/demand ratio within the stock.
When the trendline is broken and we are approaching the all-time-high support which we currently still have in the structure it is highly important to hold that level to establish the condition we have seen in the stock before and to confirm a possible reversal to the upside otherwise when this does not happen and the stock confirms below this level this will cause extreme bearish pressure in the market and is possible to trade on the short-side. Within the indicator-side, we have the RSI which approached the overbought region which can indicate a reversal to lower levels in the RSI-value. Overall the current environment is sending strong bearish signs which can be realized when the proper scenarios confirm as mentioned otherwise we need to establish support at the meaningful support-lines in the range to hold the condition.
The whole stock market is in a shaky position where it is possible to decline further due to corona-fears, as already mentioned it is still possible that the bear-market established this year is not over already and that we could just trade in a big and significantly devastating bull-trap. I know most people want to believe in the bull-market and it is better for investors but we should always look at the market as rational as possible and assess it as best as we can this means to be attended for a possible downturn in the market when the bullish case does not develop and important support-levels hold when we make provisions in such a direction we can take better advantage of incoming opportunities arising out of every circumstance which is the essence for a good monetary perspective and success within markets.
In this manner, thank you for watching, support for more market insight, have a good weekend and all the best!
Information provided is only educational and should not be used to take action in the markets.

Signals for 12/06/2020Hey guys, me again. Let us take a look at some signals for Friday.
EURUSD – On h1, you can see that the price was in a consolidation, and broke out with a bearish impulse. I’d say the price is either going to test the range’s support and fall down, put a target at 1.1250, or break through, test the support from above and go up until at least the top of the range, in which case that a target at 1.1380 and the second at 1.14
GBPUSD – we can see that the price tried to bounce from a support at 1.26, it tried for a false breakout, that’s a pretty bullish signal, so if the price holds above 1.2640, long with a target 1.27
AUDUSD – there’s an impulsive breakout out of a range, so think euro, either a pullback and bounce, or it goes back in then grows. Targets are 0.68 and 0.67 for short, and 0.70 for long.
OIL – also pretty bearish. A reversal model occurred. I’m waiting for a pullback and fractal at 37, and then I’ll short with goals at 34 and 31.50.
AAPL – let’s wait for the price to react to the level at 320-325. If the price bounces – long with a target at 350, and if it impulses below and pulls back, short with a target at around 300.
FB – the price is in a range between 225 and 240. If it impulses down and holds below the range, short with a target at 220 and the second at 215. Also, if there’s a breakout, and then the price goes back inside the range, you can long with a goal at 240.
CLDX – We can see important levels at 10, 8.50 and 7. If the price holds below 8.50, you can short with a goal at 7, and the second around 6.
For more signals, subscribe to our youtube chanel
www.youtube.com
That’s about it. I hope you found this useful, and best of luck in trading.

AAPL - GREAT Short Opportunity, IF ... !!!Hello! Friends,
- We see a nice breakout on hourly chart .
-This would be a great short Opportunity, IF the price breaks down the support line (at $303.11) !!


APPLE $AAPL cleared the cup w handle Apple cleared $288.25 on last Thursday. First target price will be pivot if it holds above where it just broke

AAPL Didn't Follow AMZN, GOOG & FB. 1212 Unlikely Now. Bearish?So AAPL didn't follow AMZN, GOOG and FB, following the realease of the earnings report. Here is AAPL with extended hours prices. Both counts are valid but we channel well here. You know what that means (=likely corrective).

AAPL (Apple) - Completly new to this world... Just need advice.Hi, hope you're having a positive day!
I saw this 3 interesting patterns on h1 ( AAPL ), i just want to know what do you think:
-The BAT (a) pattern has nearly reached its first target (0.382).
-The CYPHER (b) pattern has reached its 2 targets (0.382 and 0.618).
-The BAT (c) pattern is still forming, im waiting for a D on 0.886...
Am i crazy?
If you see some errors let me know, i appriciate.
Thanks for giving me your time and attention, have a lovley and profitable day!
*Disclaimer : do not use my graph for trading on the real market,
im completly unexpert in this sector,
i do not take any responability if you are going to ignore my disclaimer.

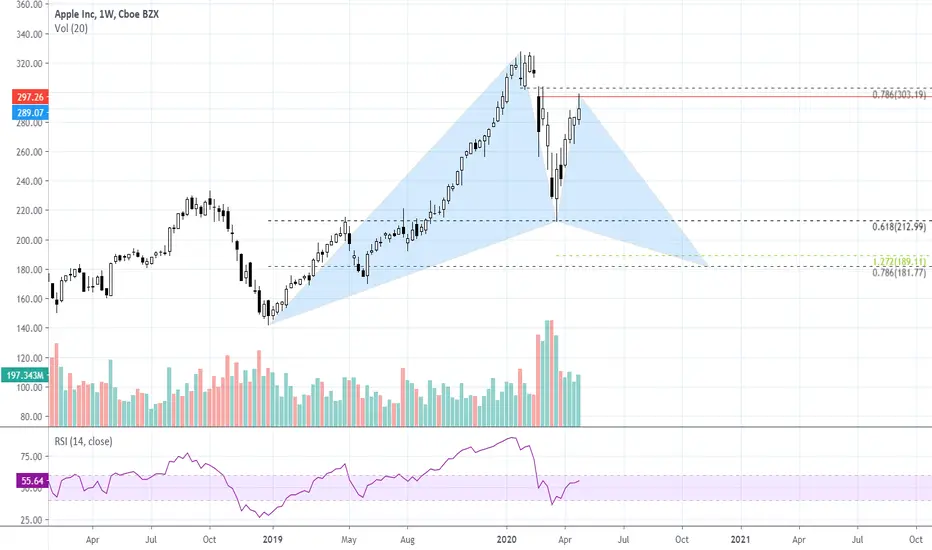
APPLE INC/ Big bullish potential willing to reach the price 304-The market has a big bullish potential willing to reach the price 304.18 (our next Fibonacci level).
-Strong buy signal
