ALTCOINS | ALTSeason | Buy Zones PART 3⚜TRX
TRX has been really strong over the past few days, continuously making higher lows which is early signs of a bullish sentiment. Though, I would want to see the price hold the highlighted support zones before making any decisions. A close UNDER would likely lead to a lower drop.
In that case, I'd be willing to buy at 0,22:
⚜GRT
GRT I'd be looking to buy very low, between the two following prices:
⚜RNDR
Render has bounced from the first buy-zone, but it seems likely we'll retest again soon since the bounce did not equate to a reversal:
⚜MAKER
Optimistic longer term on this coin. Strong decline, lower buy likely here:
⚜AAVE
Strong short-term bearish sentiment, weighted heavier towards the lower zone:
Make sure you don't miss part 1 and part 2 !!
Aave

Can #AAVE Bulls Sustain the Current Momentum? Key Levels Yello, Paradisers! #AAVE looks bullish on the surface—but is this setup quietly setting up for a brutal dump? Here's the key level that will trigger the next big move:
💎#AAVEUSD is currently trading around $143.66, holding inside a clear ascending channel on the 4H timeframe. The price action of #AAVE has been respecting both the ascending support and resistance trendlines, forming higher lows and higher highs—but momentum is fading.
💎A bearish divergence on the momentum oscillator is signaling early weakness despite the price climbing higher. This divergence usually marks the beginning of a bull trap, where the price appears strong just before a sharp reversal.
💎The immediate resistance to watch is in the $156. This is where price was recently rejected, near the upper channel trendline. Above that, $156 remains the key Bearish Setup Invalidation level. A breakout and hold above this would invalidate any bearish structure and could lead to a push toward $170+.
💎However, if AAVE breaks below the ascending support, currently near $140, it opens the door for a sharp drop. The first target is the $126.10 support zone, followed by the $114.35 level, which aligns with a strong historical demand area.
Play it safe, respect the structure, and let the market come to you. Discipline, patience, and strategy are what separate long-term winners from short-term gamblers
MyCryptoParadise
iFeel the success🌴

AAVE DAILY ANALYSISHi friends,
Today, we analyze AAVE in the Daily time frame.
As we had its analysis in the past weeks, the downtrend channel is still holding the price.
We have a good entry point for long positions at $156, which needs confirmation that it has broken the downtrend channel from the upper side.
Also, as mentioned in the past analysis, we have a strong accumulation area ranging from $118 to $150.
Also, the level of $118 is ideal for short positions, which in such cases, if the channel is broken from its Lower Side, we may have parabolic moves towards down.
For spot trading, we have the level of $195, which is a key turning level for gaining its bullish momentum.
As you can see, the volume has been going up in the last couple of weeks.

Important section: 155.69-180.14
Hello, traders.
If you "Follow", you can always get new information quickly.
Please click "Boost".
Have a nice day today.
-------------------------------------
(AAVEUSDT 1M chart)
The important support and resistance section is 155.69.
If it falls without support at 155.69, it is likely to fall to around 81.44.
If it rises with support at 155.69, it is expected to rise to around 332.71.
The 155.69 point is the HA-High indicator point on the 1M chart.
-
(1W chart)
If it falls from 155.69,
1st: 115.70
2nd: 64.26-81.44
We need to check for support near the 1st and 2nd above.
If it rises from 155.69,
1st: Fibonacci ratio 0.236 (202.92)
2nd: 302.67
We need to check for support near the 1st and 2nd above.
This shows that the area around 155.69 is an important support and resistance area.
-
(1D chart)
Therefore, the area we should be interested in is checking for support near 155.69-180.14.
Since the OBV indicator is renewing the low line, the key is whether it can rise above 155.69 this time.
Therefore, if possible, when it is confirmed to be supported near 180.14, it is the time to buy.
An aggressive buy is when it rises above 155.69 and receives support.
If it fails to rise above 155.69, if possible, it is recommended to not buy and watch the situation.
-
Thank you for reading to the end.
I hope you have a successful transaction.
--------------------------------------------------
- This is an explanation of the big picture.
I used TradingView's INDEX chart to check the entire range of BTC.
I rewrote it to update the previous chart while touching the Fibonacci ratio range of 1.902 (101875.70) ~ 2 (106275.10).
(Previous BTCUSD 12M chart)
Looking at the big picture, it seems to have been following a pattern since 2015.
In other words, it is a pattern that maintains a 3-year bull market and faces a 1-year bear market.
Accordingly, the bull market is expected to continue until 2025.
-
(Current BTCUSD 12M chart)
Based on the currently written Fibonacci ratio, it is displayed up to 3.618 (178910.15).
It is expected that it will not fall again below the Fibonacci ratio of 0.618 (44234.54).
(BTCUSDT 12M chart)
I think it is around 42283.58 when looking at the BTCUSDT chart.
-
I will explain it again with the BTCUSD chart.
The Fibonacci ratio ranges marked in the light green boxes, 1.902 (101875.70) ~ 2 (106275.10) and 3 (151166.97) ~ 3.14 (157451.83), are expected to be important support and resistance ranges.
In other words, it seems likely to act as a volume profile range.
Therefore, in order to break through this section upward, I think the point to watch is whether it can rise with support near the Fibonacci ratios of 1.618 (89126.41) and 2.618 (134018.28).
Therefore, the maximum rising section in 2025 is expected to be the 3 (151166.97) ~ 3.14 (157451.83) section.
To do that, we need to look at whether it can rise with support near 2.618 (134018.28).
If it falls after the bull market in 2025, we don't know how far it will fall, but considering the previous decline, we expect it to fall by about -60% to -70%.
So, if the decline starts near the Fibonacci ratio 3.14 (157451.83), it seems likely that it will fall to around Fibonacci 0.618 (44234.54).
I will explain more details when the downtrend starts.
------------------------------------------------------

AAVEUSDT 3DAAVE ~ 3D Analysis
#AAVE Buy from this after successfully testing this support with a short -term target of at least 10%+.

AAVE Trying To Bottom 🚨AAVE is looking beautiful 🚨, very interesting chart for more upside
and is now into support and trying to bottom
Do not miss out on AAVE as this is a great opportunity
Watch video for more details

AAVE Longterm pickNot going to dive too deep, but I genuinely believe DEFI is set to explode in the future! AAVE is definitely one of my favorites, along with UNI and a couple of others that are on my radar. Anyway,
Looking at the long-term Fibonacci targets, they suggest (850-1300-1750) will happen eventually. I’m not sure how long it will take, but I’m all about keeping my eyes on the prize!
What are your thoughts? Let’s get a discussion going! Don’t forget to like and share! 🚀💥

AAVE DAILY ANALYSISHi guys,
Today we are analyzing AAVE in the Daily time frame, as marked on the chart, we have an important daily support level at $156, also we have A 16% accumulation area for buyers.
Also, as marked on the chart, we have a downtrend channel and a key turning level at the price of $195, which is a perfect entry for long positions and spot purchasing.

AAVEUSD Bowl Structure 1000+ An idea showing a large rounded bowl structure with all that's left to come is the bull run side of the bowl
I expect AAVE to go above 1000+ this bull run as per the label
Weekly timeframe for this one.

bonus buy too many tokens, too cheap prices. buy coins with utility. AAVE is in Trump portfolio.
$160 & $130 looking very fetching~

Looking for LongAAVE is forming steeper flag to make a corrective formation before making a big momentum for the upside, target expecting to reach at $800

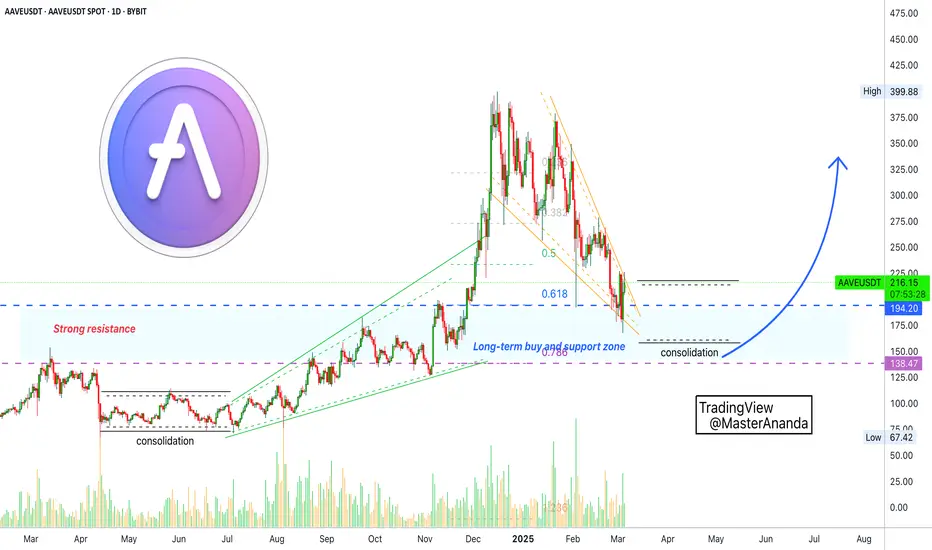
Aave Update: All-In, Think Long-TermOur last entry for AAVEUSDT was in November 2024 around the 150$ price range. This zone is about to be activated again. It is not fully certain but if it is indeed activated, clearly shown on the chart, there is an opportunity to go All-In, with a high probability of success.
Aave grew nicely, strongly and hit a top of $400. Going back to $150 is a huge correction that amounts to 62%. The actual correction is already really strong, the low at $167 totaled -58%.
Don't look much further down. Do not pin your hopes on forever down, lower lows. The truth is that a strong rise is balanced out by a correction, but a correction is a correction and nothing more. It tends to end in a higher low.
In this chart, I am showing you the long-term buy and support zone. This is the price at which one should go LONG.
First, start with a small amount of lev. As we get closer to the breakout, go All-In. We are getting closer by the day.
We might have only a few days before the next bullish breakout shows up. While there will still be some sideways and consolidation before the rise, once the bottom is gone, it is gone.
It is time to enter the Cryptocurrency market.
The best time to buy is when prices are low.
When in doubt, trade spot. With spot trading you can never go wrong. All you need to do is to buy and hold. In the worst scenario, think long-term.
If you develop a bias towards a waiting time of 1 year or more on every position you take, you will be a winner in this bull-market.
Thank you for reading.
Namaste.

aaveIf it wants to hold on in the short term, it should not miss this green box. If it misses and the blue line also misses, it should be checked in the area 91 to 131.

AAVEUSDT 1DAAVE ~ 1D Analysis
#AAVE Buy after successfully penetrating this resistant line with a short -term target of at least 15%+.

AAVE price analysisOn the weekly timeframe, the price of CRYPTOCAP:AAVE is being bought off quite actively, leaving “shadows” below
🔼At the moment, it looks like a “subtle hint” that the OKX:AAVEUSDT price may start the 5th wave of growth in the medium term and reach $570-670
Do you believe in such prospects ?
_____________________
Did you like our analysis? Leave a comment, like, and follow to get more

Aave: End Of Correction (Update)Several signals are pointing to the current correction being over or reaching its end. AAVEUSDT peaked 16-December 2024. The action has been bearish for 78 days if we consider yesterday's low.
The action pierced the 0.618 Fib. retracement level in relation to the bullish wave that happened from April through December 2024. This is the main support zone for most strong, long lasting, bullish movements.
Trading volume has been rising. There is strong high buy volume. The RSI shows a good reading as support is hit. More than 40 which supports the correction reaching its end.
The market is never in a hurry when it is about to enter a long lasting phase. While the correction can be ending or is over, some sideways (consolidation) can happen before the next advance takes place. See mid-2024 on the left side of the chart.
First the drop. Then sideways (consolidation), followed by slow and steady growth and finally a strong advance. We are entering the second part of this four steps sequence.
Aave is starting to look good and should look much better in the coming months.
Thanks a lot for your continued support.
Namaste.
AAVE Retests Key Support – Bullish Reversal Ahead?CRYPTOCAP:AAVE is currently retesting a rising support line after breaking through a key resistance zone, which has now turned into support.
This structure suggests that the uptrend remains intact, and the recent dip could be a healthy pullback before a continuation to the upside.
DYOR, NFA

AAVEUSDT(Aave) Updated till 04-03-25AAVEUSDT(Aave) Daily timeframe range. consider how recently market dumped its still on its February range. we can see strength of buyers and holders here. now if it can hold 180.12 and stay above it that can push it to recent resistance 261.10.


Buy and SellBuy and Sell Signal for AAVEUSDT
📌 Buy Signal:
Buy if the price breaks $267.
Stop-loss: $247
Bullish targets:
$284.23
$314.29
📌 Sell Signal:
Sell if the price breaks $246.
Stop-loss: $267
Bearish targets:
$229.58
$206.04
🔹 Risk Management: Considering support and resistance levels, an appropriate stop-loss should be set.

Lending space has moved into pressure cooker recoveryAs the overall market and Ethereum falls we have seen price enter recovery phase
Recovery phase forming a 'pressure cooker' can be extremely powerful sign of stable recovery
The lending space has continued to boom with AAVE deposits at all time highs. Deposits keep increasing as Ethereum Foundation adds more ETH into AAVE
Keep an eye on how lending space moves within this forming pressure cooker

Long Entry Signal for AAVE/USDT - Trading System Confirmation
Given the daily chart for AAVEUSDT:
MLR vs. SMA: MLR (blue) is above SMA (pink), bullish.
MLR vs. BB Center: MLR is above BB Center Line (orange), bullish.
PSAR: PSAR dots are under the price, bullish.
Price vs. SMA 200: Price is above SMA 200 (red), bullish long-term.
Current Strategy: All conditions for a long entry are met. Prepare to act on this bullish signal, keeping an eye on any further developments or confirmations.
Trading systems can be deceptive; many investors purchase them with high expectations but often fail to use them as intended or at all. Even with a proven system, success isn't guaranteed due to the challenge of execution and psychological factors. This highlights the importance of understanding not just the system but also the discipline and skill required to apply it effectively in real trading scenarios. However, we will help you use the system effectively by letting you know when it's the time to act. All you have to do is keep a close eye on our updates to ensure you're ready to make informed decisions at the right moments.

Univers Of Signals | AAVE : a DeFi project currently Let's take a general look at AAVE, a DeFi project currently with a market cap of $3.52 billion, ranked 32nd in coin market cap.
🔍 In the 4-hour timeframe, as you can see, there's a range box between $231 and $278, and the price has been oscillating within this box for about three weeks now.
📉 Presently, the price has hit a lower high compared to the $278 ceiling and has reached the $231 floor. Given the suitable bearish momentum, if the $231 level breaks, you could enter a short position. A break below 34.50 in the RSI would be a good confirmation for this move.
📈 On the flip side, if the price bounces back from the $231 floor and moves towards the $278 ceiling, breaking this level could provide a good opportunity to open a long-term long position. A risky long position could also be considered if the $251 level is breached, but be aware that it would carry significant risk.
