Aave is breaking out, potential trade setupBINANCE:AAVEUSDT if the breakout breaks with high volume enter a long
Take profit just below the 1.618 Fib extension approx. $100 to $109
Stop loss below the trending support
Aavebtc

AAVEBTC WAVE ABC is over and trendline breakoutAAVEBTC WAVE ABC is over and trend line breakout
Dont forget stop loss and this is not financial advise.
this is for education propose only.

AAVE/USDT (Ascending channel)AAVE / USDT
ascending channel spotted
If the price could break daily local resistance and close above
We can set a buy/long order with small stoploss
Channel structure should hold to remain bullish
Good luck

AAVEUSDT - Possible price actions AAVEUSDT is printing an ascending channel on the 30M timeframe.
Price is testing the ascending channel support.
Price action is printing a descending triangle pattern.
Bullish ⬆️ - breakout above the descending triangle resistance + previous swing high.
Bearish ⬇️ - breakdown below the descending triangle support + ascending channel support.

AAVEBTC completing final leg of bullish Shark | Upto 205% moveOn daily time period chart, the price action of Aave (AAVE) is completing the final leg of bullish Shark and soon it will be entered in the potential reversal zone. At this time price action is breaking down 100 SMA and on breaking down 200 SMA this move will be confirmed.
Buying And Sell Targets:
The buying and sell targets as per Fibonacci sequence of Shark pattern should be as below:
Potential reversal or buying zone: 0.002075 to 0.001375 btc
Sell or Fibonacci projection zone: 0.002741 to 0.004201 btc
Stop Loss:
The potential reversal zone area that is up to 0.001375 btc can be used as stop loss in case of complete candlestick closes below this level.
Possible profit and loss ratio:
As per above targets this trade has a profit possibility of 205% and as per the above-mentioned stop loss, the loss possibility is 33.8%.
Note: Above idea is for educational purpose only. It is advised to diversify and strictly follow the stop loss, and don't get stuck with trade.


MY PLAN FOR AAVELooking to buy the retest of the blue box below the current price, or buy above if price is able of closing above, aiming for the highest blue box, followed by ATH and price discovery,

Aaveusdt triangleBuy here and stoploss under the lower trend line
For safe entry wait the breakout of the triangle
Tp 103.5

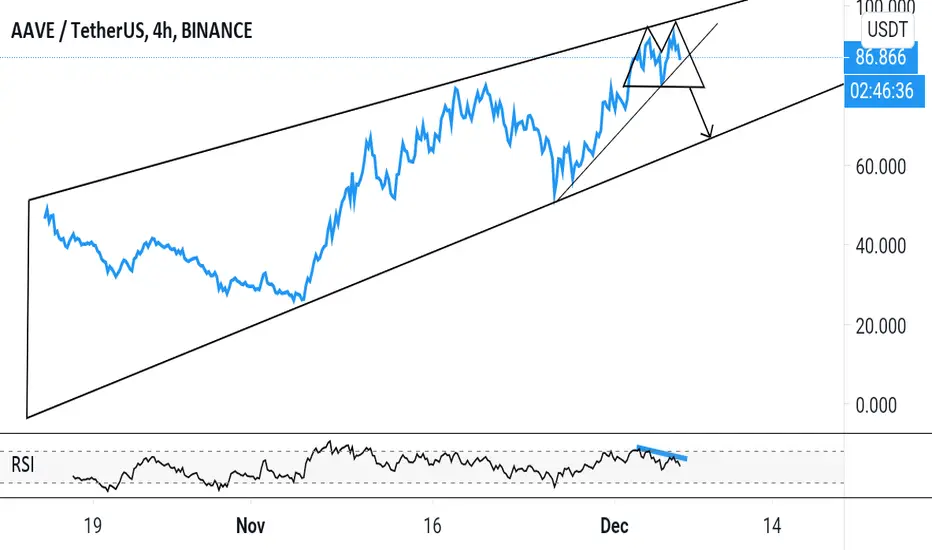
AAVEUSDT - Potential retracement AAVEUSDT is testing the rising wedge resistance.
RSI is printing a bearish divergence signal.
Price action is printing a double top reversal pattern.
Sell entry ⬇️ - breakdown below the double top neckline support.
Target 🎯 - rising wedge support.
AAVE (AAVEBTC) price at resistancewe are facing resistance right now wait for price to close above resistance after that we will enter at the retest of the red zone

$AAVE, Making a HH as it crosses over ~430k sats resistance$AAVE
Making a HH as it crosses over ~430k sats resistance level..
On a HL - HH formation as UCTS is showing a 2D buy signal..
For now volume is not 'there' yet, but a flip of this level may allow continuation toward ~540k sats (~25%)
#AAVE

AAVE short term planwe broke the channel, I'm bidding top of the channel to buy a bag. my target would be 5580

Price Discovery. No brainer hereAAVE broke out yesterday and is in price discovery. Still very strong and will climb.
Price target: $120 before correction


Aave AAVEUSDT - Elliott wave + Parallel channel- This is my Elliott Wave count. If you know about better EW count, let me know in the comment section
- I am expecting higher prices in the immediate short term
- Also the price is currently in this parallel channel + forming tripple TOP formation, great for breakouts to the upside
If you want more of these ideas, please hit the like button and follow me, so you don't miss any update!
Also, check my signature down below ↓

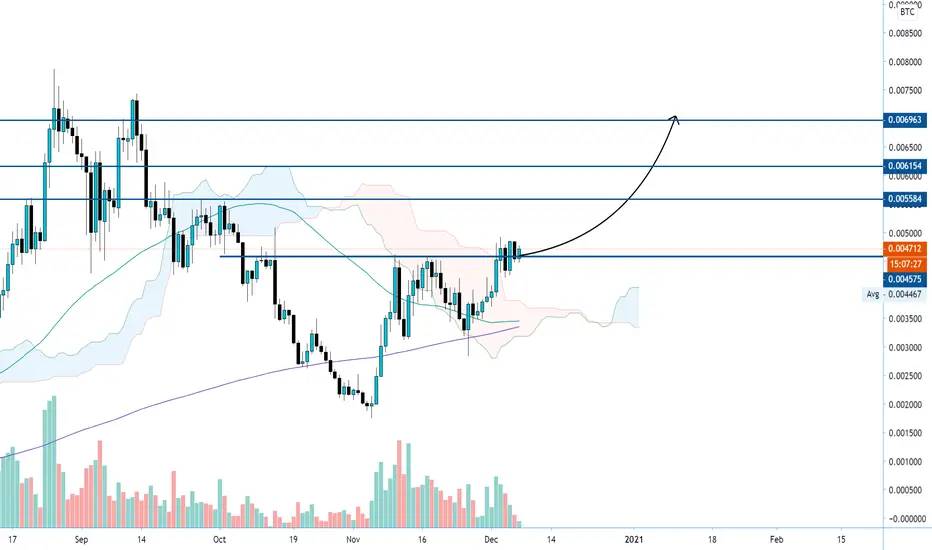
Important Level! (AAVE / BTC)AAVE has an incredible performance since September 19'.
It is so close to reach "$1 Billion" market cap now.
It tested 0.0075 BTC in September 2020 which is its ATH.
Then it dropped back to 0.0020 BTC.
Since then it rose 125% up again and it broke its downtrend.
Now, we are witnessing a war between Bulls & Bears at 0.0045 BTC.
If the Bulls win this war, AAVE may test 0.0075 BTC again.
If the Bears win, we may see 0.0020s again.
So I'm Neutral now but I believe it won't take long.
Happy Trading! ☺️✌️😊
What do you think? Any comment? 👇👇👇


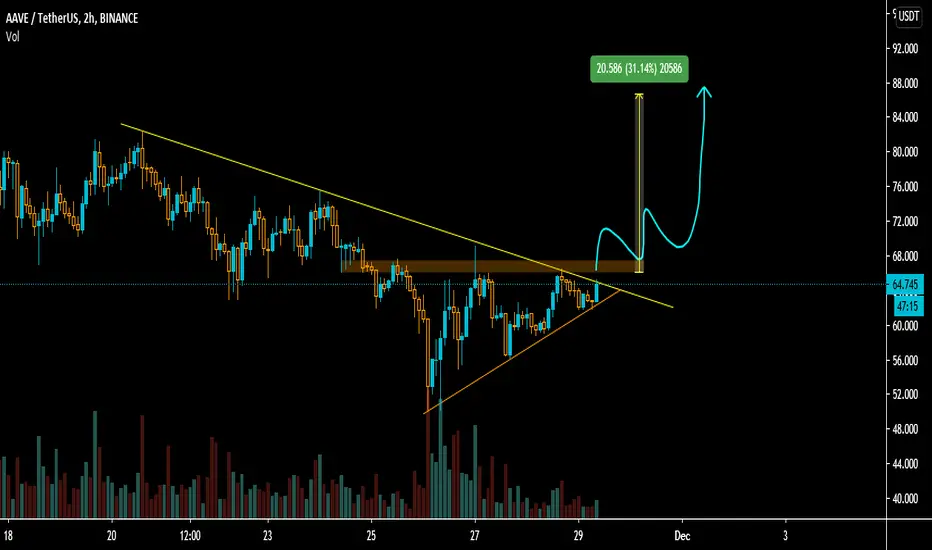
AAVE / USDT retest the ascending traingle Aave / usdt
🌟 Techincal analysis 🌟
After broke the ascending traingle pattern and retest the upperline .....
it did a good bounce on 4 h frame
If the support level /previous resistance (upper horizontal line of the traingle) hold
We can expect it to reach next targets in fibonacci soon
Good luck and happy trading 🌹

AAVE BTC - Hidden Bullish divergence AAVE BTC - Hidden Bullish divergence into 4h timeframe. Probably could continue to grow...

AAVE MARIA MÃE DE DEUS!AAVE Maria cheia de satoshis
Nakamoto é convosco,
Bendita sois satoshis entre as altcoins,
E bendito é o lucro do vosso ventre.
Rogai por nós Bullahs,
Agora e na hora da nossa Liquidation.
Amém.
