$AAVE - ETHBTC bullish gives AAVE extra power?Again massive expansion
Big corrective phase after
Month to two of consolidation,
Now Trendline breaks
With ETHBTC looking good, as this is DeFi built on ETH it could give it extra pump power
Again, as long as BTC doesn't pullback again
Aavebtc

AAVE: 50% dump done, now a 75% pumpAAVE has been through a very long consolidation after being overextended in the last bull run.
The correction has proven to be healthy and created a huge triangle; where AAVE now is attempting to breakout for 70/75% pump!
And against BTC, given alt season pervails, there is a 125% gain to be made... (ill post the chart later) - so of course you could consider some defi gold like AAVE :)
PROFILE
Check the links below for alts I am bullish on or check my profile. Good luck!
IMPORTANT
This is not financial advice, trade or invest based on your own risk and research.

AAVE/BTC: trading is art (+125%!) Follow up on my last AAVE/USD post; AAVE has a 125% gain ahead ofr the coming weeks / months against BTC.
Check my AAVE/USD update for more info here:
IMPORTANT: this is not financial advice, trade or invest at your own risk and research.


AAVE ready to blow - Altseason 2021 part 2Another wave of Altcoins pump is coming and you don't want to miss it.
AAVE was one of the biggest winner in jan-feb for what we could call the first DEFI
parabola leg.
Bullish pennant about to breakout and it double bottomed.
The second leg should push it to targets on chart in the next 4 weeks. We are still at good entry and if
it should dip again I would just DCA (average buy).
Target 1 : 580$
Target 2 : 870$

AAVE/BTC - Bullish breakout! Not financial advice but someone sharing his trading diary! Make your own plans and you will do fine in the long run.
AAVE seems to have finished an abc correction and is getting ready to move up and start a new impulsive wave.
Pros:
- It bounced from a local 618 Fib + Monthly level.
- Market structure on the daily and weekly timeframe is changing.
- Oscillators have reset.
- Volume signature looks good.
Cons: Markets are under selling pressure.
Entry:
Aggressive: Laddering between 66-58
Safe: consolidation above weekly level: 69-67 (Watch Market structure on at least 4H TF change)
Targets: Paying attention to weekly / Monthly levels (chart) - I might leave a small part open and Compound in case a rally is confirmed.
Invalidation: a 4H or daily close below 50
Trading level by level and Risking 1% of the account
#aave #btc #technicalanalysis #chart # trading #idea

$AAVE/BTC 4h (Binance Spot) Breakout of Falling wedgeAAVE Break out of Falling Wedge and MACD Bullish Divergence
Current Price= 0.006525
Buy Entry= 0.006409 - 0.006636
Take Profit= 0.008303 | 0.010383 | 0.012419
Stop Loss= 0.005658
Risk/Reward= 1:2.05 | 1:4.44 | 1:6.79
Expected Profit= +27.23% | +59.10% | +90.30%
Possible Loss= -13.30%
Estimated Gain-time= 2 month
use Maximum 10 % of the Account

AAVE At SupportAAVE is one of our favorite Defi projects and right now it has just landed on support. Can the price rebound rise higher now?

AAVE/BTC Binance End of CorrectionI think this is the end of the correction and we have short-term and long-term targets

Aave (AAVE) - March 22Hello?
Dear traders, nice to meet you.
By "following" you can always get new information quickly.
Please also click "Like".
Have a good day.
-------------------------------------------------- -----
We have to see if we can ascend to the 377.51-415.40 point.
If you fail to climb above 377.51 points, you can touch 301.74 points, so a short Stop Loss is required.
It remains to be seen if volatility around the 27th of March leads to a movement that deviates from the downtrend line.
--------------------------------------
(AAVEBTC 1D chart)
We'll have to see if we can rise above 0.006500 points for support.
It needs to be supported above the 0.007167 point to turn to an uptrend.
If it falls, you should watch for movement along the downtrend line.
If it does not fall below the downtrend line, an uptrend is expected.
To buy, you need to make sure you're getting support at 0.006500.
-------------------------------------------------- -------------------------------------------
** All indicators are lagging indicators.
So, it's important to be aware that the indicator moves accordingly with the movement of price and volume.
Just for the sake of convenience, we are talking upside down for interpretation of the indicators.
** The wRSI_SR indicator is an indicator created by adding settings and options from the existing Stochastic RSI indicator.
Therefore, the interpretation is the same as the conventional stochastic RSI indicator. (K, D line -> R, S line)
** The OBV indicator was re-created by applying a formula to the DepthHouse Trading indicator, an indicator published by oh92. (Thank you for this.)
** Check support, resistance, and abbreviation points.
** Support or resistance is based on the closing price of the 1D chart.
** All explanations are for reference only and do not guarantee profit or loss on investment.
Explanation of abbreviations displayed on the chart
R: A point or section of resistance that requires a response to preserve profits
S-L: Stop Loss point or section
S: A point or segment that can be bought for profit generation as a support point or segment
(Short-term Stop Loss can be said to be a point where profits and losses can be preserved or additionally entered through installment transactions. It is a short-term investment perspective.)
GAP refers to the difference in prices that occurred when the stock market, CME, and BAKKT exchanges were closed because they are not trading 24 hours a day.
G1: Closing price when closed
G2: Cigar at the time of opening
(Example) Gap (G1-G2)

AAVE is ready for another big bull runAAVE is ready for another push, it is on support and right time to open a long here.

$AAVE - round 2 is hereCorrection downtrend has been complete
Bull flag accumulation complete
Claim pink here and we will test the 0.5
Expecting some rejection there but once cleared should be able to run to highs if market strength continues
AAVE also being one of the biggest and best DeFi setups is always good fundamentally also

Is Aave losing steam?Is Aave losing steam because the craze for NFTs?
This weekend we will see if the bulls continue in charge or if the Bears are taking over.
What is your opinion?
Leave a LIKE!


AAVE - Potential reversal pointQuick sketch of resistance as I see it - potential support here. Good long entry with low risk stop.
Best, Hard Forky

Aeve unlikely to pumpAave, the native token of Aeve Defi protocol for borrowing and lending, has had a rough month.
In BTC terms it peaked in early February and has since then lost over 50%.
The current level might look like an attractive entry point in case of a potential reversal — probably that’s why the Cindicator community was interested in learning more about this asset.
Based on the demand from the community, we’ve asked Hybrid Intelligence the following question:
“The cryptocurrency Aave (AAVE/BTC) settled at 0.00692100 BTC at 09:32 AM UTC at the binance exchange on Friday, March 12. In your opinion, will AAVE/BTC trade above 0.00795846 BTC (+14.99%) at any time before March 20?”
-------------------------------------
Assurance: 22%
This means that Hybrid Intelligence thinks it’s unlikely that AAVE could gain +15% against Bitcoin over the next week. So it’s probably best to consider some other asset for a long position.

$AAVE Price Target $922 -Bullish Move to New All-Time-High SOON!This chart says it all. On the daily ichimocku, we were supported at the kijun line (red line) on the 4 hour ichimoku, we are officially breaking back out above the cloud and primed to make new all time highs. The cloud has also flipped green and is now bullish in almost every single way.
I am currently going to be adding my posityon and if we break back down, I will be cautious and set a stop.
In the meantime, this is a high probability trade and my next Major target is $922.
The other red lines are take profit zones 1 & 2.

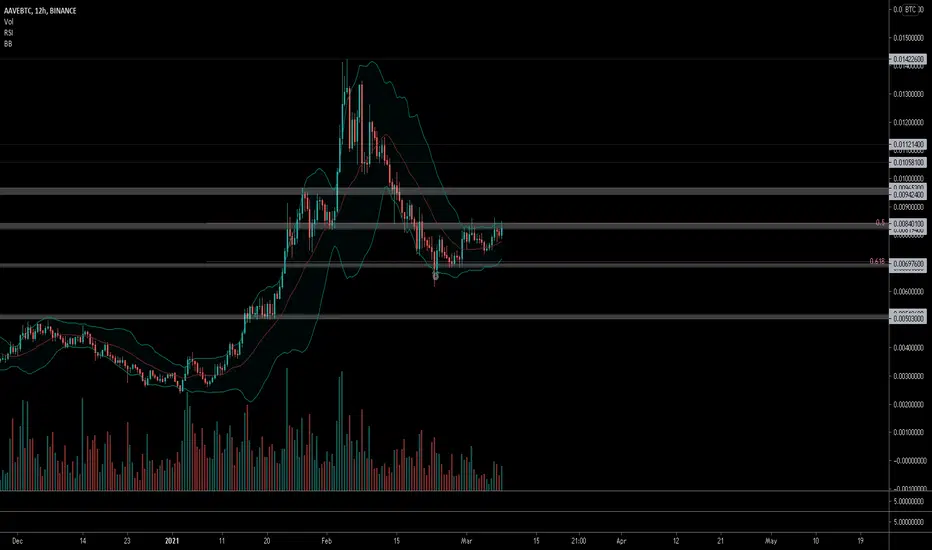
$AAVE, Trying to see if its able to reclaim ~840k sats level.. $AAVE
Trying to see if its able to reclaim ~840k sats level..
UCTS signalling a 12H Buy signal (still bearish on higher timeframes..)
If happens, then looking for a potential reversal after .618 fib test
Set alerts!
#AAVE
AAVE - Ready for 500Our updated AAVE chart showsmomentum and nice bounce of the support.
Looking good!

AAVE: Send it to the moon!The chart is clear.
Good risk/reward ratio.
Please hit LIKE if you find this useful!

