AAVEUSDT: Wedge & Growth OpportunitiesAn excellent medium-term trading plan on AAVE.
The prolonged downward correction in wave B seems to be over.
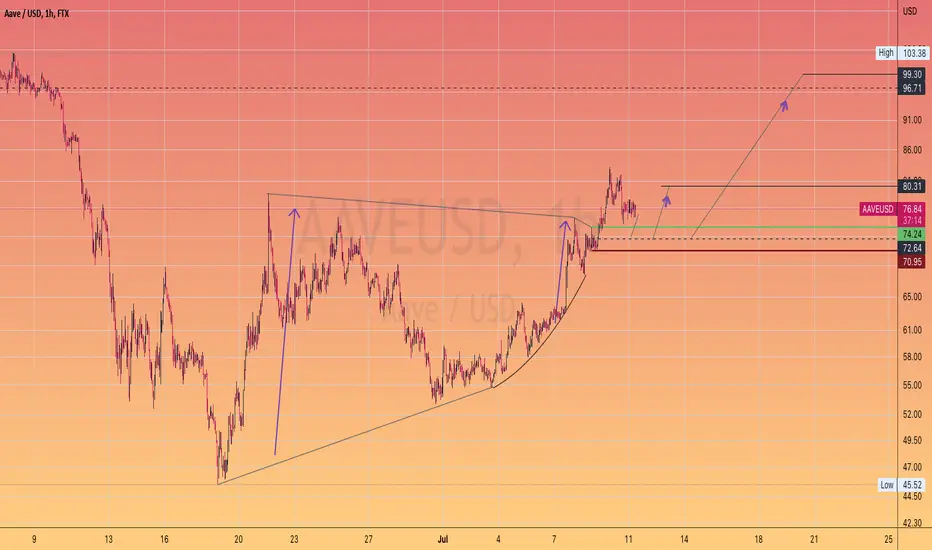
At the moment the price has formed a strong upward impulse in the form of a wedge pattern for 1 wave.
Locally, the price is correcting in the assumed wave B (in wave 2).
I plan to open a short position at the completion of wave B in order to win back the decline in wave C (in wave 2); the profit-taking target is 75.
At the completion of wave C (in wave 2), I will close the short position and open a long position, with the goal of taking profits at a minimum of $300.
Good luck to you)
Aaveusd

AAVEUSDT 4h ANALYSISHello friends, AAVE is now going through the top of the channel I share an upward view of what I see.
Good luck, my friends

AAVE/USDT - Potential Short ScenarioHello Traders!
AAVE continues to move within the descending trend completing the falling phase.
It is possible to assume that correction to the basic movement to gather liquidity near the $104 is finished. Thus further, it is possible to expect a continuation of descending pricing.
The set of medium-term purchases can be started in parts in the price range of $30 - $54 after the price leaves under the support level of $54.
Targets of such purchases will be price levels of $104 and $164
Good luck and watch out for the market
P.S. This is an educational analysis that shall not be considered financial advice

AAVE - Selling SignalBYBIT:AAVEUSDT
4 Hours trend
-
AAVE has been put below the uptrend.
Despite we lose the best timing to short it at 82.25, we can still sell it here with nice Risk to Reward ratio.
-
Target:
1) 73.2
Stop:
1) 81.55
RRR: 2.04

AAVEUSDT Short steup!AAVEUSDT Technical analysis update
AAVEUSDT currently trading at 86.70
AAVE formed head and shoulder pattern in 1h chart and rice already broken its neckline. I'm expecting a drop from the current level.
Short Entry: $86.50 - $88.40
Stop loss : $93.40
TP 1 : $82.40
TP 2 : $77.50
TP 3 : $70.00
Max leverage : 2x
Always keep stop loss
Thanks
Hexa

AAVE LONG 20220717Signal
Red -> Green
Context: Green
DISCLAIMER
This is only a personal opinion and does NOT serve as investing NOR trading advice.
Please make your own decisions and be responsible for your own investing and trading Activities.

AAVEUSDT - Could Easily +200% 🚀Hi Traders, Investors and Speculators 📉📈
Ev here. Been trading crypto since 2017 and later got into stocks. I have 3 board exams on financial markets and studied economics from a top tier university for a year.
A quick look at AAVE / AAVEUSDT in this short video analysis.
From these examples, we can see that this altcoin is no stranger to parabolic mid-cycle moves:
It's important to note that even though the technical indicators Phoenix Ascending together with Fibonacci Retracement Bollinger Bands seem very bullish , it's not usually a straight line up. This progress is followed by some corrections and pullbacks during a bull market.
Other Crypto Markets :
💥 Overall, most crypto remains in a tight range between local support and resistance zones
💥 Bitcoin BTC reclaims $20500 resistance zone
💥 Ethereum ETHUSDT reclaims $1200 as it follows BTCUSDT up
💥 Cardano ADAUSDT trades lower, moves back towards .40c support zone
💥 DOTUSDT Polkadot looks ready to try $7 resistance zone
_________________
👀 Follow us here on TradingView for daily updates and trade ideas on crypto , stocks and commodities 💎
👍Hit like & Follow 🔔
We thank you for your support !
CryptoCheck

AAVEUSDT 1D Buyers are trying to break the downward trendToday, the trading pair AAVEUSDT is on review
From May 2021, when the price of AAVE recorded its maximum of 668 dollars, a downward trend began, which has been going on for more than a year.
In the last trading month, AAVEUSD buyers have been trying to break the downward trend. The struggle between buyers and sellers began on increased trading volumes, and the rebound from the bottom was +80% at that moment.
But there is still a lot of work, because only in the downward channel the range of price movement is 250%
In the coming days, we allow the possibility of continued growth to $89-95 , and possibly even to 115dollars per AAVE.
At these price levels, sellers should become more active in the future in order to force buyers to fight for the middle of the downtrend channel and show who currently has more strength and capital.
Well, depending on the results of this battle, the blue or red price route will be activated, you just have to watch carefully.
_______________________________
Since 2016 , we have been analyzing and trading the cryptocurrency market.
We transform our knowledge, trading moods and experience into ideas. Each "like under the idea" boosts the level of our happiness by 0.05%. If we help you to be calmer and richer — help us to be happier :)

AAVE - Falling wedge is breaking out! + Complete Elliott Wave
AAVE is ready for a new bull market!
On the macro scale, we can see a falling wedge pattern that is currently breaking out.
As per my Elliott wave technical analysis, the ABC correction has been completed and because of that we can expect a new Impulse wave.
Good news is that the price has been supported by 0.786 FIB + yellow trendline.
We didn't make a new low on the macro scale, so there is a great chance for a new bull market!
If we take a look at the RSI indicator - we can spot a bullish divergence, always nice to see in the end of the downtrend.
Next target is ofcourse previous all time high from 2021.
I see a lot of altcoins probably bottomed out, so next weeks / months can be finally bullish.
Look at my ideas about interesting altcoins in the related section down below ↓
For more ideas please hit "Like" & "Follow"!

#AAVE BULLISH STILL. Target 2 MET. Retest of Funnel breakoutLooks like a great re-entry spot with defined exit points if things turn south on the macro and #BTC
But I suggest we have a still a legitimate opportunity of going and meeting it's final target.
AAVE SHORT 4HAave is printing a Bearish Gartley and is at the top of a Bear Flag. Good Short with a Stop Loss above 90.
This pattern you should recognise very clearly - it's the pattern Bitcoin and Ethereum made back in December - January during the giant Daily Bear Flag. Remember the pump to 48k?
Good luck.

Aave Macd
* None of what i write here is not an investment advice. Please do your own research before investing in any digital asset.
* Never take my personal opinions as investment advice, you may lose your money.

AAVEUSD ❕ under the strong resistanceAAVE trades between liquidity levels.
The price went down after it failed to overcome strong resistance.
TD Sequential is an upward reversal signal on a 1-hour timeframe.
I expect the price to go down in search of liquidity, but before that it needs to gain a fixes under the resistance level.

AAVEUSD Testing the 1D MA50. Potential Buy Signal.Aave (AAVEUSD) has been trading within a Channel Down pattern since the October 29 2021 High. Right now the price is approaching the 1D MA50 (blue trend-line) after the June 18 Lower Low. It has been trading below the 1D MA50 since April 28 and the last time it broke after a Lower Low was on March 17.
That was a break-out buy signal and the structure seems very similar with the current one. Notice how that break-out buy signal coincided with the RSI breaking above its Symmetrical Resistance. As a result we are waiting for a clear break on both in order to engage with a buy position. The clear target is the 1D MA200 (orange trend-line), which was hit both on the March 2022 and the December 2021 Lower Highs but we can extend that to just below the 0.786 Fibonacci retracement level, which was almost reached during both these Highs. Best though would be to pursue this higher target if the 0.5 Fib breaks.
--------------------------------------------------------------------------------------------------------
Please like, subscribe and share your ideas and charts with the community!
--------------------------------------------------------------------------------------------------------

AAVE - Go time85% drawdown reom resistance.
Bottom of falling wedge
Aggressive potential return
B, HF


AAVEUSD ❕ token ahead of the DeFi segmentAAVE is moving in an upward channel within the liquidity zone.
Token showed sharp growth similar to many coins of the DeFi segment, but did it faster than others.
Volatility has declined.
Trading volumes show no interest in price declines.
The price broke through the upside of the 100MA (4H TF)
Main MAs are bullish (1H TF)
I expect that the price may retest the support level, but after fixing above it will continue to grow.

Long idea buying levels of AAVE AAVE
aaveusdt moving in to the buying zone
Start buying from 43 to 31
with the stop loss of 22
short term target area 114
Long term target 240
For Hodlers it can cross
400 easily in the bull run.

AAVE/USDT If the price close for a day or 2 above 200$, I would go long as it will a strong bullish candle in weekly time frame .
Please like share and comment

$DEFI is toast: nice short...I think we are likely to see a massive move down in DeFi names, the contract issued by FTX is a nice way of riding the eventual move down, which can be magnified if we get some large protocol issue, or some unexpected black swan event causing a cascading decline of epic size as a gigantic levered bubble bursts. It is likely the best short in crypto, to profit from the bear market we are in.
Best of luck if going short.
Cheers,
Ivan Labrie.

Aave formed huge bullish Gartley for upto 849% massive rallyHi dear friends, hope you are well and welcome to the new trade setup of Aave token.
On a monthly time frame, AAVE has formed a huge bullish Gartley pattern for big reversal move:
Note: Above idea is for educational purpose only. It is advised to diversify and strictly follow the stop loss, and don't get stuck with trade

AAVE PumpBounce from channel support to channel resistance. RSI over 50, MACD approaching zero, CCI above 100, all bullish indicators.
Breakout over the 4H 200EMA will send it to resistance.

AAVE is bullishAAVE looks really bullish on 12h TF, this PA should continue higher. MANAGE YOUR RISK
NOT A FINANCIAL ADVICE
