Today the day of breakout for AAVE ?!Today the day of breakout for AAVE ?!
After the RSI breakout AAVE tries to break the well respected price resistance.
So... todays daily candle close is very very important !
What do you think? 😎
Drop me a nice comment if you'd like me to analyze any other cryptocurrency.
*not financial advice
do your own research before investing
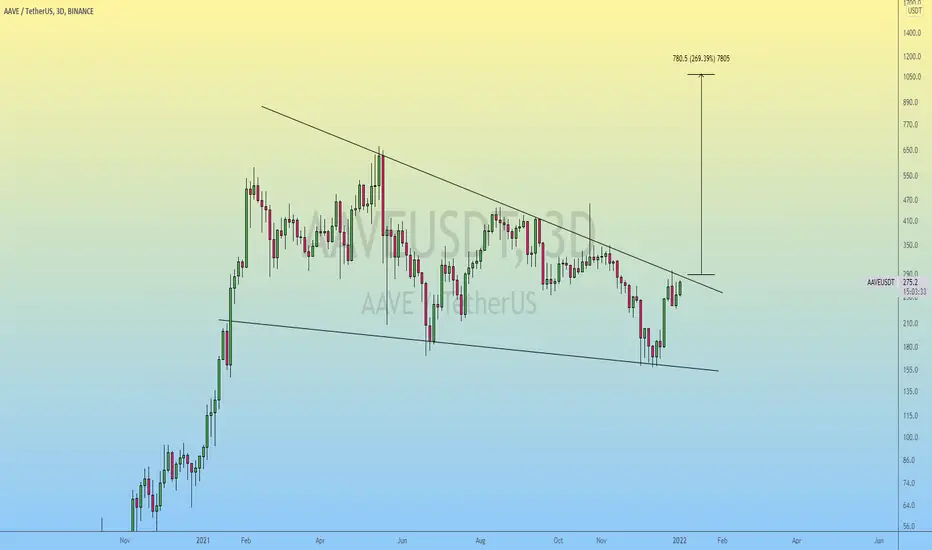
Aaveusd

Long AAVEUSD - A validation of the bullrun towards $430First and foremost this is my own hypothesis and in no way suggests a buy or sell advice.
We reached a low marking the end of our phase 2 correction around $153, which formed the ABC sub-waves (purple) in a Zig-zag pattern.
We then traced the phase 3 of our impulse which is waiting for us to cross MM200 which has become an important resistance as well as our Kumo.
Finally, we need to cross the $430 mark to validate the Elliott wave impulsive structure and take off towards our next objective of this wave 3.
To conclude we have two main objectives before the validation of the bullrun :
The first one is located on the MM200 and close to the Kumo around 300$.
The second is located around $430 corresponding to the old highs to recover.
Let's give AAVE time to validate this analysis.
If you agree with this scenario let me know with a like.
Otherwise let me know your point of view with a comment!

AAVE- Failure to touch 300$ is a Bearish signDid quite well with AAVE but it's time to re-consider.
Price has failed to reach the 300$ mark and looks bearish at this very moment.
Been absolutely Great though:
We will be abck with a new entry point a bit later. For now the outlook is bearish.
One Love,
the FXPROFESSOR

AAVE- 310$ Or Higher AAVE has offered us a nice profit during a difficult period.
With the market being stagnant and mostly sideways and with fears of a more generalized correction over our heads, we definitely appreciate such charts like AAVE.
Technically we had a nice breakout with a 4x previous support action :
We did well for buying this and we expect 300-310$ for taking profits.
Hope you like our chart for AAVE as much as we like the news:
- The founder of Aave has revealed that the Defi protocol is going to build a mobile wallet this year. (awesome!)
- Aave Connects With Traditional Finance Ecosystem Via Centrifuge Partnership
More opportunities, more user empowerment.
Go AAVE!
the FXPROFESSOR

AAVE | looks Solid for midterm Hold..!!
#AAVE (Update)
Pay Attention to #AAVE 👀
looks Very Solid for Q1, 2-3x Bullish Wave Expected..!!
So far Consolidating in Descending Wedge Pattern & In Case of Breakout, expecting +250% Bullish Wave in Coming Days.
Please like the idea for Support & Subscribe for More ideas like this and share your ideas and charts in Comments Section..!!
Thanks for Your Love & Support..!!
AAVEUSDT - LONGBased on technical factors there is a long position in AAVEUSDT Aave
AAVEUSDT Aave
Score 1️⃣
🔵Long Now or set on Key Level 255.0
🟢Target 1 266.5
🟢Target 2 278.0
❌Stop loss 252.0
#K_Level
Every signal has a score from 1 to 5, so accordingly adjust your risk for each signal. The signals with the score of 5 are the most probable ones.
Please support our activity with your likes and comments.

AAVEUSDT : Wait for break out the wedgeIn AAVEUSDT 4h chart.
The price still in the wedge ,if it try to break out and stand firm on the wedge ,trading strategy as below .
SL: 230.8
TP1: 296.8
TP2: 334.7
TP3: 350.0
TP4: 366.4
TP5: 382.8
If you like this analysis, give it a like or share your thought or let me know what crypto TA you want to know.

AAVE - Flirting with a breakout after failing to dropAave is trying to break up here, I have a feeling we could see fireworks if it does get higher volume, as this could be considered a bull flag. We bounced off the 50ema a few hours back and we have sustained good price but we will need to see more buyer strength to be honest. NFA, DYOR

AAVE - looking like a good short scalp at this pointAaveusd is a bit overbought and looking to come down further in my opinion to about $250, $237 (.618), or maybe even $225. NFA, DYOR

AAVEUSDT is going to break a triangle.AAVEUSDT is going to break a triangle.
Because it has bounced back by huge support.
Thanks and happy trading.

Aave (AAVE) - December 25Hello?
Welcome, traders.
If you "follow", you can always get new information quickly.
Please also click "Like".
Have a nice day.
-------------------------------------
(AAVEUSD 1W Chart)
Above the 101.345455 point: expect the uptrend to continue.
It must rise above the 300.459751 point to turn into an uptrend.
If it rises from the 300.459751-382.934264 high, the uptrend is expected to accelerate.
------------------------------------------
(AAVEBTC 1W chart)
Above the 0.002157-0.002829 interval: expected to continue upward trend
If the price holds above the 0.005734 point, it is expected to turn into an uptrend.
A move above the 0.007865 point is expected to accelerate the uptrend.
------------------------------------------
We recommend that you trade with your average unit price.
This is because, if the price is below your average unit price, whether the price trend is in an upward trend or a downward trend, there is a high possibility that you will not be able to get a big profit due to the psychological burden.
The center of all trading starts with the average unit price at which you start trading.
If you ignore this, you may be trading in the wrong direction.
Therefore, it is important to find a way to lower the average unit price and adjust the proportion of the investment, ultimately allowing the funds corresponding to the profits to be able to regenerate themselves.
------------------------------------------------------------ -------------------------------------------
** All indicators are lagging indicators.
Therefore, it is important to be aware that the indicator moves accordingly with the movement of price and volume.
However, for convenience, we are talking in reverse for the interpretation of the indicator.
** The MRHAB-O and MRHAB-B indicators used in the chart are indicators of our channel that have not been released yet.
(Since it was not disclosed, you can use this chart without any restrictions by sharing this chart and copying and pasting the indicators.)
** The wRSI_SR indicator is an indicator created by adding settings and options to the existing Stochastic RSI indicator.
Therefore, the interpretation is the same as the traditional Stochastic RSI indicator. (K, D line -> R, S line)
** The OBV indicator was re-created by applying a formula to the DepthHouse Trading indicator, an indicator disclosed by oh92. (Thanks for this.)
** Support or resistance is based on the closing price of the 1D chart.
** All descriptions are for reference only and do not guarantee a profit or loss in investment.
(Short-term Stop Loss can be said to be a point where profit and loss can be preserved or additional entry can be made through split trading. It is a short-term investment perspective.)
---------------------------------

AAVE Maria!Dang Fine example of an Inverse Head and Shoulders with the throw back to the neck line and everything! Been tracking it, in other places, since before the right shoulder formed and managed a nice entry! Rolling with this count for now the W1 of the Diag is not ok. Whenever a retrace starts, no rush lol, will be looking for the usual suspects for a W4. 280 is the next aoi im looking at for a possible turn.

Aave trading above its important support * Aave in 1D time frame appears with Falling wedge pattern.
* Falling Wedge is a bullish pattern that appears when the price moves between two slightly downward sloping trendlines forming lower-lows and lower-highs.
* Aave is trading above its important support zone, if the bounces back breaking the falling wedge pattern we can expect a rally till $350.
* Price is bearish below the support zone.

AAVEUSD D1: 650%+ gains THE BEST Level to BUY/HOLD (SL/TP)(NEW)Why get subbed to me on Tradingview?
-TOP author on TradingView
-2000+ ideas published
-15+ years experience in markets
-Professional chart break downs
-Supply/Demand Zones
-TD9 counts / combo review
-Key S/R levels
-No junk on my charts
-Frequent updates
-Covering FX/crypto/US stocks
-before/after analysis
-24/7 uptime so constant updates
🎁Please hit the like button and
🎁Leave a comment to support our team!
AAVEUSD D1: 650%+ gains THE BEST Level to BUY/HOLD (SL/TP)(NEW)
IMPORTANT NOTE: speculative setup. do your own
due dill. use STOP LOSS. don't overleverage.
🔸 Summary and potential trade setup
::: AAVEUSD D1 chart review
::: chart looks good /strong
::: setup still valid as of right now
::: noteworthy compression in progress
::: expecting one final pullback soon
::: get ready to BUY LOW later
::: best reload bulls near 155 USD later
::: expecting 650% bull run
::: re-test of sliding S/R line
::: near 1000 USD later
::: BULLS stay out be ready later
::: expecting short-term pullback
::: BULLS get ready to BUY after pullback
::: TP bulls is +650% gains later
::: expecting decent gains soon
::: 30-45% pullback short-term
::: recommended strategy: BUY/HOLD after pullback
::: TP BULLS +650% gains / 1000 USD
::: BEST reload BULLS near 155 USD
::: TP BULLS is 1000 USD+ final exit
::: SWING TRADE: BUY/HOLD IT
::: bull run not over yet
::: good luck traders!
::: BUY/HOLD and get paid. period.
🔸 Supply/Demand Zones
::: N/A
::: N/A
🔸 Other noteworthy technicals/fundies
::: TD9 /Combo update: N/A
::: Sentiment mid-term: BULLS
::: Sentiment short-term: BEARS/PULLBACK
RISK DISCLAIMER:
Trading Crypto, Futures , Forex, CFDs and Stocks involves a risk of loss.
Please consider carefully if such trading is appropriate for you.
Past performance is not indicative of future results.
Always limit your leverage and use tight stop loss.

AAVE - 20% Higher After our Post YesterdayWe like to trade these breakouts, especially when they are backed with strong fundamentals (news).
Yesterday's post:
News:
AAVE Soars by More Than 11%
AAVE, the native token of the Aave Protocol, is one of the top performers amongst the leading 100 cryptocurrencies by market cap. The token’s price has soared by more than 11% over the past 24 hours and is primed for further gains.
Advertisement
Know where Ethereum is headed? Take advantage now with
Start Trading
Trading Derivatives carries a high level of risk to your capital and you should only trade with money you can afford to lose. Trading Derivatives may not be suitable for all investors, so please ensure that you fully understand the risks involved, and seek independent advice if necessary. A Product Disclosure Statement (PDS) can be obtained either from this website or on request from our offices and should be considered before entering into a transaction with us. Raw Spread accounts offer spreads from 0.0 pips with a commission charge of USD $3.50 per 100k traded. Standard account offer spreads from 1 pips with no additional commission charges. Spreads on CFD indices start at 0.4 points. The information on this site is not directed at residents in any country or jurisdiction where such distribution or use would be contrary to local law or regulation.
Aave protocol is a decentralized finance (DeFi) platform on the Ethereum blockchain. It is a decentralized, open-source, and non-custodial money market protocol where depositors earn interest by providing liquidity to lending pools, while borrowers can obtain overcollateralized loans by using the liquidity provided by the pools.
AAVE has been rallying over the past few days following weeks of negative performance. The rally comes following the protocol’s recent adoption by Swiss-based SEBA Bank. SEBA Bank submitted a proposal to the Aave Protocol team two days ago, seeking to become whitelisted on Arc. Arc is the institutional platform developed by the team behind DeFi lending protocol Aave.
By getting whitelisted on Arc, SEBA Bank wants to allow its clients to gain broader access to the Aave platform. Due to regulatory challenges, SEBA’s institutional clients have been unable to deploy liquidities at a large scale in Aave until now. SEBA is one of the largest digital banks in Switzerland, and the adoption is huge news for the Aave ecosystem.
One Love,
the FXPROFESSOR
PS. AAVE is Professor's favorite Defi

AAVEUSDT Daily TA : 12.23.21 : $AAVEAs we can see, the price is in an important range and recommended to keep an eye on it ... 😉
Follow our other analysis & Feel free to ask any questions you have, we are here to help.
⚠️ This Analysis will be updated ...
👤 Arman Shaban : @ArmanShabanTrading
📅 23.DEC.2021
⚠️(DYOR)
❤️ If you apperciate my work , Please like and comment , It Keeps me motivated to do better ❤️

💡Don't miss the great buy opportunity in AAVEUSD @AaveAaveTrading suggestion:
". There is a possibility of temporary retracement to the suggested support line (218.2).
. if so, traders can set orders based on Price Action and expect to reach short-term targets."
Technical analysis:
. AAVEUSD is in a range bound, and the beginning of an uptrend is expected.
. The price is above the 21-Day WEMA, which acts as a dynamic support.
. The RSI is at 81.
Take Profits:
TP1= @ 250.6
TP2= @ 268.6
TP3= @ 288.6
TP4= @ 317.7
TP5= @ 344.9
SL= Break below S2
❤️ If you find this helpful and want more FREE forecasts in TradingView
. . . . . Please show your support back,
. . . . . . . . Hit the 👍 LIKE button,
. . . . . . . . . . Drop some feedback below in the comment!
❤️ Your support is very much 🙏 appreciated!❤️
💎 Want us to help you become a better Forex / Crypto trader?
Now, It's your turn!
Be sure to leave a comment; let us know how you see this opportunity and forecast.
Trade well, ❤️
ForecastCity English Support Team ❤️

💡Don't miss the great buy opportunity in AAVEUSD @AaveAaveTrading suggestion:
". There is a possibility of temporary retracement to the suggested support line (218.2).
. if so, traders can set orders based on Price Action and expect to reach short-term targets."
Technical analysis:
. AAVEUSD is in a range bound, and the beginning of an uptrend is expected.
. The price is above the 21-Day WEMA, which acts as a dynamic support.
. The RSI is at 81.
Take Profits:
TP1= @ 250.6
TP2= @ 268.6
TP3= @ 288.6
TP4= @ 317.7
TP5= @ 344.9
SL= Break below S2
❤️ If you find this helpful and want more FREE forecasts in TradingView
. . . . . Please show your support back,
. . . . . . . . Hit the 👍 LIKE button,
. . . . . . . . . . Drop some feedback below in the comment!
❤️ Your support is very much 🙏 appreciated! ❤️
💎 Want us to help you become a better Forex / Crypto trader ?
Now, It's your turn !
Be sure to leave a comment; let us know how you see this opportunity and forecast.
Trade well, ❤️
ForecastCity English Support Team ❤️

AAVE - 4 Flights from This Level (5th inbound?)Sometimes the chart does all the talking. This is exactly the case here.
This can be the fifth time that the price just explodes from here to higher.
NEWS:
Switzerland-based bank SEBA is keen on bringing institutional clients to the new DeFi platform Aave Arc. SEBA has submitted a proposal to Aave Governance for the same. The DeFi protocol’s token AAVE rose strongly on the news.
Institutional clients prepare to pour liquidity into Aave
DeFi is at the centre of Swiss Bank SEBA’s strategy for its institutional clients from Switzerland. The bank is aware of the rising demand for Aave from institutional investors and is prepared to offer access to new opportunities in DeFi through Arc.
Fundamentals and technicals agree: AAVE can fly AGAIN!
One Love,
the FXPROFESSOR

AAVEUSDT :The potential H&S pattern in 4hIn AAVEUSDT 4h chart
There is a potential H&S pattern and the pattern is not perfect , but it is still higher low .
If price breakout the neckline and stand firm,trading strategy as below .
SL:167.2
TP1: 216.5
TP2: 221.6
TP3: 232.5
TP4: 250.2
If you like this analysis, give it a like or share your thought or let me know what crypto TA you want to know.

AAVE is ready to get pulledHello traders!
This is a correct time to invest in AAVE as this pair is already 70% down from its All-time High and it has already formed a pullback pattern which will take the price above 300$ value.
There are two more supports but the pullback pattern is formed from the first S/R level so we are expecting the AAVE to go back above the S/R level.
This investment will give 60% gains in few days.
Don't forget to hit the like button and follow to stay connected.

Today the day of breakout for AAVE ?!Today the day of breakout for AAVE ?!
These current RSI levels of Aave have been very good entry-points into the market.
A conformation by breakout of the red RSI resistance channel should be considered.
What do you think? 😎
Drop me a nice comment if you'd like me to analyze any other cryptocurrency.
*no financial advice
do your own research before investing

AAVEUSDT trade hit our predictionAAVEUSDT trade declined according to our analysis 270%. NOW there is good possibility that Trade can go up 161% fib level. In long term analysis of trade looks promising and forecasting 7X growth. Keep one position in that area and keep holding until target hit.
We publish precise and compact information after careful consideration which give you quick glimpse for comparative analysis. if you have any question or want to ask about analysis of other pairs or you have any confusion about analysis then feel free to ask us. Don't forget to support by share your ideas and hit like and subscribe button.
