Aave (AAVE) - July 17Hello?
Welcome, traders.
By "following", you can always get new information quickly.
Please also click "Like".
Have a good day.
-------------------------------------
(AAVEUSD 1W Chart)
If the price is maintained above the 206.817161-300.459751 range, we expect the uptrend to continue.
(1D chart)
If the price is maintained in the 210.779774-315.356387 range, it is expected to turn into an uptrend.
The price should remain in the 315.356387-419.933 zone to continue the uptrend.
If it goes down, you should see support at the 158.491471-210.779774 zone.
-------------------------------------
(AAVEBTC 1W chart)
If the price is maintained above the 0.006650-0.007865 range, it is expected to create a new wave.
(1D chart)
If the price is maintained in the range of 0.007364-0.009798, it is expected that the uptrend will continue.
However, the 0.009798-0.011016 section is a section that determines the direction, and I think that the upward trend can be accelerated when it rises above the 0.011016 point.
If it falls from the 0.007364 point, you need a Stop Loss to preserve your profit.
However, you should be prepared for this as it may touch the uptrend line and near the 0.006650 point and move higher.
------------------------------------------
We recommend that you trade with your average unit price.
This is because, if the price is below your average unit price, whether it is in an uptrend or in a downtrend, there is a high possibility that you will not be able to get a big profit due to the psychological burden.
The center of all trading starts with the average unit price at which you start trading.
If you ignore this, you may be trading in the wrong direction.
Therefore, it is important to find a way to lower the average unit price and adjust the proportion of the investment, ultimately allowing the funds corresponding to the profits to regenerate themselves.
------------------------------------------------------------ -----------------------------------------------------
** All indicators are lagging indicators.
Therefore, it is important to be aware that the indicator moves accordingly with the movement of price and volume.
However, for the sake of convenience, we are talking in reverse for the interpretation of the indicator.
** The wRSI_SR indicator is an indicator created by adding settings and options to the existing Stochastic RSI indicator.
Therefore, the interpretation is the same as the traditional Stochastic RSI indicator. (K, D line -> R, S line)
** The OBV indicator was re-created by applying a formula to the DepthHouse Trading indicator, an indicator disclosed by oh92. (Thanks for this.)
** See support, resistance, and abbreviation points.
** Support or resistance is based on the closing price of the 1D chart.
** All descriptions are for reference only and do not guarantee a profit or loss in investment.
Explanation of abbreviations displayed in the chart
R: A point or section of resistance that requires a response to preserve profits.
S-L: Stop Loss point or section
S: A point or section where you can buy to make a profit as a support point or section.
(Short-term Stop Loss can be said to be a point where profit and loss can be preserved or additional entry can be made through split trading. It is a short-term investment perspective.)
GAP refers to the difference in prices that occurred when the stock market, CME, and BAKKT exchanges were closed because they are not traded 24 hours a day.
G1 : Closing price when closed
G2: Opening price
(Example) Gap (G1-G2)
Aaveusd

$AAVEUSDT - Flag pattern on the watchHello everyone!
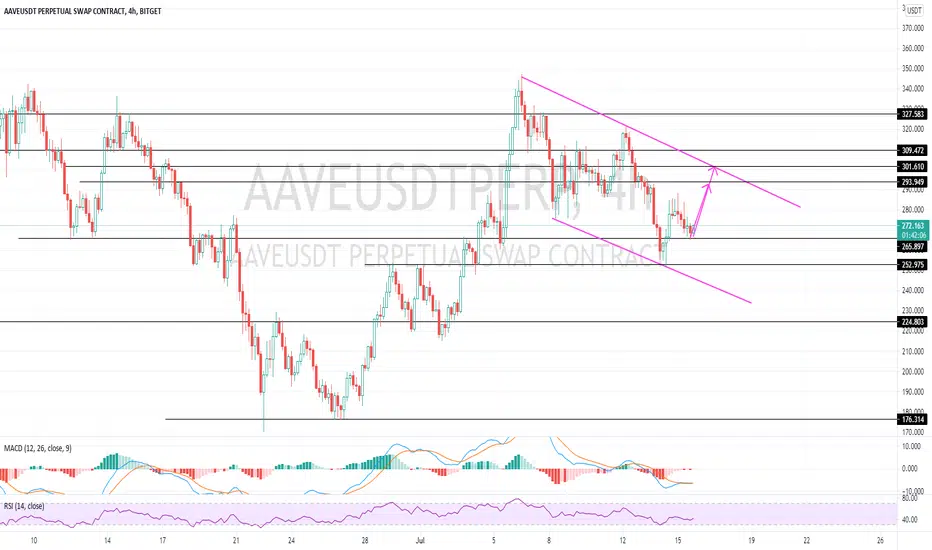
Flag pattern is spotted on a 4h AAVEUSDT chart.
The last correction ended at Fibo 0.618, so expecting a jump to 290 - 301.
Of course volumes are essential.

AAVE 1D The price is close for a tasty purchase in longWe haven't updated the idea for AAVE for half a year
Those interested can see a series of ideas on AAVEUSDT in our profile, where we described in some detail the project and our thoughts on possible future price movements.
If you look at the current AAVEUSDT chart, you can see that over the past 10 days, buyers have become more active and were able to raise the price by x2 . After that, the price hit a strong mirror level of $340 , which previously cleverly coped with the role of support.
Now the local correction of the AAVE price has begun, during which we will see how strong the buyers are.
If this correction ends around $250 , then the assumptions that there are a lot of buyers, and they are serious about driving the price of AAVEUSD higher to the next mark in the area of $500 , according to the white scenario, will be confirmed.
If sellers push the AAVE price below $250 , then the next zone where buyers should activate is in the region of $190-210 . And after a while, you can safely wait for the development of growth in the blue scenario , the upper global goal of which is in the region of $800-860
_______________________________
Since 2016, we have been analyzing and trading the cryptocurrency market.
We transform our knowledge, trading moods and experience into ideas. Each "like under the idea" boosts the level of our happiness by 0.05%. If we help you to be calmer and richer - help us to be happier :)

$AAVEUSDT - Must hit 388Hello everyone!
Two scenarios on the watch for AAVE.
Closing above the current resistance at 327-330 would be a great signal of the uptrend continuation.
If fails to close above 330, may also correct a bit and for an Inverted Head and Shoulders.
Good luck with your trades!

AAVE LONG TREND UPDATEHello trading friends,
This is a small update for AAVE
AAVE Shows a great trend for green. and possible that we can see some increase trends coming time.
Manage always your risk, and check the trend on 2 sides.
Trend expecting coming time 314 USD, and for the breakdown trend, we did add the red coffee time icon
.
there is not always a reason to enter the markets always directly Manage first the risk
Have a great coffee time!
like/follow for more content - Thank you

Aave suggests continuationAave has halved in price since it’s high.
But the recent low which almost caused RSI to bottom, marks a great increase from launch price.
Interesting hidden continuation divergence (so I share with you) plus interesting to see bounced off the 23 fib.
What’s your view on Aave?


Aave (AAVE) - June 30Hello?
Welcome, traders.
If you "follow", you can always get new information quickly.
Please also click "Like".
Have a good day.
-------------------------------------
(AAVEUSD 1W Chart)
It must move above the 300.459751 point to continue the uptrend.
(1D chart)
We will have to wait and see if we can sustain the price in the 253.495357-337.451626 range to turn into an upward trend.
In particular, you need to watch to see if it moves along an uptrend line.
If it goes down, you should check to see if it finds support at the 126.926372-169.539088 zone.
-------------------------------------
(AAVEBTC 1W chart)
If the price holds above the 0.002829-0.004956 range, we expect the uptrend to continue.
(1D chart)
We should see support at the 0.006625 point and see if we can move higher.
In particular, if the price is maintained in the range of 0.006625-0.008812, it is expected to turn into an uptrend.
You need to break out of the downtrend line to accelerate the uptrend.
If it goes down, you should check to see if it finds support in the 0.003343-0.004437 range.
------------------------------------------
We recommend that you trade with your average unit price.
This is because, if the price is below your average unit price, whether it is in an uptrend or in a downtrend, there is a high possibility that you will not be able to get a big profit due to the psychological burden.
The center of all trading starts with the average unit price at which you start trading.
If you ignore this, you may be trading in the wrong direction.
Therefore, it is important to find a way to lower the average unit price and adjust the proportion of the investment, ultimately allowing the funds corresponding to the profits to regenerate themselves.
------------------------------------------------------------ -----------------------------------------------------
** All indicators are lagging indicators.
Therefore, it is important to be aware that the indicator moves accordingly as price and volume move.
However, for the sake of convenience, we are talking in reverse for the interpretation of the indicator.
** The wRSI_SR indicator is an indicator created by adding settings and options to the existing Stochastic RSI indicator.
Therefore, the interpretation is the same as the traditional Stochastic RSI indicator. (K, D line -> R, S line)
** The OBV indicator was re-created by applying a formula to the DepthHouse Trading indicator, an indicator disclosed by oh92. (Thanks for this.)
** See support, resistance, and abbreviation points.
** Support or resistance is based on the closing price of the 1D chart.
** All descriptions are for reference only and do not guarantee a profit or loss in investment.
Explanation of abbreviations displayed in the chart
R: A point or section of resistance that requires a response to preserve profits.
S-L: Stop Loss point or section
S: A point or section where you can buy to make a profit as a support point or section.
(Short-term Stop Loss can be said to be a point where profit and loss can be preserved or additional entry can be made through split trading. It is a short-term investment perspective.)
GAP refers to the difference in prices that occurred when the stock market, CME, and BAKKT exchanges were closed because they are not traded 24 hours a day.
G1 : Closing price when closed
G2: Opening price
(Example) Gap (G1-G2)


AAVE following the General trend AAVEUSDFollowing what most cryptos are doing right, AAVE seems to wan to go lower locally. We are noting Wave A of the next ABC fractal forming. Not much to note here - other than that the Fibonacci goals is in green, cancellation/setup rejection is in red. This is not some kind of financial advice for your portfolios, so do your own research and make your own decisions about your trading or investment related moves.

AAVEUSDT IS STILL IN CORRECTIN!!AAVEUSDT cerection is not finished yet and need to go more down and then recover itself.
the target is shown in the chart, we consider 2 target, if tg1 break tg2 will be enabled.
Good luck guys, stay SAFE.

AAVEAAVE - Great looking set up if we tow the line. bidding the low in hopes of catching a wick. I personally see the support holding and being a key area of positive order demand

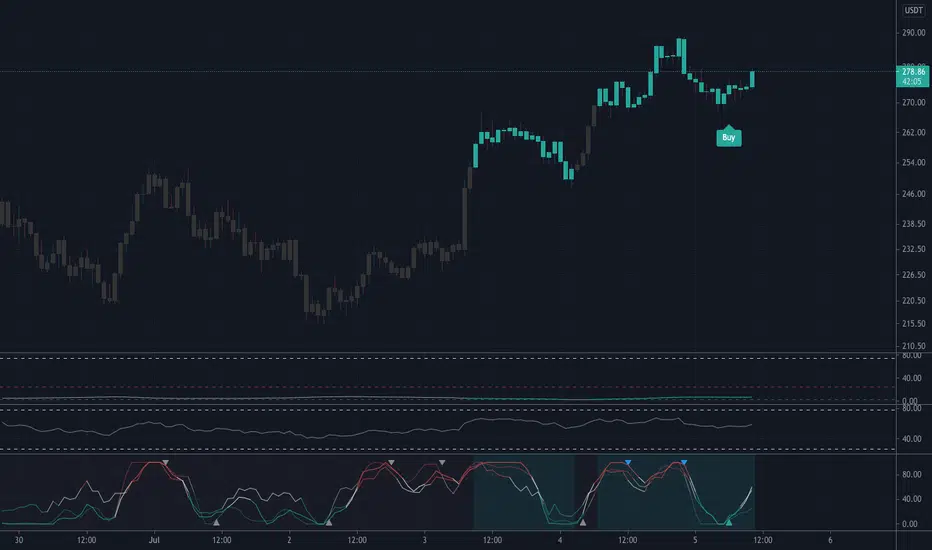
AAVE LONG TRADE 20210609 1st EntryFirst Entry for now
2nd Entry when breaks through the resistance line
Signals: Blue -> Green
AAVE, AAVEUSD,AAVEUSDT,AAVEUSDTP, CRYPTO,CRYPTOCURRENCY
DISCLAIMER
This is only a personal opinion and does NOT serve as investing NOR trading advice.
Please make your own decisions and be responsible for your own investing and trading Activities.

Aave (AAVE) - June 9Hello?
Welcome, traders.
By "following", you can always get new information quickly.
Please also click "Like".
Have a good day.
-------------------------------------
(AAVEUSD 1W Chart)
If the price holds above the uptrend line (1), then the uptrend is expected to continue.
(1D chart)
The 337.451626-379.429759 section needs to be supported and move up in order to continue the uptrend.
If it goes down from the 300.459751 point, it can touch the 169.539088 point and move up along the uptrend line, so you need to trade cautiously.
-------------------------------------
(AAVEBTC 1W chart)
Since we have created a Double Top, we expect a downtrend if we do not cross the downtrend line.
However, if it finds support at the 0.007865 point, it is expected to renew its highs.
If the price holds above the 0.004956 point, it is expected that the uptrend will continue.
If it rises along the uptrend line (1), it is expected to be a buying opportunity.
(1D chart)
It remains to be seen if the 0.008812-0.009906 zone can find support and move up.
If it falls from the 0.006625 point, you need a Stop Loss to preserve your profit.
------------------------------------------
We recommend that you trade with your average unit price.
This is because, if the price is below your average unit price, whether it is in an uptrend or in a downtrend, there is a high possibility that you will not be able to get a big profit due to the psychological burden.
The center of all trading starts with the average unit price at which you start trading.
If you ignore this, you may be trading in the wrong direction.
Therefore, it is important to find a way to lower the average unit price and adjust the proportion of the investment, ultimately allowing the funds corresponding to the profits to regenerate themselves.
------------------------------------------------------------ -----------------------------------------------------
** All indicators are lagging indicators.
Therefore, it is important to be aware that the indicator moves accordingly with the movement of price and volume.
However, for the sake of convenience, we are talking in reverse for the interpretation of the indicator.
** The wRSI_SR indicator is an indicator created by adding settings and options to the existing Stochastic RSI indicator.
Therefore, the interpretation is the same as the traditional Stochastic RSI indicator. (K, D line -> R, S line)
** The OBV indicator was re-created by applying a formula to the DepthHouse Trading indicator, an indicator disclosed by oh92. (Thanks for this.)
** See support, resistance, and abbreviation points.
** Support or resistance is based on the closing price of the 1D chart.
** All descriptions are for reference only and do not guarantee a profit or loss in investment.
Explanation of abbreviations displayed in the chart
R: A point or section of resistance that requires a response to preserve profits.
S-L: Stop Loss point or section
S: A point or section where you can buy to make a profit as a support point or section.
(Short-term Stop Loss can be said to be a point where profit and loss can be preserved or additional entry can be made through split trading. It is a short-term investment perspective.)
GAP refers to the difference in prices that occurred when the stock market, CME, and BAKKT exchanges were closed because they are not traded 24 hours a day.
G1 : Closing price when closed
G2: Opening price
(Example) Gap (G1-G2)


AAVE - 4h. The price has not yet passed the minefieldWe do not know what is more frightening for market participants at the moment - the past panic wave of the fall or the very passive recovery of the cryptocurrency market . Indeed, if we look at the charts of most coins, we see that an attempt to start a new wave of growth looks very dubious. Low trading volumes and a strong decline in volatility give the impression that coins will never recover their previous price level.
If we look at the chart of the AAVE coin, we can see that a new wave of growth in the market began on May 29. The main reason is the complete exhaustion of sellers. The rise in the price without volumes to the range of $400-430 begins to hint that at least a local correction awaits the market with the target of $355 . At this mark, there is a local upward trend line, which separates the AAVE price from a fall to $300-311 . It is in this range that buyers are very interested, starting from February 23:
On the daily timeframe, it is noticeable that this range has already withstood the sellers' attack three times. A powerful wave of the fall on May 19 was able to break through this range, triggering the triggering of a large number of stop orders. However, buyers managed to take control of this range.
We would recommend buying this token either in the range of $300-311 , or after fixing above $400-430 . The point is that low trading volumes after such impulse movements do not always mean that buyers are weak. We have already witnessed new growth impulses emerging on low volumes and sluggish candlesticks. The problem with this situation is that it is unclear why the volumes are low - either because of the weakness of the sellers and the fear of buyers who are waiting for the moment, or because the sellers are simply waiting for the necessary mark to start a new attack.
Therefore, in such situations, one should not rush to enter a position and wait for an increase in volumes.
Our subjective thought is that the cryptocurrency market has not yet made a sufficient correction after a powerful wave of decline. Of course, continued growth may not look as aggressive as it did before May. However, we expect a local market recovery.
________________________________
We create both short-term ideas (for a local understanding of the market situation) and medium-term forecasts of price movements.
Subscribe to us and get daily concise analytics!


$2400 AAVE COMING!Though $1000 might be the safe EXIT point......it wouldn't surprise me if $2500ish is actually reached by the end of this year!
this is an IMMACULTE setup with all the right structure, time symmetry, fibonacci pullbacks & extensions!
I hope you bought the $300 DIP!
