AAVE | May - June surveysApparently the price returns to touch the VMA after having made a triple low above $ 300.
What will happen now?
Will the movement be strong enough to end the month hitting $ 400 again?
We come from a sustained (and consolidated) correction movement that has been taking place since around the beginning of March and that in some way is a good consolidation zone...
On the other hand: it may just correct that downward movement that we have brought since February. The odds are there.
Who knows? At stake are the approximate marked lines.
Thanks.
Aaveusd


AAVEUSDT (1h Chart)AAVEUSDT (1H CHART) Technical Analysis Update
Triangle Breakout
AAVE/USDT currently trading at $395
Buy-level: $385- $395
Stop loss: Below $355
Target 1: $415
Target 2: $440
Target 3: $460
Target 4: $480
Max Leverage: 3X
ALWAYS KEEP STOP LOSS...
Follow Our Tradingview Account for More Technical Analysis Updates, | Like, Share and Comment Your thoughts.

Inverse HnS$aave #aave inverse HnS coming out of double bottom pattern. neckline has confluence with .618 fib level. A break above with confirmation of hourly close would be very bullish IMO
DYOR and GL!

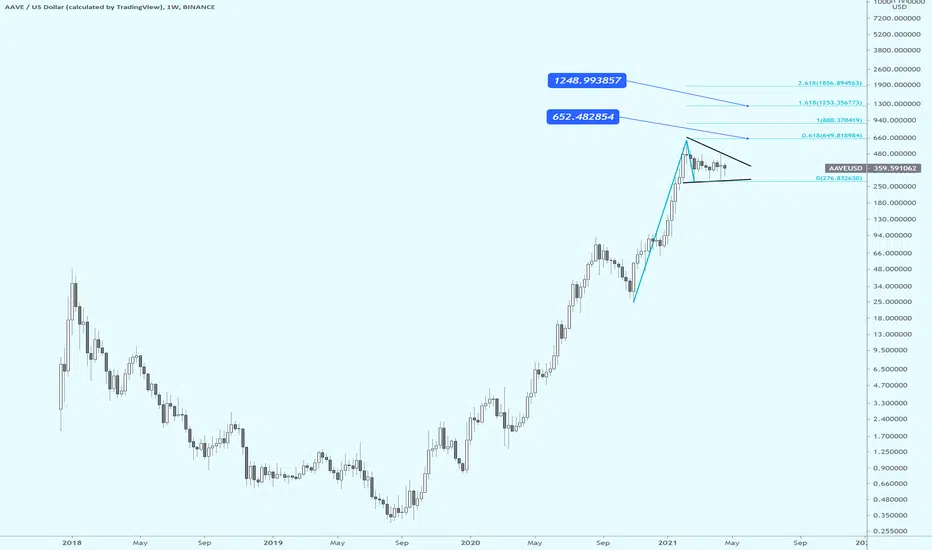
AAVE finalizing giant bull flag with 1.618 ext target to $1248Weekly chart on AAVE is mind blowing.
But, the chart says this can run much, much higher. Might crab a bit while longer, but rest assured, AAVE is going to breakout of the flag and it will run hard.
Elliott Wave Analysis: AAVE In A Complex Deeper CorrectionHello Crypto traders!
Today we will talk about AAVEUSD, its price action from technical point of view and wave structure from Ellott Wave perspective.
AAVEUSD has already found the top at the beginning of February and since then, we see see slow price action and corrective wave structure.
It's ideally trading in a complex 7-swing (w)-(x)-(y) corrective drop, which seems to be unfinished, as we see an incomplete decline into wave (y), so watch out for further weakness towatds projected 210-145 support zone before bulls show up again.
Be humble and trade smart!
If you like what we do, then please like and share our idea!
Disclosure: Please be informed that information we provide is NOT a trading recommendation or investment advice. All of our work is for educational purposes only.

AAVE Weekly Bull EntryBullflag printed on the weekly
Would enter this if I had more capital
Looks real good

Alts UpdateAll Alts trade are still valid, BTC does this flash crash in every bullrun but its just a correction not a dump, do not scare and do panic sell on red candle ever

AAVE/USDT FREE SIGNALPair: AAVE/USDT
Type: Regular
Suggested buy-in: $415
Suggested Targets: $490 - $540
Suggested Stop loss: Right below the previous High Low - $340
I am not your financial advice. No matter how accurate something can be I always suggest that you do your own research and use your own risk management strategy. Use the above numbers as suggestions and not a rule.

AAVE'S Dilemma I'm 70% bullish! However let's see how it plays out!
Enter the trade on triangle breakout!
Aave (AAVE) - April 17Hello?
Dear traders, nice to meet you.
By "following" you can always get new information quickly.
Please also click "Like".
Have a good day.
----------------------------------
We have to see if we can get support at 437.866003 and rise above 505.364160.
If you decline at 379.429759, you need a short stop loss.
If you go down at 300.459751, you need Stop Loss to preserve your profit and loss.
The next volatility period is around April 27th.
-----------------------------------
(AAVEBTC 1D chart)
We have to see if we can get support at the 7167 Satoshi point and climb above the 7865 Satoshi point.
If you fall from the 6500 Satoshi point, you can touch the 5390 Satoshi point, so you need a Stop Loss to preserve profit and loss.
-------------------------------------------------- -------------------------------------------
** All indicators are lagging indicators.
So, it's important to be aware that the indicator moves accordingly with the movement of price and volume.
Just for the sake of convenience, we are talking upside down for interpretation of the indicators.
** The wRSI_SR indicator is an indicator created by adding settings and options from the existing Stochastic RSI indicator.
Therefore, the interpretation is the same as the conventional stochastic RSI indicator. (K, D line -> R, S line)
** The OBV indicator was re-created by applying a formula to the DepthHouse Trading indicator, an indicator that oh92 disclosed. (Thank you for this.)
** Check support, resistance, and abbreviation points.
** Support or resistance is based on the closing price of the 1D chart.
** All explanations are for reference only and do not guarantee profit or loss on investment.
Explanation of abbreviations displayed on the chart
R: A point or section of resistance that requires a response to preserve profits
S-L: Stop Loss point or section
S: A point or segment that can be bought for profit generation as a support point or segment
(Short-term Stop Loss can be said to be a point where profits and losses can be preserved or additionally entered through installment transactions. It is a short-term investment perspective.)
GAP refers to the difference in prices that occurred when the stock market, CME, and BAKKT exchanges were closed because they do not trade 24 hours a day.
G1: Closing price when closed
G2: Cigar at the time of opening
(Example) Gap (G1-G2)

$AAVEUSDT - Breakout confirmationHello everyone!
Was waiting for this signal since last week and here it is, aave completed a breakout from the bullish flag, heading towards new highs.
Watch for resistances!

AAVEUSDAAVE look good! He are out from triangle and goes up!
$$$
The information and publications are not intended to be and do not constitute financial advice, investment advice, trading advice or any other advice or recommendation.

AAVE It broke out from its declining chanel which is a good sign in short term.
We can enter the trade If the price consolidated above the broken chanel

AAVE MariaAAVE back test bounce complete...now need to break 420 to sky rocket to target of 650.
DYOR and GL!


Aave (AAVE) • About to break into new HighsOk. Volumes and break of price structure coming from spot and swaps are looking very strong here for AAVE.
It means that is probably time to long the longs.

#AAVE #DEFI - SWING LONG (Closed inside golden pocket) 32% Move#AAVEUSDT #DEFI
Daily Time Frame -
Set up - Falling Wedge Inside Golden pocket
Entry - $370.97
Stop loss - $336
Leverage - 10 x
Exit - Target 1 $441, Target 2 $493
ROI - 32% on spot
We can see on the Daily Time Frame, Aave Bulls have pushed to close inside the 0.38% Fib, while also retesting the falling wedge set up.
Aave should now attempt to push to the 0.618% Fib + Upper order block resistances.
There will be other resistances along the way up, but these are the main resistances we are targeting.
Once we reach the upper order block resistances, i will be looking for a flip into support before re entering longs if further upside is coming.


Waiting for price reduction
Between an important support and resistance that has already touched the resistance and is returning to support .......

AAVE completing a cup for another ATH?AAVE broke the downtrend, given by the blue lines, about to make this bullish cup. The red lines are the main resistance levels to watch.
not financial advice

Aave haave potenialI would like to see another re-test of the $345 support, as you will observe, all lines in the structure have been tested 3 times with the exception of this support.
Usually third time is the charm, so if this holds, I expect price action to break the hypotenuse of the triangle.
If it doesn't hold, we buy the bottom resistance line, in which cases the targets change slightly.
Either way, look for buys in the buy-zone.
Then look to fill the rest of your bags on the re-test.
First price target is around $500. but the final target will be almost 60% higher than the current price.
What do you think of Aaves place in the lending / banking / yield farming arena?
Let me know in the comments.
