AAVE attempting breakoutBounced of midchannel and 50% RSI which is bullish. In my opinion it will breakout and at least reach first target. Don't understand this Alts season but It's wants to moon.
Aaveusd

AAVE/USD - Clear path to $250!AAVE is in a clear ascending trend towards $250. I do not see much stopping us reaching that level, we passed local resistance (dotted line) and we're clear to go up.
Indicators are looking good as well, so I would not be surprised to reach $250 fairly soon! At that point expect a reaction and a re-test of previous resistance turned support. We may drop lower after that, but that is still unclear now, first we need to find our top.
Overall a great long opportunity here.
Like and follow if you liked this idea!

A CUTTING EDGE Project - Insane potentialI won't go much into technicalities but more into project fundamentals.
DeFi looks like it's going to explode in 2021 at only about a 30 Billion dollar market cap.
It's basically in infancy. And for me, by the end of 2021, it could grow by tenfold.
When it comes to AAVE, 3 billion dollars is locked into AAVE alone - It's the largest crypto DeFi project by market cap.
The total supply is 16 million tokens, 3 million will be allocated to the AAVE ecosystem reserve. The inflation rate of about 1.2% per year.
Aave is in the process of receiving the necessary licenses they need to make it possible for users to buy assets in Aave directly using fiat. Aave received the first of these licenses in July from the UK Financial Conduct Authority.
Aave also received over 25 million dollars in funding from various venture capital firms in October 2020. The purpose of those funds is to bring in more institutions and expand Aave’s operations into Asia.
That is why I think AAVE is not only going to be the largest DeFi project but one of the largest in the whole crypto market.
Remember when Bitcoin was about $1000? ;)

AAVE to $100Never owned or traded this, not looking to short. Doing TA to see a buy opportunity. It should reach $400 in the next alts cycle.

AAVE/USD - Momentum fading, expect some cooldown to $180AAVE is looking for a break in this ascending momentum. Indicators are looking rather bearish short term, so I would not be surprised to see us re-testing the support line at just under $180. My short term bias is thus bearish.
This diagonal support on which we rallied since early January seems to reach it's final stages. Thus I expect us to break-down soon.
Short of a miracle, I do not see how we would pump to $250 this month. We need to range/refuel for that as the chart stands now.
If we drop to $180, then that is a great buy area for the next leg up, but be careful, we need to make sure we continue the bull run and not fall to $130. We can see later on that.
AAVE is one of my top altcoin picks for 2021 - see below the link to the full article.
Like and follow if you liked this idea!

AAVE Trend Line Retest: Target 190LINK, ETH with the same PA. Pump after breakout of wedge/triangle, dip to retest the trend line and give more buyers an opp to long, then really pump to new highs
Bid scaled in from 185-195

AAVEUSD (Next Target 240!)AAVEUSDT (1h CHART) Technical Analysis Update
Symmetric Triangle breakout
AAVE/USDT currently trading at $202
LONG Entry level: $198 to $202
STOP LOSS: below 190
Target 1 : $220
Target 2 : $240
Max Leverage: 3X
ALWAYS KEEP STOP LOSS...
Follow our Tradingview Account for more Technical Analysis Update, | Like, Share and comment your thoughts.

AAVE About to gain ANOTHER 100%AAVE gained 100% in 5 days last week.
It's ready to gain another 100%, in a very short time period. Most probably next week.
For me, mid-term target is at least $1000 where I might start taking some profits.
Not a trading advice.

$AAVEUSD - Correction aheadHello everyone!
AAVE formed an expanding diagonal and just now tested the dynamic resistance, though the impulse is strong, I believe it will correct here.
TP levels are on the chart. Trade with caution, do not forget about risk management

AAVE 1D Correction to $110 and then we will seeThe AAVEUSDT idea has not been updated for more than a month, but it's time, because the previous idea worked out only for the first target of $63.
And then the rebound turned into a powerful growth , which still continues.
Though, this growth has reached the Fibo level, similar to the Fibo level BTCUSDT at $42,000, and we know what happened with Bitcoin.
As of now, the high was $146 and the Fibo level was $150. Therefore, we assume that at least a correction to the level of $110 can begin.
At this level the further directions of the price movement will be solved:
Growth to $190.
Whether a break of the wedge down with the first target in the liquidity zone of $75-90 , and maybe with the fall continuation to $62.
_______________________________
Since 2016, we have been analyzing and trading the cryptocurrency market.
We transform our knowledge, trading moods and experience into ideas. Each "like under the idea" boosts the level of our happiness by 0.05%. If we help you to be calmer and richer - help us to be happier :)


AAVEUSD (Waiting for the broadening wedge Breakout)#AAVEUSDT ( 4H chart) Technical Analysis Update
Waiting for the Broadening Wedge Breakout
AAVE/USDT currently trading at $141.5
Long Entry-level: Above $147 (only enter long after 4 h candle closes above the resistance level at $147)
STOP LOSS: I will update once I see the breakout
Target 1: $165
Target 2: $180
Max leverage: 3X
ALWAYS KEEP STOP LOSS..
Follow our Tradingview Account for more Technical Analysis Update, | Like, Share and Comment your thoughts.


AAVEUSDT - Potential breakdown 🔽AAVEUSDT is testing the major ascending channel resistance as shown in my previous analysis .
RSI is printing a bearish divergence signal.
Price action printed a rising wedge pattern and price brokedown below the wedge support.
Price action is printing a descending triangle pattern.
Sell entry ⬇️ - breakdown below the descending triangle support.
Target 🎯 - Support levels.
Setup invalidation ❌ - breakout above the descending triangle inclined resistance.

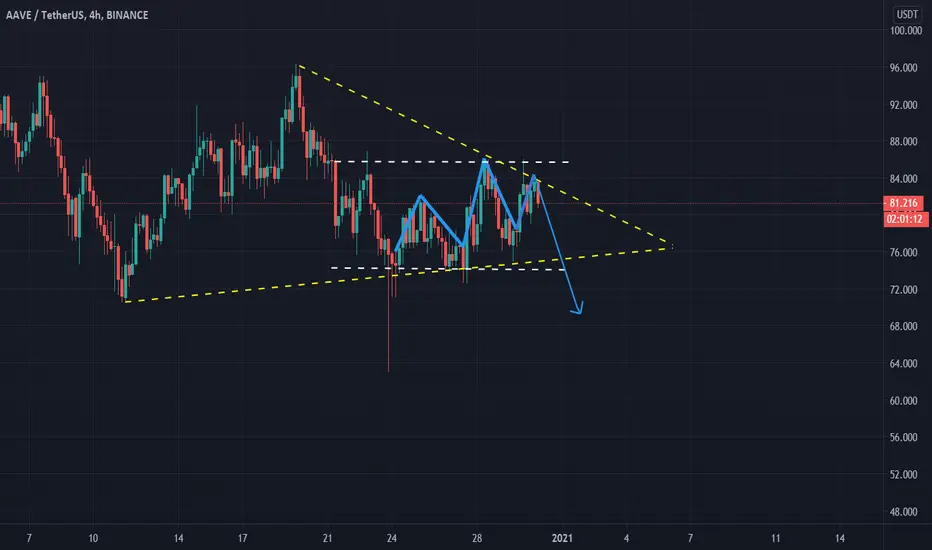
$AAVE - Looking to longHello everyone!
I'm thinking that DeFi impulse is yet to come and we will see higher highs of DeFi tokens.
Starting with Aave, I don't think that there is a double top pattern on AAVEUSD as the right top is higher than the left one, so it rather makes a wedge.
Nevertheless, the impulse looks stronger that the previous and the dynamic support may be broken, the first static support to watch would be 80.339
The most important is at 71, below which will confirm the double top but for now I'm thinking of longing Aave.

AAVEUSDT - Daily analysis AAVEUSDT is printing an ascending channel on the Daily timeframe.
Price is testing the channel resistance.
We could see a retracement back to the channel support.

AAVEUSDT - Potential sell entry 🔽AAVEUSDT is printing a rising wedge pattern.
Price brokedown below the wedge support.
Sell entry ⬇️ - breakdown below the previous swing low.
Target 🎯 - Support levels.
Setup invalidation ❌ - breakout above the rising wedge high.

AAVEUSD (Waiting for the Resistance Zone Breakout)#AAVEUSD Technical Analysis Update
Waiting for the Resistance zone Breakout in 4h chart
AAVE/USD currently trading at $89.60
LONG ENTRY: Above $100 (Only enter long if 4 h candle close above $100)
STOP LOSS: I will update once I see the Breakout
Max leverage: 3X
ALWAYS KEEP STOP LOSS...
Follow our Tradingview Account for more Technical Analysis Update, | Like, Share and Comment your thoughts.


AAVEUSDT 🔽AAVEUSDT brokedown below rising wedge support.
RSI is printing a bearish divergence signal.
Possible correction ⬇️
Target 🎯 - Support levels.
Setup invalidation ❌ - breakout above the ATH

$AAVEUSD Hi everyone, just wanted to share my insights into AAVEUSD. This is not trading advice.
I'm long and holding it since I think this asset is going to explode.
Expecting $1000-$1500 in the next 12-28 months.

