AAVE Long idea. i believe that will happen. it is possible for this scenario to happen in most altcoins, if bitcoin does not fall below 68k, we are still in the bull. Good Luck. make money.
Aaveusd

Aave (AAVEUSD): Setting Sights on Long-Term GrowthAave (AAVEUSD): BINANCE:AAVEUSD
Aave is considered a very interesting cryptocurrency for us, both fundamentally and technically. We have concluded the overarching Wave II at $45.28. Since then, there has been a sideways movement, but it's essential to note that we are in the overarching Wave III. The minimum target for this Wave III is currently an 871% increase, which is a tremendous surge and is considered realistic over a very long-term scenario. This won't happen today, tomorrow, or even in the next few months, but it remains a highly interesting coin for the long term.
Currently, we are subordinately finishing up a Wave (1) and are in the process of completing Waves 3. Zooming in further, we are in the midst of completing the encircled Wave ((iii)). This should reach between 61.8% and 100%, equivalent to $132 and $163. After this, we should see a pullback for Wave ((iv)) before completing the overarching Wave 3. We will be looking for an entry for this Wave ((iv)).

AAVE - BUY SETUP (NOV 2023)AAVE - BUY SETUP (NOV 2023)
Based on technical analysis, the current setup of this coin appears to offer a favorable buying opportunity. The price action and Key indicators signal promising trends, suggesting a potential advantageous entry point. However, prudent consideration of market volatility and risk management is essential before making any investment decisions in the cryptocurrency market.

AAVEUSDT - Bouncing back from the support#AAVEUSDT (4H Chart) Technical Analysis Update
AAVE is bouncing back from the support.
As you can see in the chart, this is the 4th time its bouncing back from support and every time it bounced back from the support it made significant gain.
AAVE/USDT currently trading at $85.24
Entry Level :$ 85-84
Stop Loss: Below $82.52
Resistance level 1(Target) : $87.48
Resistance Level 2(Target): $91.9
Resistance Level 3(Target): $95
Resistance Level 4(Target): $99.65
Risk Reward Ratio : 1:5.2
Max Leverage: 5X
ALWAYS KEEP STOP LOSS...
Please Follow us, Like, Share and Comment your thoughts

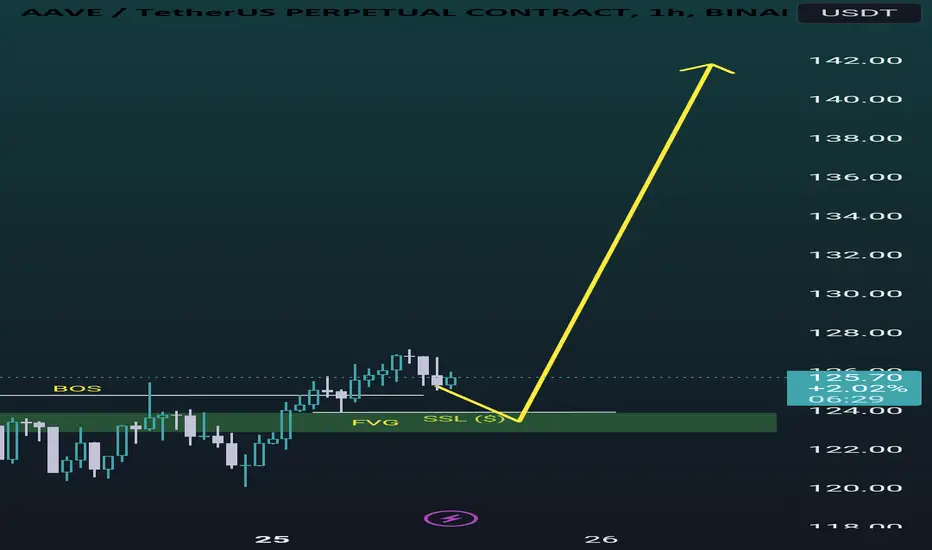
Aave bullish structure continue AAVE/USDT 1H Chart.
A clear break of structure (BOS) happened which has left a fair value gap.
This FVG is our Poi to Enter the Trade.
Do your analysis.
AAVE IS VERY BULLISHFrom the place we inserted "start" on the chart, it looks like a diametric has started.
Wave D seems to be a diametric, and only wave g is left of this diametric. In the coming days, with the completion of wave g from D, the bullish wave E is expected to start.
By maintaining this range, it is expected to move towards TPs.
Closing a daily candle below the invalidation level will violate the analysis.
For risk management, please don't forget stop loss and capital management
When we reach the first target, save some profit and then change the stop to entry
Comment if you have any questions
Thank You

AAVE - Bulls Chart 🐂AAVE recently broke the descending triangle that had been supporting the price since June 2022.
I will wait for a more significant price correction (retest), as the price is overbought and showing negative RSI divergence on the daily timeframe.

AAVEUSDT is bullish targetting 243-262 zoneThe price has been moving up after consolidating between two monthly zones currently marked as MS1 and MS2. This is a very nice pattern to identify for the bullish move and it was there in this case. Very beautifully the price osciallated between these two zones for a long time before moving beyong the MS1 zone. Everytime the price was pushed down from MS1 zone, it found support on MS2 zone and had a bounce. After going beyond the MS1 zone, it was rejected by the weekly resistance WR1 zone but monthly support zone MS1 provided the needed support and the price bounced from there. This was another opportunity to go long as this was breakout retest. Now on this bounce from MS1 zone, the price has managed to move beyond that WR1 zone and currently trading above it. This opens the way for the price to target the next resistance which is monthly resistance MR1 and that zone lies around 243-262. I think the price is likely to hit that zone in coming weeks. We will have a look how it behaves at that resistance but there would be a considerable pullback at that level. So if long, booking profit at that level would be a good idea.


DeFi Categories (PUMP) AAVE 102.70 >>> $239.00Everyone has already noticed the sharp rise in Uniswap (UNI/USDT), with all DeFi projects starting to grow actively. You already know the forecast for Compound; I've decided to include AAVE in the portfolio for the pump as well. The targets on Coinbase are promising.
Uniswap Foundation has published a proposal to reward some UNI holders. According to Coinmarketcap, the native token surged by 74%.
Entry Price: $102.70
Take Profit 1: $205.40 (50%)
Take Profit 2: $289.00 (16.6%)
Take Profit 2: $589.00 (16.6%)
Take Profit 2: $889.00 (16.6%)
So, when the price doubles, take out your initial investment; I've indicated the other targets. Secure profits evenly :).
Chain Knights Premium ✅️
The best way to show gratitude is by registering through the links below. In return, you'll gain access to the Premium group where I'll share more confidential information, plus there will be prize draws among my clients who registered through my referral link on the crypto exchange provided below.


AAVE to 60 USDAnalyzing the Potential Downturn of AAVE: A Descending Path from $92 to $60
As we scrutinize the dynamics surrounding the cryptocurrency Aave (AAVE), an in-depth analysis points towards a potential downturn, with the coin's value possibly declining from $92 to $60. Several key factors contribute to this forecast, including a breach below the established trendline, the likelihood of breaking through the MACD trend, and an emerging negative trajectory in the MACD indicator.
The first ominous sign is the breach below the long-standing trendline that has historically guided AAVE's price movement. The deviation from this trendline indicates a potential shift in market sentiment, suggesting a weakening of the previously dominant bullish trend. Market participants are advised to closely monitor this breach, as it often serves as an early signal for a broader correction.
The Moving Average Convergence Divergence (MACD) indicator, a widely followed momentum oscillator, further substantiates the potential downturn. The MACD trend is on the verge of breaking into negative territory, indicating a diminishing bullish momentum. This impending shift is a cause for concern, as it may trigger a reevaluation of positions among market participants, potentially leading to a cascade of sell-offs.
Moreover, the convergence of these factors points towards the likelihood of AAVE's value declining to the $60 mark. Traders and investors should exercise caution and consider implementing risk management strategies in anticipation of this potential downturn. It is crucial to remain vigilant in monitoring price developments, as sudden market shifts can occur, altering the trajectory of any cryptocurrency.
In conclusion, the analysis of Aave's current market dynamics suggests a plausible scenario wherein the coin's value may decline from $92 to $60. Traders are strongly urged to conduct thorough research, exercise caution, and adapt their strategies in response to evolving market conditions.

AAVE breaking out on H4 waiting for pumpEURONEXT:AAVE Long / Spot (Swing)
Entry: $89.6 - $85.5
TP1: $95.28
TP2: $118.03
SL: H4 close below $84.25
Take 25% entry at around 89.6 and remaining it parts around $86, use the entry area/green bo to average your entry, try to bring your entry closer to $87. It can take a week to play out so keep that in mind.

AAVE LOOKS BULLISHAAVE has an ascending structure. We constantly see higher floors and ceilings.
The candles are in an ascending logarithmic channel.
The green area is the rebuy zone. If AAVE maintains the green range, it can move towards the specified targets.
The stop should be somewhere below the green box.
For risk management, please don't forget stop loss and capital management
When we reach the first target, save some profit and then change the stop to entry
Comment if you have any questions
Thank You

AAVE/USDT potential shift? ? 👀 🚀AAVE Today analysis💎 Paradisers, set your sights on AAVEUSDT! After facing rejection from a higher supply level, it's now navigating within a demand zone, hinting at a heightened likelihood of a bullish trajectory.
💎 In our recent observations, AAVEUSDT managed to break free from its descending channel, embarking on a bullish journey. Currently, the market sentiment leans towards the bullish side, especially as AAVE operates within a demand zone. A deeper dive reveals substantial volume at this level, further amplifying the chances of an upward shift.
💎 On the flip side, should the asset breach the 75.65 demand level, we could witness a pronounced decline, potentially reaching a robust support level. Stay alert and strategize accordingly!

Candle of breaked(AAVE)❤️❤️Thanks for boosting 🚀 and supporting us!
📈When I am in a reng and that reng is broken with a powerful candle, I can decide to follow the same process from the broken side, and AAVE has exactly the same conditions.
📊 (Entry) : 119.57
🔴 Stop Loss : 111.34
🎯 Take Profit : 125-131-138-144
🔗 For more communication with us, In the footnote and send a message in TradingView.
👨🎓 Experience and Education: Our trading team has five years of experience in financial markets, especially cryptocurrencies.

⚡️AAVEUSDT CMC TRADING ⚡️ FALLING WEDGEA falling wedge pattern has been identified in the AAVEUSDT pair within the hourly timeframe, signaling the potential for an upward momentum. The breakout above the upper boundary of the wedge is a significant development. Our anticipation involves a rally or movement towards the next major supply zone that has been highlighted.

AAVEUSD: Overbought but can do one last spikeAAVEUSD got overbought on the 1D timeframe (RSI = 70.408, MACD = 2.580, ADX = 34.530) after the strongest two day rise of the current Bull market. The pattern is a Channel Up, which has long turned the 1W MA50 into Support and despite the overbought technicals, it can extend up to 1W MA200, which is the last Resistance remaining and the level that rejected the crypto on August 8th 2022 and May 30th 2022. As a result we will remain bullish up to 140.00 and then buy as it approaches the 1W MA50 near the 0.236 Fibonacci level. That buy's target will be the 0.618 Fibonacci (TP = 240.00).
## If you like our free content follow our profile to get more daily ideas. ##
## Comments and likes are greatly appreciated. ##

AAVEUSDT 1D LONG📈Hi all. AAVEUSDT has been forming a wedge for 1.5 years. I consider a long break/retest. Depending on your type of trading, it is possible to set up in spot and trade inside the wedge. Marked targets and levels on the chart.

AAVE/USDT bullish ride ? 👀 🚀AAVE Today Analysis💎 Paradisers, focus on #AAVEUSDT as it shows a significant opportunity for growth. Currently trading in a demand zone and maintaining robust momentum above the EMA, AAVE is hinting at a strong probability of a bullish movement.
💎 Reflecting on #AAVE recent market behavior, we’ve observed a pattern where resistance levels have turned into support, leading to upward movements. After a rejection from a short-term supply level and a retest of the support creating an equal low, it now appears poised for a bullish shift.
💎 Its substantial momentum above the EMA, coupled with the strengthening demand zone, bolsters the bullish outlook. If #AAVE continues this upward momentum, it's targeting resistance levels at $115.13 and $137.40.
💎 However, in the dynamic realm of trading, #AAVE traders must stay prepared for various possibilities. Should #AAVE fail to sustain its bullish momentum and fall below the current demand level, a different market response might emerge. Be ready for a potential bullish recovery from another key support level of $92.86. Nevertheless, a drop below this crucial level might signal challenges in maintaining the bullish trend.🌴💰

Entry by trigger zone When we are in suffering, we should wait for the process to move from one side and make our entry according to the movement.

AAVE/USDT Bullish Prospects at Key Support? 👀 🚀Today analysis💎 Paradisers, gear up for a promising opportunity with AAVEUSDT. Currently holding key support, the asset exhibits a high probability of initiating a bullish move.
💎 #AAVE has a track record of following a descending trendline, breaking above it to embark on an upward trajectory. It is now regaining bullish momentum and appears set for another attempt to breach resistance. This setup presents a substantial chance for a bullish movement. With continued upward momentum, AAVE aims to target the resistance at $93.55, and potentially challenge even higher resistance levels at $162.30.
💎 For the sagacious Paradisers, capitalizing on this scenario requires precise timing. Identifying the most favorable entry points during this expected rise is crucial, as well as exercising caution to avoid entering at the market's peak. Additionally, for #AAVE, be prepared for a possible bullish rebound from the support level of $72.46, particularly after breaking the support at $83.40. However, a drop below this support level could signal challenges in maintaining the bullish trend.
💎 In this fluid and ever-changing market environment, strategic foresight and skilled decision-making are essential. Crafting a comprehensive trading strategy that includes effective money management and a deep understanding of support and resistance levels is key to achieving successful trading outcomes. 🌴💰

"Unveiling Crypto Riches: A Deep Dive into Aave's Rollercoaster How much does Aave command in value today?
As of now, the current price of Aave stands at $93.52, accompanied by a 24-hour trading volume totaling $157,652,499. Over the past 24 hours, Aave has experienced a slight dip of 2.39%. In the CoinMarketCap ranking, Aave holds the #45 position, boasting a live market cap of $1,349,392,224. The circulating supply of AAVE coins is recorded at 14,634,359, while the maximum supply reaches 16,000,000 AAVE coins.
A dive into Aave's price analysis reveals a competitive struggle between bulls and bears. The AAVE/USD price has established support at $87.00, encountering resistance at $95.50. The recent analysis indicates a 2.32% decrease over the past 24 hours, bringing the price down to $93.52 from its intraday peak of $95.34. This downturn suggests a bearish trend in the short term, aligning with broader market sentiments. The bears have successfully sustained their momentum, pushing AAVE down and establishing support at $87.00.
Amidst recent market volatility, Aave has faced its share of fluctuations, undergoing a significant price correction after reaching record highs this week. The correction resulted in a loss of over 4% in value over the past seven days. Such corrections are not unusual, as various cryptocurrencies experienced similar adjustments during this timeframe.
Despite the market's challenges, the Aave ecosystem continues to attract investors with its expanding community and lucrative opportunities. Aave's unique offerings, including lending, borrowing, and interest-earning on crypto assets without intermediaries, contribute to its appeal. However, like many DeFi projects, Aave remains susceptible to potential attacks by malicious actors exploiting vulnerabilities in the system. BITFINEX:AAVEUSD
