AAVEUSDT - UniverseMetta - Signal#AAVEUSDT - UniverseMetta - Signal
H4 - Formation of ABC structure in continuation of the upward trend. Stop behind the local minimum.
Entry: 256.92
TP: 269.60 - 286.82 - 297.27 - 313.94
Stop: 249.01
Aaveusdt

ALTS - Altcoins you MUST WATCH for ALTSEASON1) ONDO | BYBIT:ONDOUSDT
After some consistent higher lows, ONDO is likely on its way back towards it's previous ATH:
2) ATOM | BINANCE:ATOMUSDT
Cosmos is one of my favorites, and I'm patiently waiting for the parabolic run on this one:
3) SONIC | BYBIT:SONICUSDT
SONIC / previously FTM is trading nearly 290% away from its previous ATH, with great upside potential.
4) AAVE | BINANCE:AAVEUSDT
AAVE still has a bit to gain before reaching its previous ATH, and the parabolic run has actually already started:
5) ENA | BINANCE:ENAUSDT
IF ENA can hold it's current support, there's a huge upside awaiting this alt:
😊🧡 Please like and follow !!

Aave —Full Correction Is Good (Low Prices)A "bear market" cannot develop after a full correction. It doesn't make sense...
AAVEUSDT peaked 16-December 2024 and it has been red. And some people are saying, "It is going to go down. The start of a bear market." It already went down. The bullish action here started in October 2024 and has been corrected by more than 100%.
The action before and lower prices were all part of a long-term consolidation phase.
It took forever. Aave bottomed in June 2022 and consolidated for so long. Then, last year, it produced a strong advance. This is not the end, this is the start.
This advance ends in a higher low as the chart shows today, from this higher low we will get a continuation and establishment of a bullish trend.
For a bull-trend all we need is higher highs and higher lows. It is inconceivable to think that AAVEUSDT will break below its June 2022 low. Impossible. It will be going up.
So we have the first high and now the higher low, when the next advance happens, you have your higher high and that's it, that's how a bull market works.
The next high will produce the same results. A correction and this correction will end higher compared to the current low. This higher low will produce one final advance and this advance will be marketwide, the 2025 bull market bull run, projected to happen in late 2025.
Now, you cannot buy when prices are high, only when prices are low.
Right now, AAVEUSDT is trading at the lowest prices possible. It is trading within the same consolidation range that was active since mid-2022. This is as low as it can go.
This is a great opportunity. No bear market, we are in a bull market year and we are only weeks away before the start of the 2025 bull market cycle, the best and biggest bullish phase since 2021. It will be awesome.
The chart reveals everything you need to know.
The bottom, but also the top.
Namaste.

AAVE analysis : from Tokenomics to Technical analysisAAVE projet is on of the strongest projects in crypto space.
The whales present in this project count for 70% and the majority of them holds their wallets at least 2 years from now.
The analysis of the supply demonstrates that during the accumulation phase 3% of the total supply have been added to the market without any major impact on the price , that means that the whales have intention of accumulating this token.
The anchored volume profil also demonstrates that we are near the value zone.
From my technical analysis I expect a first target of $400. Then we will begin to see the first distribution movement of the whales.

AAVE/USDT – First Support in the Blue BoxI’ve been watching AAVE/USDT for a minute and there’s one zone I’m eyeing — that blue box. Moving in before you see real proof down there is a fast track to getting stopped out. Picture price drifting into that area, you buy on hope alone, and then it slices through without warning. That’s how shorts hunt liquidity and leave you scrambling.
What I need to see before I pull the trigger is clear confirmation: a CDV-volume spike that shows smart money stepping in, a quick low-timeframe break below then reclaim that zone, even an order-flow flip with aggressive bids coming in. Anything less, and I’m happy to stay on the sidelines. When that setup finally lights up — the volume lines up with the CDV divergence, the chart on the one- or five-minute frame prints a break-and-retest, and order flow shifts to the buy side — that’s when I lean in. Miss it if you want, but when it fires, waiting too long feels a lot worse than being a bit early.
📌I keep my charts clean and simple because I believe clarity leads to better decisions.
📌My approach is built on years of experience and a solid track record. I don’t claim to know it all but I’m confident in my ability to spot high-probability setups.
📌If you would like to learn how to use the heatmap, cumulative volume delta and volume footprint techniques that I use below to determine very accurate demand regions, you can send me a private message. I help anyone who wants it completely free of charge.
🔑I have a long list of my proven technique below:
🎯 ZENUSDT.P: Patience & Profitability | %230 Reaction from the Sniper Entry
🐶 DOGEUSDT.P: Next Move
🎨 RENDERUSDT.P: Opportunity of the Month
💎 ETHUSDT.P: Where to Retrace
🟢 BNBUSDT.P: Potential Surge
📊 BTC Dominance: Reaction Zone
🌊 WAVESUSDT.P: Demand Zone Potential
🟣 UNIUSDT.P: Long-Term Trade
🔵 XRPUSDT.P: Entry Zones
🔗 LINKUSDT.P: Follow The River
📈 BTCUSDT.P: Two Key Demand Zones
🟩 POLUSDT: Bullish Momentum
🌟 PENDLEUSDT.P: Where Opportunity Meets Precision
🔥 BTCUSDT.P: Liquidation of Highly Leveraged Longs
🌊 SOLUSDT.P: SOL's Dip - Your Opportunity
🐸 1000PEPEUSDT.P: Prime Bounce Zone Unlocked
🚀 ETHUSDT.P: Set to Explode - Don't Miss This Game Changer
🤖 IQUSDT: Smart Plan
⚡️ PONDUSDT: A Trade Not Taken Is Better Than a Losing One
💼 STMXUSDT: 2 Buying Areas
🐢 TURBOUSDT: Buy Zones and Buyer Presence
🌍 ICPUSDT.P: Massive Upside Potential | Check the Trade Update For Seeing Results
🟠 IDEXUSDT: Spot Buy Area | %26 Profit if You Trade with MSB
📌 USUALUSDT: Buyers Are Active + %70 Profit in Total
🌟 FORTHUSDT: Sniper Entry +%26 Reaction
🐳 QKCUSDT: Sniper Entry +%57 Reaction
📊 BTC.D: Retest of Key Area Highly Likely
📊 XNOUSDT %80 Reaction with a Simple Blue Box!
📊 BELUSDT Amazing %120 Reaction!
📊 Simple Red Box, Extraordinary Results
I stopped adding to the list because it's kinda tiring to add 5-10 charts in every move but you can check my profile and see that it goes on..

#AAVE #AAVEUSD #AAVEUSDT #Analysis #Eddy#AAVE #AAVEUSD #AAVEUSDT #Analysis #Eddy
As can be seen in the chart, the price has moved towards the supply area with a compression and has formed the 3-drive and can fall from the indicated supply area towards the daily demand zone.
I have identified the important supply and demand zones of the daily timeframe for you.
This analysis is based on a combination of different styles, including the volume style with the ict style.
Based on your strategy and style, get the necessary confirmations for this analysis to enter the trade.
Don't forget about risk and capital management.
The responsibility for the transaction is yours and I have no responsibility for your failure to comply with your risk and capital management.
💬 Note: Stop losses behind the supply and demand zones are usually hunted by market makers. Be careful of stop hunts and do not enter a trade without getting confirmation and without having a proper trading setup.
Be successful and profitable.

Aave Keeps Rising —Makes Sense? Aave bottomed 7-April, and now it keeps rising after just two days red. Aave hitting bottom 7-April means the same with Bitcoin and the rest of the Altcoins which means Bitcoin and the rest of the Altcoins will continue growing as well, makes sense?
Aave peaked in December 2024 same with the rest of the Altcoins market, they are all doing the same. The fact that Aave is bullish now and keeps rising reveals what is to come next, makes sense?
As soon as there is a small retrace people wait for the crash to come, ignoring the fact that we are already in the 2025 bull market and bull market simply means sustained growth. Makes sense?
The Altcoins will continue to reveal what will happen with Bitcoin before it does, it is inevitable, many people in the industry are in the know. When you see Bitcoin stop and you wonder what will happen next, just look around, look at the Altcoins market and the answer will reveal itself, makes sense?
Very easy. Whenever the market drops, see how far down the Altcoins go. If Bitcoin is set to drop you will know it because the Altcoins will start moving down much stronger and much faster than Bitcoin. If Bitcoin finds resistance and is set to move ahead, no retrace, you will have the proof coming from the rest of the market. Some smaller pairs will move ahead.
Thank you for reading.
Namaste.

AAVEUSDT – The DeFi Season ?AAVE is showing early signs of accumulation. Buyers are present in blue box but the pressure from sellers remains quite strong.
Although I personally don’t see high-risk trades as ideal in these conditions, the potential reward here might justify a calculated attempt.
If the price can reclaim the blue box with confirmation, this could offer a strong opportunity. Still, always remember to act based on confirmations and manage your risk carefully.
These kinds of early signals can either be the start of something big or a trap for impatient entries.
📌I keep my charts clean and simple because I believe clarity leads to better decisions.
📌My approach is built on years of experience and a solid track record. I don’t claim to know it all but I’m confident in my ability to spot high-probability setups.
📌If you would like to learn how to use the heatmap, cumulative volume delta and volume footprint techniques that I use below to determine very accurate demand regions, you can send me a private message. I help anyone who wants it completely free of charge.
🔑I have a long list of my proven technique below:
🎯 ZENUSDT.P: Patience & Profitability | %230 Reaction from the Sniper Entry
🐶 DOGEUSDT.P: Next Move
🎨 RENDERUSDT.P: Opportunity of the Month
💎 ETHUSDT.P: Where to Retrace
🟢 BNBUSDT.P: Potential Surge
📊 BTC Dominance: Reaction Zone
🌊 WAVESUSDT.P: Demand Zone Potential
🟣 UNIUSDT.P: Long-Term Trade
🔵 XRPUSDT.P: Entry Zones
🔗 LINKUSDT.P: Follow The River
📈 BTCUSDT.P: Two Key Demand Zones
🟩 POLUSDT: Bullish Momentum
🌟 PENDLEUSDT.P: Where Opportunity Meets Precision
🔥 BTCUSDT.P: Liquidation of Highly Leveraged Longs
🌊 SOLUSDT.P: SOL's Dip - Your Opportunity
🐸 1000PEPEUSDT.P: Prime Bounce Zone Unlocked
🚀 ETHUSDT.P: Set to Explode - Don't Miss This Game Changer
🤖 IQUSDT: Smart Plan
⚡️ PONDUSDT: A Trade Not Taken Is Better Than a Losing One
💼 STMXUSDT: 2 Buying Areas
🐢 TURBOUSDT: Buy Zones and Buyer Presence
🌍 ICPUSDT.P: Massive Upside Potential | Check the Trade Update For Seeing Results
🟠 IDEXUSDT: Spot Buy Area | %26 Profit if You Trade with MSB
📌 USUALUSDT: Buyers Are Active + %70 Profit in Total
🌟 FORTHUSDT: Sniper Entry +%26 Reaction
🐳 QKCUSDT: Sniper Entry +%57 Reaction
📊 BTC.D: Retest of Key Area Highly Likely
📊 XNOUSDT %80 Reaction with a Simple Blue Box!
📊 BELUSDT Amazing %120 Reaction!
📊 Simple Red Box, Extraordinary Results
I stopped adding to the list because it's kinda tiring to add 5-10 charts in every move but you can check my profile and see that it goes on..

Aave Rising Trend Continues, $1054 Next Target —$2297 PossibleAave has been on a very strong rising trend since September 2023. This is a trading pair/Cryptocurrency project that is really strong when compared to other projects.
Many Altcoins hit major lows last month. Some even hit a new All-Time Low. The difference here is staggering, rather than new lows, AAVEUSDT keeps on advancing and producing higher lows and higher highs, a clear uptrend.
This uptrend is already good enough, a strong rise, but it is about to get better. Bullish momentum is set to go through the spiritual roof.
The last peak happened at $400. The next high sits at $535 but this isn't a major level, we expect much higher.
Resistance is likely to be found at the previous All-Time High, published May 2021 around $668. This is a level to watch for.
After some battling with this level, which Aave is sure to conquer, we will have additional growth.
A good looking target and strong price is $1,054. But this isn't likely to be the top for this pair, AAVEUSDT. Why?
Since it has been growing forever and is so strong, it means people are not ready to sell. If people are not ready to sell when things are bad, they won't be likely to sell when things are good and this creates pressure to reach the moon.
» Additional growth can happen with $1,675 being another strong target... It can go even higher.
$2,297 is possible.
Thank you for reading.
You can find additional information shown on the chart.
Namaste.

AAVE price analysisGlobally, the price of OKX:AAVEUSDT looks very good compared to most altcoins.
Therefore, as of now, looking at the chart, we can assume that any purchase of CRYPTOCAP:AAVE above $150 can turn into a good medium or long-term investment.
Target for growth in 2025 to $500-600
Although, there are dreamers who are waiting for CRYPTOCAP:AAVE at $3500, then the project's cap will exceed $50 billion - do you believe in such prospects?)
AAVE, aims for X10 this bull season. Massive loans demand ahead!Aave is an Open Source Protocol to create Non-Custodial Liquidity Markets to earn interest on supplying and borrowing assets with a variable interest rate.
The apparent market shift in trend this past few days in the whole market after the extended correction is a good season to seed on this very valuable COIN.
Demands in LOANS will skyrocket fueling funding frenzy on position takers on their crypto holdings as we enter BULL SEASON. And the focus will be on AAVE the largest liquidity pool provider.
Ideal seeding zone is at the current bargain range of (170) which started on the 130 bottom price area.
Get positioned now on this one while its still at early stage. An easy x10 would the long term target on this. Fundamental and Technical growth on this is inevitable.
Spotted at 170.
Mid target 500
Long term 1000.
TAYOR. Trade safely.

AAVE/USDTThe coin is showing a bullish structure both locally and on the higher timeframes. Once the November low is swept, we can look for longs with a target at 194

AAVEUSDT to head towards weekly resistance around 200The price has bounced from weekly support WS1 and currently trading above it. The next resistance is weekly resistance WR1 sitting around 165-195 zone. The price is headed towards this zone and in coming days or weeks it is going to hit this zone. However, there should be some pullback there. The next resistance zone beyond WR1 is weekly resistance WR2 sitting around 235-255. It is possible that after having some pullback at WR1, the price will eventually break WR1 and aim for WR2. However, WR2 is going to be strong supply zone and will push the price down again. I see still a possibility for the price to come down from WR2 to test weekly support zone WS2. But thats quite far yet, therefore, lets stick to the movement till WR2 and then we reevaluate the price action based on the reaction when the price hits WR2.

TradeCityPro | AAVE: Key Triggers in DeFi Lending Giant's Trend👋 Welcome to TradeCity Pro!
In this analysis, I want to review the AAVE coin for you. The AAVE project is one of the largest DeFi projects, operating in the lending sector, and holds the highest TVL among all projects in this category.
✔️ Currently, the coin of this project has managed to achieve a $2 billion market cap and with this market cap, it ranks 39th on CoinMarketCap.
📅 Daily Time Frame
In the daily time frame, as you can see, after a long-term uptrend that reached up to 383.59, the price entered a corrective phase and, following the break of the 278.56 zone along with a descending trendline, dropped to the 124.31 level.
💫 The 124.31 support is a very strong one, and the price has reacted well to it. The buying candle volume has increased after the price reached this zone, which indicates the strength of this support.
💥 If this support breaks, the price could begin its next bearish leg. The next support that AAVE has in this time frame is at 77.45, which could prevent further decline in case of a sharp bearish move.
📈 For a long position or spot buy, we first need to wait for the descending trendline to break, and for the price to form a higher low and high above this trendline to confirm a trend reversal.
🔼 Currently, the main bullish trigger is at the 194.97 level, and if this level breaks, the price could move back toward the 278.56 and 383.59 zones.
📉 For a futures position, the 148.17 level is a suitable trigger and can offer a risky long position. However, the spot buy and main position trigger is the 194.97 level. A break of the 50 level on RSI would bring bullish momentum into the market and can serve as a good confirmation for a long position.
🧩 For a short position, breaking the 124.31 level is a good trigger, and if this level breaks and RSI enters the oversold zone, the price could make a sharp bearish move.
📊 But more important than all is the market volume, which currently doesn’t have a clear trend. We’ll have to see whether, upon breaking 124.31 or 148.17, sufficient volume enters the market or not.
📝 Final Thoughts
This analysis reflects our opinions and is not financial advice.
Share your thoughts in the comments, and don’t forget to share this analysis with your friends! ❤️

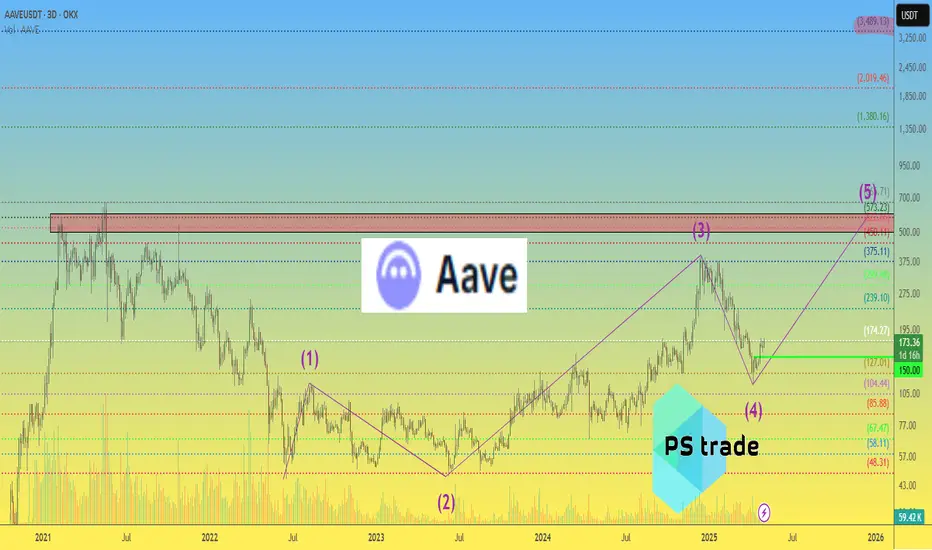
AAVEUSDT 3DAAVE ~ 3D Analysis
#AAVE Buy back from here with a short -term target of at least 15% from here.

Can #AAVE Bulls Sustain the Current Momentum? Key Levels Yello, Paradisers! #AAVE looks bullish on the surface—but is this setup quietly setting up for a brutal dump? Here's the key level that will trigger the next big move:
💎#AAVEUSD is currently trading around $143.66, holding inside a clear ascending channel on the 4H timeframe. The price action of #AAVE has been respecting both the ascending support and resistance trendlines, forming higher lows and higher highs—but momentum is fading.
💎A bearish divergence on the momentum oscillator is signaling early weakness despite the price climbing higher. This divergence usually marks the beginning of a bull trap, where the price appears strong just before a sharp reversal.
💎The immediate resistance to watch is in the $156. This is where price was recently rejected, near the upper channel trendline. Above that, $156 remains the key Bearish Setup Invalidation level. A breakout and hold above this would invalidate any bearish structure and could lead to a push toward $170+.
💎However, if AAVE breaks below the ascending support, currently near $140, it opens the door for a sharp drop. The first target is the $126.10 support zone, followed by the $114.35 level, which aligns with a strong historical demand area.
Play it safe, respect the structure, and let the market come to you. Discipline, patience, and strategy are what separate long-term winners from short-term gamblers
MyCryptoParadise
iFeel the success🌴

Important section: 155.69-180.14
Hello, traders.
If you "Follow", you can always get new information quickly.
Please click "Boost".
Have a nice day today.
-------------------------------------
(AAVEUSDT 1M chart)
The important support and resistance section is 155.69.
If it falls without support at 155.69, it is likely to fall to around 81.44.
If it rises with support at 155.69, it is expected to rise to around 332.71.
The 155.69 point is the HA-High indicator point on the 1M chart.
-
(1W chart)
If it falls from 155.69,
1st: 115.70
2nd: 64.26-81.44
We need to check for support near the 1st and 2nd above.
If it rises from 155.69,
1st: Fibonacci ratio 0.236 (202.92)
2nd: 302.67
We need to check for support near the 1st and 2nd above.
This shows that the area around 155.69 is an important support and resistance area.
-
(1D chart)
Therefore, the area we should be interested in is checking for support near 155.69-180.14.
Since the OBV indicator is renewing the low line, the key is whether it can rise above 155.69 this time.
Therefore, if possible, when it is confirmed to be supported near 180.14, it is the time to buy.
An aggressive buy is when it rises above 155.69 and receives support.
If it fails to rise above 155.69, if possible, it is recommended to not buy and watch the situation.
-
Thank you for reading to the end.
I hope you have a successful transaction.
--------------------------------------------------
- This is an explanation of the big picture.
I used TradingView's INDEX chart to check the entire range of BTC.
I rewrote it to update the previous chart while touching the Fibonacci ratio range of 1.902 (101875.70) ~ 2 (106275.10).
(Previous BTCUSD 12M chart)
Looking at the big picture, it seems to have been following a pattern since 2015.
In other words, it is a pattern that maintains a 3-year bull market and faces a 1-year bear market.
Accordingly, the bull market is expected to continue until 2025.
-
(Current BTCUSD 12M chart)
Based on the currently written Fibonacci ratio, it is displayed up to 3.618 (178910.15).
It is expected that it will not fall again below the Fibonacci ratio of 0.618 (44234.54).
(BTCUSDT 12M chart)
I think it is around 42283.58 when looking at the BTCUSDT chart.
-
I will explain it again with the BTCUSD chart.
The Fibonacci ratio ranges marked in the light green boxes, 1.902 (101875.70) ~ 2 (106275.10) and 3 (151166.97) ~ 3.14 (157451.83), are expected to be important support and resistance ranges.
In other words, it seems likely to act as a volume profile range.
Therefore, in order to break through this section upward, I think the point to watch is whether it can rise with support near the Fibonacci ratios of 1.618 (89126.41) and 2.618 (134018.28).
Therefore, the maximum rising section in 2025 is expected to be the 3 (151166.97) ~ 3.14 (157451.83) section.
To do that, we need to look at whether it can rise with support near 2.618 (134018.28).
If it falls after the bull market in 2025, we don't know how far it will fall, but considering the previous decline, we expect it to fall by about -60% to -70%.
So, if the decline starts near the Fibonacci ratio 3.14 (157451.83), it seems likely that it will fall to around Fibonacci 0.618 (44234.54).
I will explain more details when the downtrend starts.
------------------------------------------------------

AAVEUSDT 3DAAVE ~ 3D Analysis
#AAVE Buy from this after successfully testing this support with a short -term target of at least 10%+.

AAVE Trying To Bottom 🚨AAVE is looking beautiful 🚨, very interesting chart for more upside
and is now into support and trying to bottom
Do not miss out on AAVE as this is a great opportunity
Watch video for more details

AAVE Longterm pickNot going to dive too deep, but I genuinely believe DEFI is set to explode in the future! AAVE is definitely one of my favorites, along with UNI and a couple of others that are on my radar. Anyway,
Looking at the long-term Fibonacci targets, they suggest (850-1300-1750) will happen eventually. I’m not sure how long it will take, but I’m all about keeping my eyes on the prize!
What are your thoughts? Let’s get a discussion going! Don’t forget to like and share! 🚀💥

Aave Update: All-In, Think Long-TermOur last entry for AAVEUSDT was in November 2024 around the 150$ price range. This zone is about to be activated again. It is not fully certain but if it is indeed activated, clearly shown on the chart, there is an opportunity to go All-In, with a high probability of success.
Aave grew nicely, strongly and hit a top of $400. Going back to $150 is a huge correction that amounts to 62%. The actual correction is already really strong, the low at $167 totaled -58%.
Don't look much further down. Do not pin your hopes on forever down, lower lows. The truth is that a strong rise is balanced out by a correction, but a correction is a correction and nothing more. It tends to end in a higher low.
In this chart, I am showing you the long-term buy and support zone. This is the price at which one should go LONG.
First, start with a small amount of lev. As we get closer to the breakout, go All-In. We are getting closer by the day.
We might have only a few days before the next bullish breakout shows up. While there will still be some sideways and consolidation before the rise, once the bottom is gone, it is gone.
It is time to enter the Cryptocurrency market.
The best time to buy is when prices are low.
When in doubt, trade spot. With spot trading you can never go wrong. All you need to do is to buy and hold. In the worst scenario, think long-term.
If you develop a bias towards a waiting time of 1 year or more on every position you take, you will be a winner in this bull-market.
Thank you for reading.
Namaste.

aaveIf it wants to hold on in the short term, it should not miss this green box. If it misses and the blue line also misses, it should be checked in the area 91 to 131.

AAVEUSDT 1DAAVE ~ 1D Analysis
#AAVE Buy after successfully penetrating this resistant line with a short -term target of at least 15%+.
