Aave Protocol (AAVE) Buy ZoneAave Protocol (AAVE) Buy Zone
--------------------
BIAS
Mid-Term : Bullish
Risk : High
Aave Protocol has once again been rejected from $140 mid-term resistance zone. This could be the refueling it needed before a move up.
--------------------
$AAVE/USDT LONG SETUP
Leverage : x3 - x5
Entry Price : 141 - 138
TP 1 : 144.4
TP 2 : 148.8
TP 3 : 158.5
TP 4 : 164.3
TP 5 : 169.7
TP 6 : 174.3
TP 7 : 182.2
TP 8 : 187.5
Stop Loss : 134.9
*Maximum 3% of Portfolio.
*Unload 12.5% at each TP. Whenever TP 2 hits, Move stop loss to entry.
--------------------
Aaveusdt

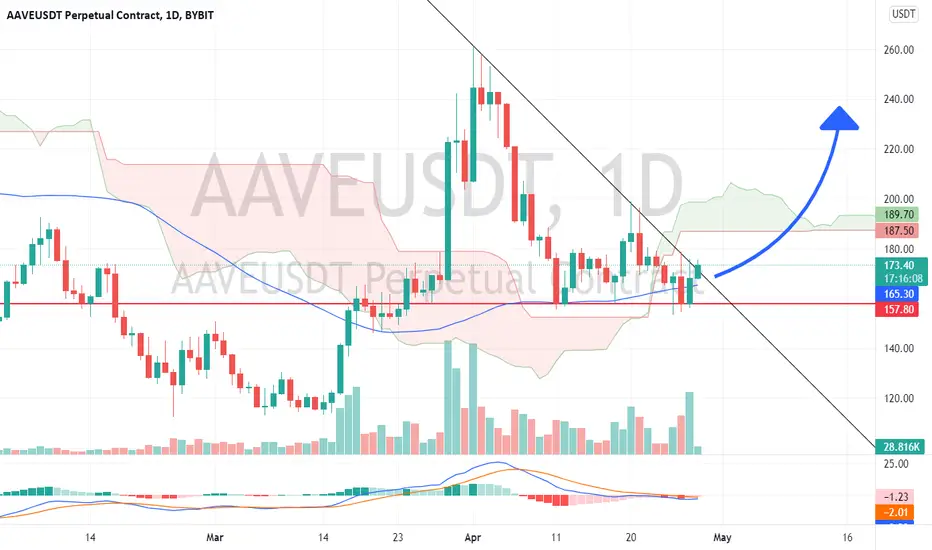
AAVE/USDT : Reached the S/R zone and trendline!BINANCE:AAVEUSDT
Hello everyone 😃
Before we start to discuss, I'll be so glad if you share your opinion on this post's comment section and hit the like button if you enjoyed it!
$AAVE has reached the trendline's resistance now and also there's a formed S/R zone.
So basically it's a bearish sign and we have to expect the rejection...
But there are not enough levels to set our Short position here!
The Short position should be located below $148.5!
After all; There can be a chance of a breakout above the mentioned trendline and S/R zone.
If we get the closings above the S/R zone and trendline, Then we locate our Long towards $190.5!
Trading setup :
🔻 Entry Pointes : $155 - $157.5 - $160
📍Targets : $164 - $169 - $174.5 - $181 - $190.5
🟥 Overall stop-loss : $148.5 ( Three Candles Close )
⚠️ It's not activated yet, Needs to wait for a proper breakout!
Hope you enjoyed the content I created, You can support us with your likes and comments!
Attention: this isn't financial advice we are just trying to help people with their vision.
Have a good day!
@Helical_Trades

AAVE is going to reach 350$AAVE has Formed an Inverse Head and Shoulder Pattern. This means the Price is gonna Increase! This pattern is a Bullish Pattern and we can Be Sure of Good Bullish Stuff! The Right Shoulder Has not been Fully Created! When It's Completed and Reached the Neckline, we can Expect a Bullish Movement Up to 350$. There is also a Regular Bullish Divergence (+RD) On MACD which means the Bullish Chance Is Pretty High! You can Enter AAVE right now But It's a Bit Risky. If you wait Until It Reaches The Neckline, It is Perfectly Safe For Entering.
_ _ _ _ _ _ _ _ _ _ _ _ _ _ _ _ _ _ _ _ _ _ _ _ _ _ _ _ _ _ _ _ _
Thank you for seeing idea .
Have a nice day and Good luck

$AAVE 140 Support Zone$AAVE recently testing that 140 support over the past few days, seeing sellers near close here, and will need buyers hard tonight/tomorrow if it wants to hold.
RSI already broke the support, but I don't treat diagonals with much validity.
Either way, with the overall market trend, it doesn't look hot. 112 is the next very clear support, could see some action in the 125 area.

AAVE/USDTFor the people that are risk addicts. Trading on price range is more safe than the position. Do NOT obstinate with stops.

AAVEUSDTif 140 area holds we might see a relief rally to 200~area
falling wedge setup
price around the lower trendline now
stops below the support bit of room incase of wicks
but decent entry around here

AAVE tradesame as always, just going off the liq levels. theres about one at 154ish but i placed SL below, there are a couple bubbles that need bursting at the 170s-180s marks
Happy Trading Fellas!

AAVE W PATTERN IS LOADINGI have became bullish on AAVE after Elon musk appoints AAVE's founder as Twitter Interim CEO.
The H&S might be valid after a break below it's neckline and this W pattern will be invalid as price will go down hard.
Anyway; keep watching $BTC for a confirmation.

AAVE is in a Bearish Pattern But can It Become Bullish?AAVE is in a Descending Triangle. this means the price is going to Decrease (Probably) But a Thing That Must be Noted is that There is a Regular Bullish Divergence (+RD) Visible On MACD Which means the Price Can Increase.a Break out Is about to Accrue too.So there IS a Chance For Price to Increase Back to the Top Of The Triangle.
_ _ _ _ _ _ _ _ _ _ _ _ _ _ _ _ _ _ _ _ _ _ _ _ _ _ _ _ _ _ _ _ _
Thank you for seeing idea .
Have a nice day and Good luck

AAVE LONG SIGNALNice to meet you, everyone
I'm an alt trader
I'm analyzing and recommending things that are similar to my personality among many alt coins
It shows that the downward wedge has been broken.
Expect to be retested and highly likely to go up
AAVE/USDT easy 30% profit in May/2022AAVE/USDT:
1/ Bullish Divergence happening on MACD histogram (1D)
2/ Bullish Divergence happening on Stoch RSI (1D)
3/ Price retest trendline after breakup descending falling wedge 1D and 4H
=> Target take profit about 238 USD at the resistance trendline.

$AAVE Play the Range $AAVE ranging here for the last couple weeks, apart from the attempted breakout.
RSI at resistance trendline as well, not a bad short oppurtunity.

AAVE/USDTSafe entry is after completed head and shoulders pattern. For the risk lovers, there is a sample position on chart.

Aave | AAVE bullish MA50 test - now up again?AAVE recently tested the MA50 twice.
I like the overall scenario and will enter a trade once it closes above $180.6, which triggers a new high on the H1 chart.
Let's see how this plays out.
Thanks for your support.
Have a good one.

AAVE protocol is moving up!Currently waiting for AAVE to hit above ₮175 to make a decision.
We'll see if we get a moon-shot, or a somewhat slower rise after some resistance...
♠️🤫🐿

AAVE breakout from falling wedge ? If we look at the chart, i think we can see a breakout chance from the massive falling wedge of AAVE`s chart.
My price target is $309.
Looking forward to read your opinion about it.

AAVE vs Tether Breakout Point... Can Be Anything...Here we have AAVEUSDT on a very tricky spot.
It just came out of a descending channel and is trading above EMA21/EMA10 with a strong RSI... But there is no volume...
I just shared a chart for TOTAL and BTCUSD with some early bullish signals developing...
If the bulls follow up, we can also see AAVEUSDT/AAVEBTC grow.
But if there is no follow up, this pair and all others are likely to move lower rather than up.
Here we also have prices trading above the 0.618 Fib. retracement level for the last bullish wave.
But there is no way to predict what will happen next.
Trading is very easy though...
We buy with a very tight stop-loss...
LOW RISK, WITH HIGH POTENTIAL FOR REWARDS.
This is not financial advice.
Namaste.

AAVE Price Targets and Stop LossAAVE/USDT
Entry Range: $164 - 184
Price Target 1: $199
Price Target 2: $230
Price Target 3: $264
Stop Loss: $151


$AAVE oversold and ready to fly?!Hey, many alts are currently super oversold and forming a bottom on lower TF - Im scalping $AAVE here - please respect the SL.

GO LONG ON AAVEAAVE has been consolidating in a parallel channel since a long time and looks like its going to break the channel this time. Go long on AAVE if breaks out the channel and gives a strong bullish candle close. RSI and MACD already breakout done.
#HODL

AAVEUSDT H16: BEST Level to BUY/HOLD 100%(SL/TP)(NEW)Why get subbed to me on Tradingview?
-TOP author on TradingView
-2000+ ideas published
-15+ years experience in markets
-Professional chart break downs
-Supply/Demand Zones
-TD9 counts / combo review
-Key S/R levels
-No junk on my charts
-Frequent updates
-Covering FX/crypto/US stocks
-before/after analysis
-24/7 uptime so constant updates
🎁Please hit the like button and
🎁Leave a comment to support our team!
AAVEUSDT H16: BEST Level to BUY/HOLD 100%(SL/TP)(NEW)
IMPORTANT NOTE: speculative setup. do your own
due dill. use STOP LOSS. don't overleverage.
🔸 Summary and potential trade setup
::: AAVEUSDT 16hours//candle chart review
::: strong bullish chart overall
::: trading inside range / accumulation process
::: rejection likely from mid range / pullback
::: BUY low from 190 USD later TP 410 USD
::: recommend to focus on buying range LOWS
::: I don't think that we are ready to MOON yet
::: accumulation in progress / more time required
::: best trades near range lows for BULLS
::: it's a strong prior bull market so can
::: however KEEP A TIGHT STOP LOSS
::: BULLS get ready to BUY after pullback
::: TP bulls is 100% gains BUY/HOLD SETUP
::: AAVE will re-test range highs near 410 USD
::: patience required next few weeks
::: BEST reload BULLS is 190/200 USD
::: as we are getting ready for a move now
::: final TP BULLS is 410 USD
::: good luck traders!
🔸 Supply/Demand Zones
::: N/A
::: N/A
🔸 Other noteworthy technicals/fundies
::: TD9 /Combo update: N/A
::: Sentiment mid-term: BULLS/BUY PULLBACK
::: Sentiment short-term: BEARS/PULLBACK ONLY
RISK DISCLAIMER:
Trading Crypto, Futures , Forex, CFDs and Stocks involves a risk of loss.
Please consider carefully if such trading is appropriate for you.
Past performance is not indicative of future results.
Always limit your leverage and use tight stop loss.

AAVE For Bullish - After Support RetestExpecting Bearish Movements To $206 - $205 before Bullish Continuation For AAVE After Retest 4H Support Zone Then To See Bullish Structure And Then Buy, Not Taking Any Trades At This Time Around
