AAVE/USDT probability of bullish continuation from demand? 👀🚀💎 Paradisers, brace yourselves for a captivating chapter in the #AAVEUSDT saga, with signs pointing to a bullish breakout from its current stronghold.
💎 After facing resistance in a tough supply zone, #AAVE has intriguingly navigated through buyer territory. This maneuver hints at a potential dip before embarking on a bullish trajectory from the key demand level of $106.06. A surge of bullish energy here could propel EURONEXT:AAVE towards a significant challenge against the looming supply zone overhead.
💎 In the ever-shifting crypto arena, flexibility in strategy becomes paramount. If #AAVE stumbles at this critical juncture, adapting swiftly could be our ace in the hole.
💎 Enter Plan B: eyeing a bullish charge from a deeper demand level at $98.56. This becomes our vigil point, where a breach might signal an early transition to bearish trends for #AAVE. 🌴💰
Aaveusdt

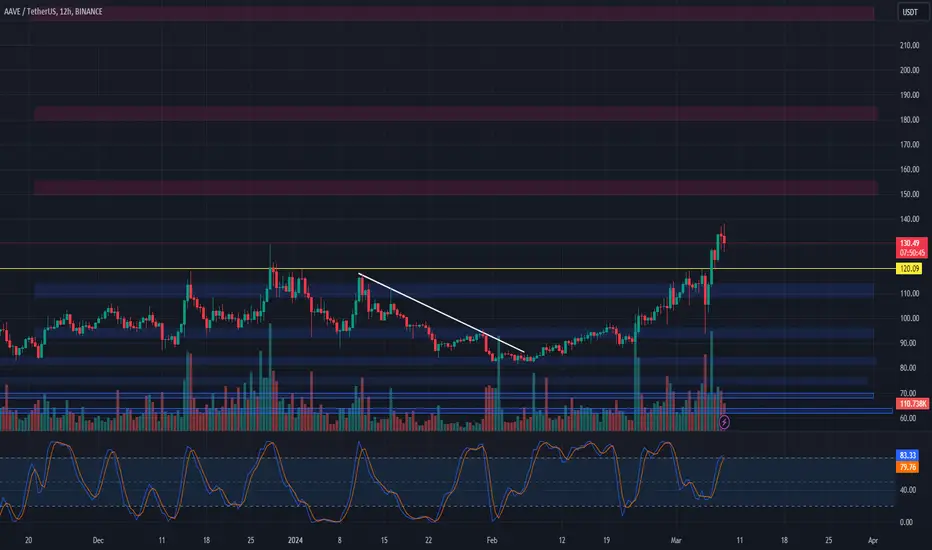
AAVE - Bulls Chart 🐂AAVE recently broke the descending triangle that had been supporting the price since June 2022.
I will wait for a more significant price correction (retest), as the price is overbought and showing negative RSI divergence on the daily timeframe.

AAVEUSDT is bullish targetting 243-262 zoneThe price has been moving up after consolidating between two monthly zones currently marked as MS1 and MS2. This is a very nice pattern to identify for the bullish move and it was there in this case. Very beautifully the price osciallated between these two zones for a long time before moving beyong the MS1 zone. Everytime the price was pushed down from MS1 zone, it found support on MS2 zone and had a bounce. After going beyond the MS1 zone, it was rejected by the weekly resistance WR1 zone but monthly support zone MS1 provided the needed support and the price bounced from there. This was another opportunity to go long as this was breakout retest. Now on this bounce from MS1 zone, the price has managed to move beyond that WR1 zone and currently trading above it. This opens the way for the price to target the next resistance which is monthly resistance MR1 and that zone lies around 243-262. I think the price is likely to hit that zone in coming weeks. We will have a look how it behaves at that resistance but there would be a considerable pullback at that level. So if long, booking profit at that level would be a good idea.

AAVE/USDT Breakout the Key resistance area, Continue Upward!💎 AAVE has recently shown significant market dynamics by successfully breaking out of a key resistance area. This breakout suggests a bullish momentum, with the probability for further upward movement and a move towards our target area.
💎 However, it's crucial to monitor how AAVE behaves during its retest of the previous resistance, which is now acting as support.
💎 A bounce from this support area would confirm the validity of the breakout. Conversely, if AAVE fails to hold above this support level and breaks down below it, the breakout may be considered false.
💎 In the event of a breakdown below the support area, the price could retreat towards the demand area around $8, or even lower. This would indicate a reversal of the bullish momentum and a resumption of downward movement.

🚀 AAVE Range Reclamation Setup! 📈💹📊 Analysis:
Reclaiming Previous Range: AAVE is showing signs of reclaiming its previous range, signaling potential upward movement.
Buy Zone: Look for a retest of resistance turned support in the Buy Zone between $115 and $125.
Higher Low Setup: Establishing a higher low can indicate trend continuation to the upside.
Take Profit Strategy: Consider taking profits at the next resistance areas around $150 or $220.
Stop Loss: Set a stop loss under the $104 level for risk management.
🌐 Note: Stay informed about broader market conditions and any news/events that may affect AAVE.

AAVE Price Analysis: Bullish Breakout Potential
AAVE is currently trading within a weekly accumulation range. A breakout and daily candle close above $115.6 could signal a bullish continuation, with the first target at $243, which is the first major resistance level. The weekly support level is at $83, and a break below this level could indicate a continuation of the downtrend.
Key Technical Indicators:
Moving Averages: The 50-day MA is above the 100-day MA, indicating a bullish trend.
Relative Strength Index (RSI): The RSI is above 50, indicating that AAVE is not overbought.
Stochastic Oscillator: The Stochastic Oscillator is above 80, indicating that AAVE is overbought and could be due for a pullback.
Trading Strategy:
Bullish Scenario: If AAVE breaks out and closes above $115.6, traders could look to enter a long position with a target of $243.
Bearish Scenario: If AAVE breaks below $83, traders could look to enter a short position with a target of $60.
Overall, AAVE is in a bullish trend and could continue to rise if it breaks out above $115.6. However, traders should be aware of the potential for a pullback if the RSI and Stochastic Oscillator readings indicate overbought conditions.
This is not financial advice. Always do your own research before making any trading decisions.

DeFi Categories (PUMP) AAVE 102.70 >>> $239.00Everyone has already noticed the sharp rise in Uniswap (UNI/USDT), with all DeFi projects starting to grow actively. You already know the forecast for Compound; I've decided to include AAVE in the portfolio for the pump as well. The targets on Coinbase are promising.
Uniswap Foundation has published a proposal to reward some UNI holders. According to Coinmarketcap, the native token surged by 74%.
Entry Price: $102.70
Take Profit 1: $205.40 (50%)
Take Profit 2: $289.00 (16.6%)
Take Profit 2: $589.00 (16.6%)
Take Profit 2: $889.00 (16.6%)
So, when the price doubles, take out your initial investment; I've indicated the other targets. Secure profits evenly :).
Chain Knights Premium ✅️
The best way to show gratitude is by registering through the links below. In return, you'll gain access to the Premium group where I'll share more confidential information, plus there will be prize draws among my clients who registered through my referral link on the crypto exchange provided below.

AAVE: Falling Wedge BreakoutTrade setup : Bullish breakout from a Falling Wedge pattern was confirmed by a break above the prior swing high of $95 (also resistance). This could signal a bullish trend reversal with +20% upside potential to $120. Stop Loss (SL) at $87, just below the prior swing low.
Patterns : Falling Wedge Usually results in a bullish breakout. When price breaks the upper trend line the price is expected to trend higher. Emerging patterns (before a breakout occurs) can be traded by swing traders between the convergence lines; however, most traders should wait for a completed pattern with a breakout and then place a BUY order.
Trend : Uptrend on Short- and Medium-Term basis and Neutral on Long-Term basis.
Momentum is Bullish (MACD Line is above MACD Signal Line and RSI is above 55).
Support and Resistance : Nearest Support Zone is $80. The nearest Resistance Zone is $95, which it broke, then $120, and $130.

AAVEUSDT Elliott Waves (Local Setup)Hello friends.
Please support my work by clicking the LIKE button👍(If you liked). Also i will appreciate for ur activity. Thank you!
Everything on the chart.
Entry: Market and lower
Targets: 96 - 102 and maybe 109
after first target reached move ur stop in breakeven
Stop: ~79 (depending of ur risk).
RR: 1 to 3
ALWAYS follow ur RM.
risk is justified
Good luck everyone!
Follow me on TRADINGView, if you don't want to miss my next analysis or signals.
It's not financial advice.
Dont Forget, always make your own research before to trade my ideas!
Open to any questions and suggestions


AAVE: Falling Wedge BreakoutTrade setup : Bullish breakout from a Falling Wedge pattern needs to be confirmed by a break above the prior swing high of $95 (also resistance). If it does, price could signal a bullish trend reversal with +20% upside potential to $120 thereafter.
Patterns : Falling Wedge Usually results in a bullish breakout. When price breaks the upper trend line the price is expected to trend higher. Emerging patterns (before a breakout occurs) can be traded by swing traders between the convergence lines; however, most traders should wait for a completed pattern with a breakout and then place a BUY order.
Trend : Uptrend on Short-Term basis, Downtrend on Medium-Term basis and Neutral on Long-Term basis.
Momentum is Mixed as MACD Line is above MACD Signal Line (Bullish) but RSI ~ 50 (Neutral).
Support and Resistance : Nearest Support Zone is $80. The nearest Resistance Zone is $95 (previous support), then $120, and $130.

AAVEUSD 4H Chart Shows Falling Wedge: Prime Buying Opportunity"While the AAVEUSD 4-hour chart is presenting a falling wedge pattern, signaling a potentially lucrative buying opportunity, it's crucial for investors to conduct their own research. This pattern typically suggests that the market could be gearing up for a bullish reversal, offering an attractive entry point for those looking to capitalize on AAVE's potential upward movement. However, the importance of personal due diligence cannot be overstated. Every investor should examine the broader market context, AAVE's fundamental strengths, and consider their own risk tolerance before making investment decisions. This approach ensures that one's investment strategy is not only informed by technical analysis but also aligned with individual financial goals and market perspectives."

⚡️AAVEUSDT CMC TRADING ⚡️ FALLING WEDGEAAVEUSDT has experienced a notable bullish breakout, forming a falling wedge pattern under the 4-hour timeframe. This breakout was accompanied by the significant breach of a long-standing trend line, reinforcing the bullish sentiment. Additionally, within lower timeframes, an inverted head and shoulders pattern has emerged, further bolstering the case for a bullish outlook on this pair.

AAVE to 60 USDAnalyzing the Potential Downturn of AAVE: A Descending Path from $92 to $60
As we scrutinize the dynamics surrounding the cryptocurrency Aave (AAVE), an in-depth analysis points towards a potential downturn, with the coin's value possibly declining from $92 to $60. Several key factors contribute to this forecast, including a breach below the established trendline, the likelihood of breaking through the MACD trend, and an emerging negative trajectory in the MACD indicator.
The first ominous sign is the breach below the long-standing trendline that has historically guided AAVE's price movement. The deviation from this trendline indicates a potential shift in market sentiment, suggesting a weakening of the previously dominant bullish trend. Market participants are advised to closely monitor this breach, as it often serves as an early signal for a broader correction.
The Moving Average Convergence Divergence (MACD) indicator, a widely followed momentum oscillator, further substantiates the potential downturn. The MACD trend is on the verge of breaking into negative territory, indicating a diminishing bullish momentum. This impending shift is a cause for concern, as it may trigger a reevaluation of positions among market participants, potentially leading to a cascade of sell-offs.
Moreover, the convergence of these factors points towards the likelihood of AAVE's value declining to the $60 mark. Traders and investors should exercise caution and consider implementing risk management strategies in anticipation of this potential downturn. It is crucial to remain vigilant in monitoring price developments, as sudden market shifts can occur, altering the trajectory of any cryptocurrency.
In conclusion, the analysis of Aave's current market dynamics suggests a plausible scenario wherein the coin's value may decline from $92 to $60. Traders are strongly urged to conduct thorough research, exercise caution, and adapt their strategies in response to evolving market conditions.

AAVE/USDT Bracing for a Bullish Swing Amid Downward Pressure? 💎 Paradisers, get set for an engaging trading setup with #AAVEUSDT. Despite a current dip, there's a bright spot on the horizon for a bullish pivot from the demand zone.
💎 Tracking #AAVE's recent slide, we've clocked a hefty 36% tumble from its zenith. However, as it approaches a key demand zone at $74.64, there's a stirring chance for a spirited bullish rally if it can cling to this momentum, aiming to breach a hefty supply zone above.
💎 The plot thickens if the price slides under $81.58. Gear up for a potential 9.20% gain before #AAVE reaches our targeted demand zone. Keep a sharp eye out; a descent past $74.64 would be our cue for a tactical shift in approach.

AAVEUSDTHi guys
In my opinion, this compression movement can be broken upwards, considering the positive divergence of the RSI in the four-hour timeframe and maintaining the support zone.
But the approval has not yet been issued. If the $88.75 resistance area is fully consumed, the above scenario will be strengthened.
What do you think?

⚖️💹 AAVE Trading Strategy 🌐📊📊 Current Market Status:
AAVE at support at $81.50 - $84.
📈 Chart Analysis:
Identified support zone.
🔄 Longing Strategy:
30% Allocation: Take a spot long position with 30% of intended funds at $81.50 - $84 support.
30% at Breakout: Allocate another 30% once the price breaks through the resistance line.
Remaining 40% on Retest: Deploy the remaining 40% on a retest of the break of the resistance line.
⚖️ Risk Management:
Stop Loss: Just below $80.00.
Take Profit 1: Between $92.00 - $96.00.
Take Profit 2: Between $108.00 - $114.00.
📣 Conclusion:
Tightly managed risk in a volatile market.
Gradual fund allocation based on key chart patterns.
Trade wisely! 📈💡 #AAVE #TradingStrategy #CryptoMarket 🌐📊

AAVE: Falling WedgeTrade setup : Consolidating in a Falling Wedge pattern. Trend Traders: wait for a breakout, which could signal a potential bullish trend reversal. Swing Traders: Pullback near $80 support could be a swing trade entry with +15% upside potential back to $90 near-term. That $80 horizontal support level also lines up with a 200-day moving average, making it a robust support zone. Stop Loss (SL) at $75 (just below support zone).
Patterns : Falling Wedge Usually results in a bullish breakout. When price breaks the upper trend line the price is expected to trend higher. Emerging patterns (before a breakout occurs) can be traded by swing traders between the convergence lines; however, most traders should wait for a completed pattern with a breakout and then place a BUY order.
Trend : Downtrend on Short- and Medium-Term basis and Uptrend on Long-Term basis.
Momentum is Bearish (MACD Line is below MACD Signal Line, and RSI is below 45).
Support and Resistance : Nearest Support Zone is $80. The nearest Resistance Zone is $95 (previous support), then $115, and $125.

AAVE breaking out on H4 waiting for pumpEURONEXT:AAVE Long / Spot (Swing)
Entry: $89.6 - $85.5
TP1: $95.28
TP2: $118.03
SL: H4 close below $84.25
Take 25% entry at around 89.6 and remaining it parts around $86, use the entry area/green bo to average your entry, try to bring your entry closer to $87. It can take a week to play out so keep that in mind.

AAVE/USDT Keep an eye on the support area!! Potential Bounce💎 AAVE has experienced significant developments in the market.
💎 Currently, AAVE is breaking down the support trendline, signaling the potential for a downward movement that could lead it back to retest the support area around 76.
💎 The current position of AAVE suggests that it may undergo a brief upward movement, reaching the 96-98 area for a retest before continuing its downward trajectory toward the support.
💎 However, if AAVE arrives at the support area and fails to show a strong response, possibly consolidating with weak volume, this is a concerning sign. It suggests the potential loss of support, which could confirm a bearish trend. The next target for the downward movement could be the demand area.
💎 At the demand area, a bounce and a reclaiming of price above the resistance area would be required to reverse the trend. If this scenario fails, AAVE may experience a temporary upward movement before continuing its descent. Breaking through the demand area would result in further downward movement.

AAVE: Falling WedgeTrade setup : Consolidating in a Falling Wedge pattern. Trend Traders: wait for a breakout, ideally above $100 key level, which could signal a resumption of uptrend with +21% upside potential to $115. Swing Traders: Pullback near $80 support could be a swing trade entry with +18% upside potential back to $95 near-term. That $80 horizontal support level also lines up with a 200-day moving average, making it a robust support zone. Stop Loss (SL) at $75 (just below support zone).
Patterns : Falling Wedge Usually results in a bullish breakout. When price breaks the upper trend line the price is expected to trend higher. Emerging patterns (before a breakout occurs) can be traded by swing traders between the convergence lines; however, most traders should wait for a completed pattern with a breakout and then place a BUY order.
Trend : Downtrend on Short-Term basis, Neutral on Medium-Term basis and Uptrend on Long-Term basis.
Momentum is Bearish (MACD Line is below MACD Signal Line, and RSI is below 45).
Support and Resistance : Nearest Support Zone is $95, which it broke, then $80. The nearest Resistance Zone is $115, then $125.

AAVE: Pullback in UptrendTrade setup : Price is in an Uptrend. It briefly broke above $115 and $125 resistance, making a Higher High (sign of Uptrend) but got overbought (RSI > 70) and pulled back. Pullback near $95-100 support zone could be a swing trade entry in Uptrend with upside potential back to $115 near-term and $125 medium-term. Stop Loss (SL) at $87 (just below prior swing low and below the nearest support level).
Trend : Uptrend across all time horizons (Short- Medium- and Long-Term).
Momentum is Mixed as MACD Line is below MACD Signal Line (Bearish) but RSI ~ 50 (Neutral). MACD Histogram bars are rising, which suggests that momentum could be nearing another upswing.
Support and Resistance : Nearest Support Zone is $95, then $80. The nearest Resistance Zone is $115, then $125.
