EURUSD → Bullish daily structure. Correction before growthFX:EURUSD , after significant growth and a break of structure, has entered a local correction, the target of which may be a phase of accumulation of potential for updating intermediate highs (1.183).
The daily market model is bullish. A break of the structure has formed on D1, and the market is entering a correction phase, during which it may be interested in testing 0.5 or the 0.7 Fibonacci area before continuing its growth. I would also like to draw attention to the previously broken resistance level of 1.164 - 1.163, which, within the current correction, may act as a support level for buyers...
In addition, the market has not yet reached the liquidity level it was heading for during the correction for a possible continuation of growth. Zone of interest: 1.168, 1.164, 1.159
Resistance levels: 1.1728, 1.1766
Support levels: 1.168, 1.164, 1.159
A false breakdown of the specified support zone could change the market imbalance and attract buyer interest, which could generally support the bullish trend.
Best regards, R. Linda!
AB-CD

GOLD → Correction for confirmation before growthFX:XAUUSD is recovering due to increased demand as a safe-haven asset. After breaking through local trend resistance, an upward channel is beginning to form on the chart.
On Monday, gold tested the 3295-3300 zone (liquidity zone) and, against the backdrop of incoming economic data, is buying back the decline, forming a rather interesting pattern that could lead to continued growth, but there is a but!
Investors are reacting to President Trump's threats to impose tariffs on imports from a dozen countries starting August 1. In addition, the main question is the Fed's interest rate decision. The regulator is likely to leave the rate unchanged due to inflation risks.
Uncertainty surrounding tariffs is supporting interest in gold as a safe-haven asset. The market is awaiting further news and the publication of the Fed minutes on Wednesday.
Resistance levels: 3345, 3357, 3396
Support levels: 3320, 3311, 3295
A correction to support is forming. If the bulls hold their ground within the upward channel and above the key areas of interest, the focus will shift to 3345, a resistance level that could hold the market back from a possible rise. A breakout of this zone would trigger a rise to 3357-3396.
Best regards, R. Linda!

GOLD → Buyers are hesitant due to new tariffsFX:XAUUSD continues its correction phase after updating local highs and breaking through trend resistance. The dollar is making traders nervous...
After rising 2% last week, gold started Monday with a decline to $3,300 amid a stronger dollar due to the risk of new tariffs from Trump, who sent letters to 12 countries threatening to impose duties of up to 70% if no agreements are reached by July 9. This boosted demand for the dollar as a safe-haven asset.
Gold is also under pressure from strong US employment data, which has dampened expectations of a rate cut. The market is focused on news on tariffs and the publication of the Fed minutes on Wednesday, which may clarify the outlook for monetary policy.
Technically, the correction may end in the 0.7 Fibonacci zone, in the range of 3295-3300. After the formation of a reversal pattern, the market may strengthen to 3350-3360.
Resistance levels: 3315, 3344, 3358
Support levels: 3300, 3295
Locally, the price is trying to consolidate below the range, which could lead to a decline to 3300-3295. If, during the correction from support, the market manages to consolidate above 3315, we can expect growth. Otherwise, a weak reaction at 3295 could lead to a retest of 3275 and consolidation in the selling zone, which could lead to a further decline to 3245 .
BUT! We are closely monitoring the position of the US and Trump on tariffs, as he is once again issuing ultimatums to countries, to which the markets are reacting...
Best regards, R. Linda!

GBPUSD → Correction before the bullish trend continuesFX:GBPUSD is forming a trading range for consolidation of potential ahead of a possible continuation of growth as part of a countertrend correction.
The dollar is trying to recover from its decline due to a local change in the fundamental background, but the global trend for the DXY is bearish. This could provide support for the GBP to continue growing, provided that the bulls hold their defense above the 0.5 Fibonacci zone of the main impulse movement.
The market is holding GBPUSD within the trading range of 1.359 - 1.3675. The trend is bullish, and within the correction, liquidity may be captured from 1.359 before further growth.
Resistance levels: 1.3675, 1.3764
Support levels: 1.359, 1.3511
If the reaction to the subsequent retest of support at 1.359 is weak, we can consider a continuation of the correction to the 0.7-0.79 Fibonacci zone, which would be the most favorable entry point for us (focus on 1.3511 — a false breakout will increase interest in buying). In the current situation, the focus is on 1.359.
Best regards, R. Linda!

SOLANA → Pre-breakdown consolidation may lead to distributionBINANCE:SOLUSDT is declining and testing the support of the trading range as Bitcoin pauses after strong growth and enters a correction phase...
SOL looks a bit weaker than Bitcoin technically, but SOLANA has some positive fundamentals, though that might not be enough.
After forming a false breakout of key daily resistance, Bitcoin is moving into a correction phase. An update of local lows on the chart could trigger a drop across the entire cryptocurrency market.
In SOL, the focus is on the two nearest levels of 148.75 and 145.64. A breakdown of support could trigger the distribution of accumulated energy within the specified range as part of a downward momentum.
Resistance levels: 148.75, 151.2, 153.88
Support levels: 145.64, 138.59
The ideal scenario would be a false breakout of 148.75 (liquidity capture) and a retest of 145.64, followed by a break of support. Consolidation below 145.65 could trigger a drop to the zone of interest at 138.59.
Best regards, R. Linda!

GOLD → Consolidation after a trend break...FX:XAUUSD , after breaking out of a downtrend, is consolidating, which may continue for some time due to Thursday's news and low liquidity on Friday.
Gold stabilized after a correction, but volatility risks remain. After falling from a weekly high of $3,366, gold prices found demand again in Asia on Friday. Strong US employment data cooled expectations of an imminent Fed rate cut, which supported the dollar and limited gold's gains. Additional pressure is coming from the hawkish shift in Fed expectations, but US budget risks and weak liquidity due to the holidays could increase price volatility in the coming days.
Technically, the focus is on the boundaries of the current consolidation at 3311 and 3357. In addition, within the range there is an important level of 3325, which divides the market into bearish and bullish zones...
Resistance levels: 3350, 3357, 3393
Support levels: 3325, 3311
It is important to understand the situation: due to the holiday in the US, liquidity is lower, making it easier to move the price. The rest of the world, interested in gold, can easily push the price up. The trigger will be the zone 3350 - 3350. There is a chance that the market will try to break through the resistance without a pullback and continue to rise to 3393.
However, the most likely scenario is that after yesterday's volatility, gold will remain within 3325 - 3357 before rising next week
Best regards, R. Linda!

GBPCAD → Retest the area of interest before growthFX:GBPCAD is closing the imbalance area as part of a countertrend correction and consolidating below the 0.5 Fibonacci level. What's next, growth or decline?
The global trend is upward, and the situation is classic: the market needs energy and liquidity to continue growing.
Locally, we see that as part of a countertrend correction, the market is closing the imbalance area, but at the same time forming consolidation below 0.5 Fibonacci, still leaving the zone of interest and order block below 1.84600 untouched.
Technically, there is a fairly high probability of continued growth, provided that the price ends its consolidation with a breakout of the 1.85690 resistance and consolidates above 0.5 Fibonacci.
Resistance levels: 1.85690, 1.8657
Support levels: 1.84986, 1.846, 1.8417
However, as an additional and, in my opinion, the most important scenario, I still consider a complete closure of the fvg and a retest of the 0.7-0.79 zone, within which the order block is located. A false breakdown of the zone of interest and the capture of liquidity could attract additional interest, which would trigger growth.
Best regards, R. Linda!

GOLD → Attempt to consolidate above 3350 for growth to 3400FX:XAUUSD , after retesting resistance at 3347, is breaking through the key level, while bulls are trying to hold their ground above support. There is potential for growth to 3400.
Gold retreated from its weekly high of $3366 ahead of key US employment data (NFP), which could set a new direction for the movement. But technically, this looks like a correction to consolidate above the level before continuing to rise. After three days of growth, the price faced selling amid a recovery in the dollar and profit-taking. Weak employment data (especially below 100,000) could reinforce expectations of a Fed rate cut as early as July and support gold. Conversely, a strong report will strengthen the dollar and put pressure on the metal. The market is bracing for high volatility
Resistance levels: 3363, 3393, 3400
Support levels: 3347, 3336, 3311
The price has entered a new range of 3345-3400. Consolidation is forming above the support level before a possible rise. I do not rule out another retest of 3345-3336 (liquidity zone) before realization and a rally to 3400.
Best regards, R. Linda!

XRPUSDT → Resistance retest. Coin inside the flatBINANCE:XRPUSDT is rising towards resistance at 2.3288 due to a shift in the fundamental background to positive and a rally in Bitcoin, but there is always a but...
On the daily chart, XRP is trading below strong trend resistance, and there is also a fairly strong and voluminous liquidity pool at 2.3300 ahead, which could provide strong resistance. Bitcoin is also approaching its critical level of 110500, which may temporarily hold back growth, and a correction in the flagship could trigger a correction in the rest of the market...
Focus on resistance and the liquidity pool at 2.3288. A sharp approach and capture of liquidity without the possibility of continuing growth could lead to a correction by half or the entire local range (to 2.16).
Resistance levels: 2.3288, 2.357, 2.45
Support levels: 2.25, 2.213, 2.16
If the retest of resistance at 2.3288 ends in a false breakout, then subsequent consolidation below the level could trigger a correction to the above support and interest zones.
Best regards, R. Linda!

AUDCHF AUDCHF is preparing to break through support and fallWeak market structure. Gradually declining lows and no reaction to support at 0.5211. Buyers are trying to keep the price above 0.5211, but under market pressure their strength is weakening.
Relative to 0.5211, we see the formation of consolidation, which is of a “pre-breakdown” nature.
Accordingly, a break below the 0.5211 support level could trigger the activation of buyers' SL orders, leading to liquidation and a downward price distribution.
Potential targets include 0.518 and 0.5164.

GOLD → Retesting resistance may lead to a breakout.FX:XAUUSD breaks the downward resistance line on the senior timeframe and tests the upper limit of the trading range amid the falling dollar and Powell's speech. The metal may continue its upward movement.
The dollar's rise was short-lived after Fed Chairman Jerome Powell hinted at an imminent interest rate cut, but not in July... The probability of a rate cut in July fell to 22%, and in September to 72%.
Markets are awaiting fresh employment data (ADP and Nonfarm Payrolls), which could influence the prospects for rate cuts. Weak reports could revive interest in gold, but for now, the asset remains under pressure due to the short-term strengthening of the dollar and uncertainty surrounding Fed policy.
Technically, if the pre-breakout structure remains intact and gold continues to attack resistance within the local range of 3347-3330 (3335), the chances of further growth will be high...
Resistance levels: 3347, 3358
Support levels: 3336, 3316, 3311
The global trend is upward, and locally, the price is also returning to growth. If the bulls can maintain the current trend, break through the resistance at 3347, and hold their ground above this level, then the next target will be 3390-3400. I do not rule out a correction to 3325, 3316 (liquidity hunt) before the growth continues.
Best regards, R. Linda!

AUDUSD → Pre-breakout consolidation for trend continuationFX:AUDUSD may continue its upward trend. After another local distribution, the currency pair is consolidating and may repeat the cycle
The dollar index continues to fall, the global trend is clear, and the price is testing multi-year lows. After yesterday's speech by Powell, the decline may intensify amid expectations of a rate cut, which will only support AUDUSD.
AUDUSD is moving within an uptrend, stopping below resistance at 0.6583, but is not going to fall.
There was a false breakout (the zone was tested), the structure is not broken, and the price continues to squeeze towards resistance, which could lead to a breakout and growth
Resistance levels: 0.6583
Support levels: 0.6566, 0.6556
There is potential accumulation in the market, and the market is choosing growth against the backdrop of a falling dollar as its direction. Accordingly, the currency pair is one step away from a possible realization phase. Thus, if the price breaks 0.6583 and consolidates above this zone, it may continue to grow in the short and medium term.
Best regards, R. Linda!

GOLD → Retest of the resistance range. Correction?FX:XAUUSD is recovering amid expectations of lower interest rates in the US, and the falling dollar is also supporting the price of the metal.
The dollar remains under pressure due to political uncertainty in the US, budget concerns, and trade risks. However, strong stock market growth and possible tariff measures against Japan and the EU are also affecting the market, adding volatility to gold
Powell will speak at the ECB forum, and markets are waiting for him to hint at a rate cut. Currently, the probability of a cut in July is estimated at 20%, and in September at 77%. A dovish tone will support gold, while a hawkish tone will increase pressure.
Technically, since the opening of the session, gold has exhausted its daily range (ATR), and there is a fairly high probability that after strong growth, the price may be stopped in the 3347-3350 zone.
Resistance levels: 3347, 3350
Support levels: 3312, 3295
If gold cannot continue to rise after breaking through 3347 and the price returns to the resistance zone, then in this case, we can consider a correction to 0.5-0.7 Fibonacci before a possible continuation of growth.
Best regards, R. Linda!

GOLD → Recovery and retest of resistance. DowntrendFX:XAUUSD has been recovering since the start of the session thanks to a weak dollar, but further growth is uncertain. However, the price is still below the key range and important levels.
At the beginning of the week, gold rebounded from monthly lows amid a weakening US dollar, which remains under pressure due to trade disputes with Japan, uncertainty surrounding the budget, and expectations of a Fed rate cut in September.
However, the technical picture for gold remains bearish, and further dynamics will depend on new statements from Fed officials, labor market data, and Jerome Powell's speech on Tuesday.
Technically, after breaking through the global range support, the price is forming a correction and testing 3294. Before a possible rise to 3320 or to the 0.7 Fibonacci zone, a correction to 3271 may form, which will determine the further development of the situation.
Support levels: 3271, 3255, 3245
Resistance levels: 3294, 3320, 3347
A retest of 3295 (0.5) Fibonacci is forming. There is a possibility of a false breakout with a possible correction. If, during the correction, buyers keep the price above 3271 and return to retest 3294, we will have a chance to attempt growth to 3320 - 3347
Best regards, R. Linda!

SOLANA → BINANCE:SOLUSDT.P is consolidating after breaking through trend resistance. The market trigger is 148.0, and Bitcoin is provoking the market to recover...
The market is buying back all the losses. SOL breaks the local downward resistance and forms consolidation with a trigger of 148.0. The market has come to life following the rallying Bitcoin. If the general trend continues, SOL may break out of the accumulation zone and form a distribution towards 154.0
The latest retest of resistance is provoking a correction. Before rising, the price may test the zone of interest at 144 or the lower boundary of consolidation at 142.2. The ideal scenario would be a false breakdown of support at 142.2 before rising.
Resistance levels: 148.0, 154.2
Support levels: 142.2, 137.5
Fundamentally, the situation for the crypto market is improving. Technically, the market is also showing positive dynamics. SOL is consolidating after growth, which is generally a positive sign. Now we need to wait for the price to break out of consolidation and continue its growth. One of the signs of this is a rebound from the 0.5 range and a quick retest of resistance with a gradual squeeze towards the trigger.
Best regards, R. Linda!

BITCOIN → Pause for consolidation before growth. 115K?BINANCE:BTCUSDT focus on the structure on D1. The market is forming local resistance and consolidation after growth. The fundamental background is positive. BTC is following the SP500
The market is recovering in line with the stock market (SP500, NQ) after the de-escalation of the situation in the Middle East. The fall in the DXY is also providing support.
Technically, the focus is on the consolidation phase after the distribution triggered by a false breakout of 100K. The price stopped before the resistance at 108100 and rolled back to 106500, confirming the boundaries of the local trading range, the essence of which is a pause for a breather before a possible continuation of growth. The structure on D1 is compression towards resistance. The trigger is 108100, and a breakout of this level could trigger distribution towards 110500 and ATH.
Despite the fact that the market is under a cascade of resistance (resistance: 108100, 110400, 11900 (ATH)), an important nuance is that after strong growth, the price moved into accumulation in the 100K-110K range on D1-W1, and there are no reasons for a decline yet.
Resistance levels: 108100, 108900, 110400
Support levels: 106500, 104650
If the market structure within 106500 - 108100 remains unchanged and BTC continues to storm the consolidation resistance in the “compression to level” format and stick to the level, the chances of a breakout will increase. I do not rule out the possibility of a pullback to 106500, 105650 before a possible rise to ATH.
Best regards, R. Linda!

GOLD → Local bearish trend. Retest of support.FX:XAUUSD is technically looking a little weak. Support is being retested amid de-escalation of geopolitical conflicts in the Middle East. Interest in the metal is waning.
On Friday, gold remains under pressure ahead of data on the core PCE index, a key inflation indicator for the Fed. If inflation turns out to be higher than expected, this could strengthen expectations of a rate cut as early as July, supporting gold. The probability of a July cut is currently estimated at 21%, and 75% for September. Amid dollar volatility caused by rumors of a possible Fed chair replacement and trade negotiations with the EU and China, traders remain cautious, awaiting clarity on inflation and monetary policy
Technically, before falling, gold may form a correction to 3320 (liquidity capture).
Resistance levels: 3320, 3336, 3347
Support levels: 3293, 3271
If the fundamental background remains unchanged and gold continues to decline towards support at 3293 and break through this level, the breakout could lead to a fall to 3271. However, I do not rule out the possibility that after a sharp decline, a correction to 3320 could form before the fall.
Best regards, R. Linda!

USDCHF → Hunting for liquidity before the fallFX:USDCHF , against the backdrop of the falling dollar and the exit from consolidation, is forming another ‘bos’, which only confirms the market sentiment.
The fall of the dollar only increases pressure on the currency pair. The price has broken out of consolidation and is trading below the key level. USDCHF has broken through a fairly strong support level, which only confirms the bearish market structure. A correction is forming ahead of a possible decline (liquidity capture).
Resistance levels: 0.803, 0.8042
Support levels: 0.798, 0.79
Fundamentally and technically, the currency pair looks weak. The decline may continue after the liquidity capture phase and a retest of resistance. A false breakout of resistance will be a strong signal.
Best regards, R. Linda!

GOLD → Within range. Retest resistance at 3347FX:XAUUSD continues to correct after a false breakdown of support at 3300. Due to uncertainty, the price may remain in the range of 3300-3340 for some time.
Gold is fluctuating amid a weak dollar and uncertainty over Fed rates. Gold is struggling to hold on after rebounding from weekly lows, despite the US dollar falling to multi-year lows. Pressure on the dollar has intensified due to Trump's criticism of the Fed and rumors of a possible replacement for Powell. However, gold is limited in its growth due to a pause in geopolitical tensions and hawkish signals from the Fed chair. Investors are awaiting key macro data from the US (e 12:30 GMT Durable goods orders, GDP, Initial Jobless Claims) and especially the PCE inflation report on Friday.
Technically, the focus is on key areas of interest: 3300, 3306, 3340, 3347. Until strong news emerges, an intraday trading strategy should be considered.
Resistance levels: 3347, 3357
Support levels: 3320, 3307, 3300
Technically, a false breakout of resistance at 3347 and a retest of the local liquidity zone at 3320-3307 are possible before growth continues for the reasons mentioned above. Targets could be 3347, 3364, 3372, and 3396.
Best regards, R. Linda!

GBPUSD → Pre-breakout consolidation. One step away from a rallyFX:GBPUSD is trading in consolidation. Against the backdrop of the falling dollar index, the currency pair is testing resistance at 1.3632 but is not yet ready to bounce down.
Against the backdrop of the dollar's decline due to fundamental reasons, the GBPUSD currency pair is strengthening. Technically, this could lead to the price breaking out of consolidation upwards. A pre-breakout base is forming relative to the upper boundary of consolidation. The price is compressing towards the level, volatility is decreasing, which in general could lead to a breakout of resistance - trigger 1.3632. The exit from consolidation may be accompanied by distribution. The liquidity zone with W1 can be considered as a target.
Resistance levels: 1.3632, 1.3743
Support levels: 1.3593, 1.3508
The global and local trends are bullish. After growth, consolidation is forming. Against the backdrop of the falling dollar, GBPUSD is testing resistance. The reaction to the false breakout of resistance is weak. The chances of a breakout are quite high.
Best regards, R. Linda!

GOLD → Attempt to buy back the fall. Uncertainty factorFX:XAUUSD is falling within our expectations. After breaking through the trigger-level of 3340, the price fell to the liquidity zone of 3306. There is uncertainty in the market...
Gold is rising after a false break of support at 3300-3306, interrupting a three-day decline amid a weakening dollar and ongoing tensions in the Middle East. Investors are cautious due to the unstable truce between Iran and Israel, while the decline in USD/JPY after the Bank of Japan's statements and the rise in PPI in Japan are further supporting demand for gold. Powell's comments on the need for caution in monetary policy only temporarily strengthened the dollar. Now the market is focused on US housing data and the second day of Powell's speech
Technically, the price may consolidate at 3306-3347 for some time and only then show us (against the backdrop of the fundamental sentiment that has formed) which direction it will then take
Resistance levels: 3347, 3364, 3372
Support levels: 3319, 3307
The market is trying to buy back the decline. Tuesday's daily session closed with a long shadow, indicating interest in this price range. A pullback to 3320-3310 is possible before growth to 3340-3347.
Best regards, R. Linda!

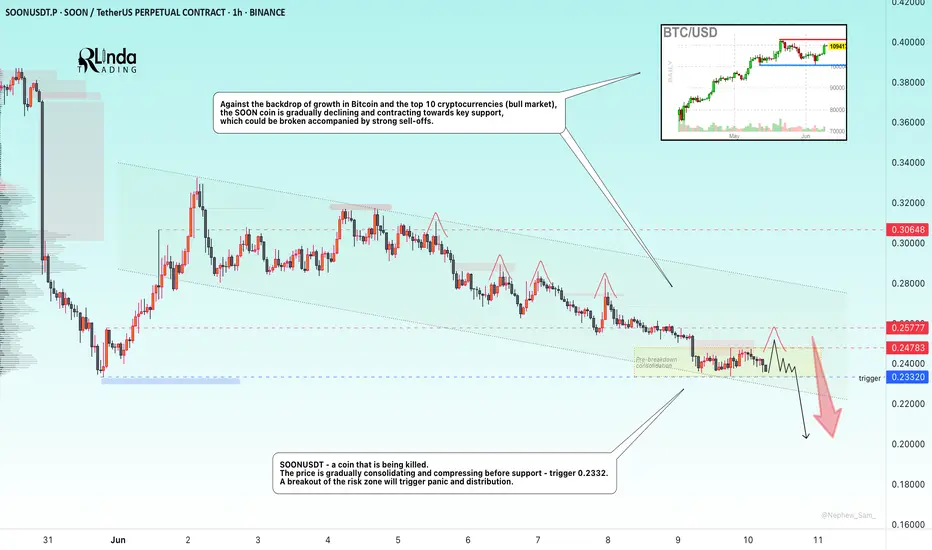
SOONUSDT → The coin that gets killed...BINANCE:SOONUSDT.P is under pressure. The coin looks extremely weak against the backdrop of a bullish market, with key support ahead, separating traders from the panic zone and a sharp decline
This coin is being killed. The price is gradually consolidating and compressing before support - the trigger is 0.2332. Against the backdrop of the overall decline that the market has experienced after a slight impulse from 0.2332, shocks are forming with the aim of capturing liquidity (red check marks). This generally indicates that large players are gathering a bearish position. A breakout of the risk zone will trigger panic and distribution.
Against the backdrop of growth in Bitcoin and the top 10 cryptocurrencies (bull market), the SOON coin is gradually declining and contracting towards key support, which could be broken accompanied by strong sell-offs.
Resistance levels: 0.2478, 0.25777
Support levels: 0.2332
If the coin continues to contract towards the 0.2332 support and form a pre-breakdown consolidation, there will be little chance of survival. In the short and medium term, I expect prices to fall.
Best regards, R. Linda!
GBPAUD → Countertrend liquidity captureFX:GBPAUD is forming a countertrend correction within a global uptrend and testing the support level with W1-D1, forming a false breakdown...
Against the backdrop of the dollar's correction, GBP/XXX pairs are strengthening. On the weekly timeframe, GBPAUD is forming a retest of support at 1.067 (false breakdown) within an upward bullish trend.
Unable to continue falling, the price returns above 1.0673 and consolidates in the buying zone. A breakdown of the structure will confirm the bullish sentiment.
Support levels: 2.0673
Resistance levels: 2.0785, 2.0852
If the bulls manage to hold their ground above the 2.067 support level within the current structure, the currency pair will have a good chance of returning to the bullish trend.
Best regards, R. Linda!
