GBPUSD - Still Bullish - Dont trap your self ! Hi Guyz, welcome to other episode of analysis for GBPUSD.
From our 1H chat, it is seen that as per DOW Theory, the market has broken the HL and it seems like market has entered into the bearish trend However, the catch is there is no divergence followed by the break of HL. It implies that market is taking a corrective move, which is 50 percent of FIB level. Thus, there is a formation of AB=CD harmonic pattern.
we plan our entry on the break of "B" point and projected TP in our case is "D" point.
stop loss is placed beneath HL as marked.
Ab-cdpatterns

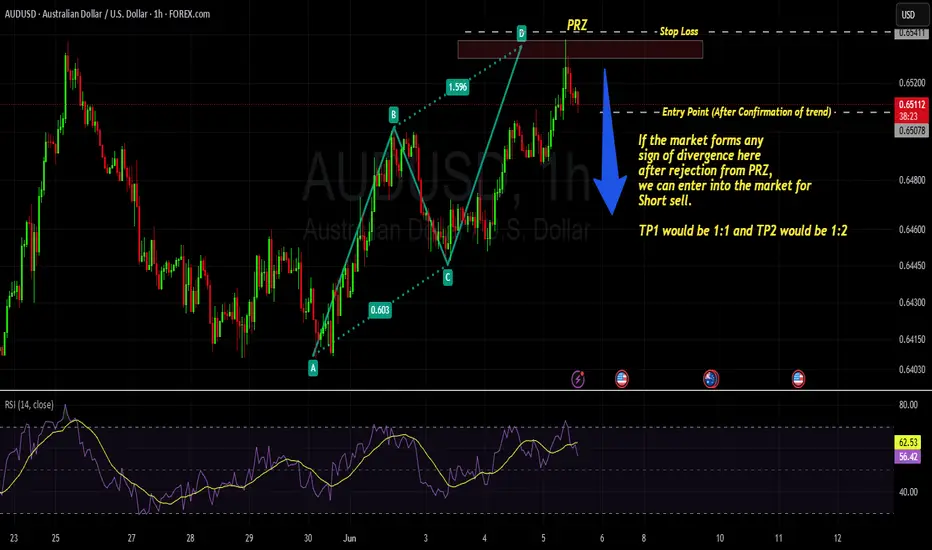
AUDUSD - AB=CD pattern - trend reversal AUDUSD has completed AB=CD pattern and it seems like market will take a reversal from here, we need to check if there is divergence. if YES, we can take entry on the 1st LH and LL followed by the break of HL.
entry and TP is planned / mentioned accordingly.
EURAUD - Bearish Trend to Start - Harmonic + Divergence ComboHello Friends, Market after making series of HH and HLs, have finally made a fantastic Bearish Divergence on 1H time frame which is clear sign of correction.
Further market has almost completed AB=CD harmonic pattern, which is suggesting Potential Reversal Point as marked.
these confluences suggest a bearish trend to start
We are waiting for the neckline (HL) to break with a good candle and then we enter into the market with TP1 and TP2 with a R:R of 1:1 and 1:2 respectively. Further, place stoploss slightly above the HH.

BITCOIN - Bullish Ahead !!!!Bitcoin is in bullish trend making series of HH and HL, Market is making perfect AB=CD pattern and therefore we can project our TP at "D" point which could be a potential reversal zone.
Entry at Breakout of "B" and SL below HL.

EURUSD - AB=CD harmonic Pattern | BULLISH TREND continuationThis analysis is done on 4H time frame, as it can be seen that market is making series of HH and HL which is our Bullish Trend. however, market took a deep correction and broke the HL which seems trend reversal. Since there is no divergence before correction therefore it is more weighted toward continuation pattern. Having said that, Market took a deep correction till FIB level of 0.618 which forms a AB=CD Harmonic Pattern.
The point D is our Potential Reverse Zone, and it also coincides with the 4H good resistance level (Perfect confluence of PRZ). Therefore we can project our market to reach there.
Entry Points : IN our case we shall plan safe entry on Break-of-Neckline, however the neckline is already broken, therefore we can instant enter into the market OR wait to break again the Market with Good Bullish candle (with good momentum / body).
Our 1st TP will be with R:R of 1:1 and 2nd TP would be 1:2 R:R , As usual SL would be placed below HL as market in the chart.
Regards,

USDCAD 15-Min Setup: Buyers Defend Crucial ZoneGood morning traders,
Trust you are doing great.
Kindly go through my analysis of USDCAD currency pair.
Overview
The USDCAD M15 chart presents a bullish price setup around the 1.38350–1.38410 support zone, with current price action consolidating just above this area.
Idea
Price bounced off the key support zone (blue box), suggesting buyer interest. The BB Squeeze momentum indicator shows weakening selling pressure, which could signal an upcoming bullish move.
Key Support: 1.38350
Upside Targets: 1.38650, 1.38880, and 1.39039
Invalidation: Setup fails if price breaks below 1.38280
From the fundamental context, we can see that the Canadian dollar (CAD) is moving more in sync with the U.S. dollar (USD) again, a return to its historical behavior. This happens because Canada was spared from certain tariffs, making its economy more closely tied to U.S. growth sentiment—a key bullish factor for CAD when the USD strengthens. But because CAD is now closely tied to U.S. sentiment, CAD won't weaken as sharply, which might explain why the price is consolidating instead of spiking aggressively. As such, we might see a slow but steady move on the pair as time progresses.
Conclusion
As long as the price holds above the 1.38350 support zone, a bullish continuation toward the mentioned targets is likely.
Cheers and happy trading.


PRL WEEKLY CHART TOWARDS 60 ??PSX:PRL
1. Weekly chart suggests that price is working in cup shape.
2. AB:CD pattern is in play since 2023.
3. DEC23 : 35, Dec24: 45
4. Safe bet for PRL with current patterns is 55-60

Honestly, I don't feel like explaining, the chart says it all !!the POPCAT is in a ascending triangle now which means the price will increase and also It is expected that the price would at least grow as good as the measured price movement(AB=CD)
Note: we should wait for the breaking of the triangle and than make a move!
✨Traders, if you liked this idea or have your opinion on it, write in the comments, We will be glad.
_ _ _ _ __ _ _ _ _ _ _ _ _ _ _ _ _ _ _ _ _ _ _ _ _ _ _ _ _ _ _ _
✅Thank you, and for more ideas, hit ❤️Like❤️ and 🌟Follow🌟!
⚠️Things can change...
The markets are always changing and even with all these signals, the market changes tend to be strong and fast!!

Short-Term Resistance Calling for Attention on USD/JPYSince topping at ¥156.77 on 14 May, short-term price action on the H1 chart for the USD/JPY has exhibited a downside bias. Of late, as you can see, recent flow chalked up a pullback from a low of ¥153.60 and has initiated the process of forming the D-leg of an ‘alternate’ AB=CD bearish formation at ¥154.95 (marked by a 1.618% Fibonacci projection ratio). The rationale behind selecting this alternate pattern, and not the 1.272% Fibonacci projection ratio (or the equidistant AB-CD), is simply down to the confluence that the 1.618% Fibonacci projection attracts: a 61.8% Fibonacci retracement ratio at ¥154.97 and a nearby 38.2% Fibonacci retracement ratio at ¥154.81.

ETHUSDT: Possible Swing Target Towards $4500! BINANCE:ETHUSDT
Price is in process of making ab=cd pattern where we have a possible order block placed too at the point of D which is our area of entry. Our initial target is at $3500 and then $4000 and lastly it will at $4500. We can achieve this target by end of this month or next one depending on how other Economic factors interfere with the price movement.
good luck.

BTCUSDT BEARISH AB=CD PATTERNHarmonics Bearish AB=CD Pattern
Instant Buy :28514 Because B Point Already Broke
Stop loss:27900
Take Profit AT D POINT
RISK REWARD 1:1
D Point is Likely Reversal Zone
Wait for the Divergence
Then Trade Further Accoridng TO Plan For Reversal Divergence

GBPJPY - AB=CDAn AB=CD pattern setup could be used in this manner too. I'm waiting for a shorting opportunity at 167.03.
Aggressive traders could consider an instant shorting opportunity the moment when the market opens, whereas conservative traders could wait for a double top with rsi divergence to engage the trade.
