0909 4HPLAN GBPJPY looking for a new entry to sell to 150.00Hello traders
GBPJPY has reversed our last buying idea by breaking through the green trend line now.
With signals on EMA lines, this pair is more bearish now and 150 should be the possible targets for sellers now.
Choose your plans to sell on this pair.
Details in the video.
GOOD LUCK!!
LESS IS MORE!
ABC

BTC Elliot Wave + ABC correction 47.672 holds as support for now and we push on to complete this 5th wave where we can see the last real hard resistance and return to low 40s for a cool off via ABC correction which would then fuel a move to the upside

0709 2308 ABC Strategy Recap( UC,UJ,GJ,USOIL,GOLD)Hello traders,
For the last week recap, details like this:
1. USDCAD got hit TP1
2. USDJPY still trying to break through triangle for a new swing down
3. GJ hit TP1 and moving up to 2nd TP
4. USOIL is running an ugly ABC wave but daily chart is still strong bullish. Try to look for a entry to buy this week.
5. GOLD hit 1830 WITH IMPULSE LEG ON LAST FRIDAY.
Details in the video.
GOOD LUCK THIS WEEK!
LESS IS MORE!

Drreddy - Elliott wave analysis - B of Y wave correctionIt should now bounce in B wave before next move down as C of Y wave. The drop from 5615 was impulse A wave and it should bounce in B.

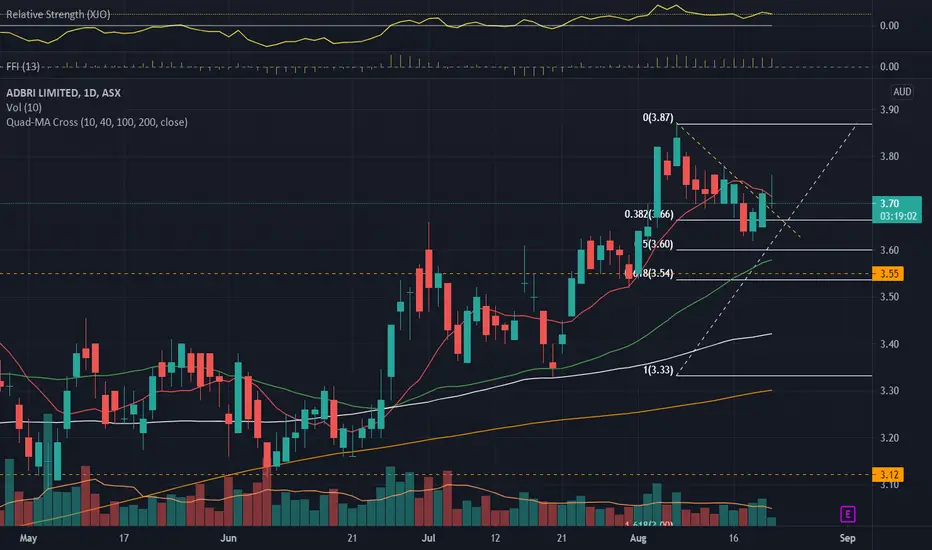
ABC.ASX_Down Trendline Breakout Trade_LongENTRY: 3.71
SL: 3.50
TP1: 3.87
TP2: 4.26
- ADX>20
- RSI<50,RSI<70
- Daily RS +ve
- Daily FFI +ve
- Daily MACD -ve
- Weekly RS -ve
- Weekly FFI +ve
- Weekly MACD +ve
- Showed strength on 4 Aug 2021.
- Retraced close to 50% Fib level (3.60) with lower volume.
- Breakout of down trendline with high volume on 18 Aug 2021.
Adaniports - Elliott wave analysis - B of ABC correction Adaniport - It is in ABC correction and B wave looks like forming triangle and one more wave away to finish it before C wave starts moving down.
Below 653, it will going to bearish and can go more downside up to 560 or lower. There is an alternate path of making B wave as abc and can go little higher up to 760 before it turn bearish for next leg as less probable count.
Share your comments, if you agree or not or having alternate count. Thanks

Market Structure Alignment EURUSD --- ABC Correction magnifiedMarket Structure Alignment
EURUSD
M = bg
W = bg
D = brg
H4 = brg
H1 = brg
M15 = br
M5 = br
M1 = br
CODES:
b = Bullish
bg = Bullish Range
br = Bearish
brg = Bearish Range
Bimb = Buyers IMBalance
Simb = Sellers IMBalance
H = High
HH = HigherHIGH
HL = HigherLOW
L = Lower
LL = LowerLOW
LH = LowerHIGH
Black = Monthly
Red = Weekly
Green = Daily
Yellow = H4
SkyBlue = H1
NavyBlue = M15
Pink = M5
Purple = M1
Orange = Alerts

Bitcoin Still bearish in short term"be fearful when others are greedy, and greedy when others are fearful" - Warren Buffett
No More Caption.

Drreddy - Elliott wave analysis - ABC zigzag in Y waveThe drop is in 5th subwave of A and will go down before it bounce in B wave. The overall structure is complex sideways correction and form ABC zigzag in Y wave as shown in chart.

Asianpaint - Elliott wave analysis - ABC correction It completed the impulse sequence at 3180 high and dropped sharply as wave A. The current price action is not very clear, but if it drops below 2954, it is considered to be the part of 3rd of C wave and can go further downside. Unless then, there is a chance of B wave flat correction.

Adanient - Elliott wave analysis - ABC correction It is in sideways correction of B wave as expected in earlier updates. At current level, either it finished the B wave as complex sideways correction as wxy as trucated correction or it may possible that it is forming triangle before next wave C down. The C wave will probably confirms below 1332 and can go down below 1080 level.

Asianpaint - Elliott wave analysis - ABC correction Asianpaint is in B wave correction followed by A wave fall and will go more downside once it finished. There is a possibility of more sideways price action before it start C wave down.

Adanient - Elliott wave analysis - ABC correction Adanient is in sideways complex B wave correction and can go up to 1600-1635 zone before it will end it and start moving down for C leg. Above trend channel of abc move (last leg) it can go up to mentioned level of even slight higher. If it failed to go above W wave high of B, then there is a possibility of triangle as B wave.

BITCOINSELL SETUP
WAIT FOR THE PRICE ACTION TO CONFIRM , GOOD LUCK!!!
This post does not provide financial advice. It is for educational purposes only! You can use the information from the post to make your own trading plan for the market. But you must do your own research and use it as the priority. Trading is risky, and it is not suitable for everyone. Only you can be responsible for your trading

BITCOIN - CURRENT SITUATIONIn the last days of trading we were able to tap into the important support at the 38.2% retracement at $ 37,482 with a precision landing. From there the market showed a solid push to the north side. The bulls now have to show whether this is enough to end the current wave (iv). Theoretically, the ideal goal of the correction was achieved and the bulls could take off now. We should definitely hold $ 35,922 on this move, otherwise the upside scenario could be invalidated. Overall, we could see prices in the $ 51,000 area if we break $ 42,300.
After the B wave, I expect new lows in Bitcoin. My overall primary expectation / scenario is still intact!

ABC correction over for Klever KLV?Past has shown that "exchange" coins did great.
BNB
KuCoin KCS
Leo (not soo much)
and of course Klever.
It's a dark horse. I see big potential, especially for short giant bursts in a price increase.
Let's see what the future brings.

Bitcoin's Path Ahead!As discussed on multiple occasions here on TradingView, Bitcoin is likely in an ABC correction. We called the bottom at ~$30 000, yet with the possibility of a final mini dump towards the $27 500 area. Regardless of what, Bitcoin has now initiated its B-wave. This B-wave serves one purpose and one purpose only: to trick the bulls that everything is fine from now on. One technical area of high interest is the diagonal resistance that coincides with the 0,5 fib. This is an area that I will pay extra attention to.
With that said, whenever any underlying is trading within either a range, formation or consolidation, they tend to ignore regular indicator supports and resistances. Depending on how Bitcoin were to proceed from here we will assess the ~$46,500 resistance differently.
As recently discusses Bitcoin is most likely developing a zig-zag ABC correction as the A-wave consisted of 5 sub-waves. This naturally concludes that the B-wave should consist of 3 sub-waves in turn. By this token, if Bitcoin were to get its B-wave of the B-wave correction at for example $42 000 then chances are dramatically increased that the $46 500 area will be the final level prior to initiating a steep C-wave to kill off any final bullish enthusiasm.
If, on the other hand, Bitcoin were to go relatively straight towards this area and then get rejected, chances are that it will continue further up until it's done with the B-wave. Such case would pave the way for a flat, in which the aforementioned bottom at ~$27 500 would be the likely and absolute bottom in case of an expanded flat. Otherwise, a bottom between $30k-35k is more likely in case of a regular or running flat.
Time will tell. For now it all comes down to HOW Bitcoin will move up towards the mid to late 40 000 range.


USDCAD - Elliott WaveABC ZigZag, the reaction of 50%, and a clean break. Analysis can be seen on higher timeframes.

"ABC its easy as 1.2.3" - Gold onwardsLadies and gentlemen,
Once again I wright this message after many beers, (i am currently on holiday with the family) i also found an inflatable sheep in the bathroom vendors for £5
.. yes I'm on holiday in wales.
Back to the charts, as previously said i would take shorts with some correction, this is exactly what happed today, i added shorts. My risk is set above the the last highs bearing in mind the 61.8 may still be active however today the 50% on the fib still held. DXY also finished bullish on the day helping gold although we saw 11+ dollars on gold i held my nerve and shorted now were sat ok.. tomorrow should be a great day.
if you want to see more give me a like, message and follow and I'm always here to talk graphs and the best pints.
I watch the month week daily and place on either the 8/4/1hr charts.
I am not a financial advisor or anything like that but I do take money from the market....
Firm handshakes.
HAPPY TRADING. >:-)

Bitcoin Reversal At $27,500For quite some time now "everyone" seems convinced of Bitcoin prices in the low to mid 20 000's. Some even anticipate lower dips than that. I certainly don't exclude that, buy given how undramatic this break below $30 000 has been thus far, there is good cause to expect a price reversal soon. Here's why.
My previous theory of an ABC move is still very much in play - one in which we'd be in the midst of completing the A-wave. As Elliott waves normally tend to nicely coincide with fibonacci levels we can clearly identify that a potential A-wave bottom would align with the 618 fib on the weekly chart.
What further adds to this theory is the aforementioned fact that Bitcoin behaves in a "civilized" manner under $30 000, counter to what most technicians had anticipated. Most traders predicted a free fall below $30 000 due to the utter lack of resistance between 20 000-30 000, with the vague exception of ~$24 000.
If Bitcoin can remain tidy and steady below $30 000 and not panic, chances are increasingly strongly in favor of an A-wave completion at the 618 fibonacci - which would also align with the support of the descending channel.
And, most importantly, when everyone expects Bitcoin to plunge, chances are it won't. THAT'S when we shall look for difficult-to-spot reversals such as this.
Our previous B-wave targets here on Trading View stand at ~$46,500.

Scenario: C point jump @ Brent oilThis is an ABC correction and C point jump @ Brent oil. Target price is the local high, 77,8 USD/barrel.

"ABC its easy as 1.2.3" - GoldGood evening been pretty quite just enjoying the sun here in the U.K, absolutely dying.
Strong USD last week makes me think this gold set up for a short profitable.. I did have an alarm on the 61.8 retracement level but it looks as if the 50% has held up nicely; giving us sight of an ABC pattern forming. Targets for the downside for me will be around 1660 but I'll updated through the trade.
Going to be looking for shorts on this over the next coming days the creation of a lower high on a smaller time frame will give me the go ahead.. This becomes invalid if we pass the 50% level then we aim for the 61.8 and if that doesn't hold then lets all just buy gold...
I watch the month week daily and place on either the 8/4/1hr charts.
I am not a financial advisor or anything like that but I do take money from the market....
Firm handshakes.
HAPPY TRADING. >:-)
