ABC

What To Expect From Bitcoin Hands down, things look bleak for Bitcoin. But regardless of what, such bleakness is likely just a short-term glitch. Any break to the downside should be bought up quickly for a rather steep V-shaped recovery. The deeper it goes (as in the closer it gets to $20 000) the faster and more aggressive that recovery should be.
Based on the current technicals there are a few highly likely outcomes from here on. Some of them we've discussed earlier here on TradingView, others are new.
1) Bitcoin takes a final leg down towards the mid $27 000's for an A wave zigzag. We originally deemed this to be completed amidst the recent $28 600 plunge. Yet, Elliott might have one more minor surprise in store before initiating the B-wave. This would all make good sense for two reasons. Firstly, "everyone" expects Bitcoin to drop significantly upon potentially breaking the $30 000 level as there are no real supports to speak of until $20k. And add to that the number of times Bitcoin has already tested the $30 000 support zone and a strong move is anticipated. In this sense, the "expected thing" would be the unexpected as the market rarely does what the majority expects of it. Such final A-wave zigzag to the $27 500 area (give or take) would nicely align with the primary 0,618 fib.
Upon a steep recovery from this level Bitcoin would initiate its B-wave rally, which, to many, would be a "confirmation" that Bitcoin is now ready for higher highs. That in turn would be the prime area of danger as Bitcoin could then initiate an aggressive C-wave to kill off any last hope.
2) Bitcoin initiates its B-wave already. There are three things that speak loudly in favor of this outcome. Firstly, Bitcoin is flirting with the lower bullish RSI line and would, if closing within 1% from its 39,55 value, issue a strong buy signal. These signals come with a high reliability and low risk and are famous for generating profits in the thousands of percent. As it stands, any daily closing at around $31 500 should result in a buy signal.
Secondly, upon such a buy signal it would likely trigger an initially steep upwards move - one that would also break above the long-stretching RSI resistance. This resistance has eight rejections already. And the more times any resistance line is tested, the more energy it saves up to be released upon a break thereof. A lower bullish red RSI closing in combination with a diagonal RSI resistance breakout should be enough to propel the price into the mid to late $40 000's in the upcoming few weeks.
And thirdly, the lower bullish red line on the weekly stands at 41,65. This number is fixed and never changes. Based on the current reading at 42,02 it does qualify for a weekly buy. Do note, however, that this needs to be the weekly RSI closing - as in +/-1% from 41,65. We always base these on the closes.
But here's an additional very important clue: When a lower bullish red RSI closing comes immediately from high levels - as it does on the weekly Bitcoin chart - any buy signal typically means a relief rally rather than an actual reversal. This would confirm a B-wave move to follow in a textbook fashion. The strong, long-term buy signals are in turn given when the RSI creeps up from lower levels (generally speaking 30 or below) and then makes a clear touch from slightly above.
For more these strategies you are advised to watch the RSI trilogy on our YT channel.
As a short summary: I doubt that Bitcoin will plunge down low from here. A final A-wave zigzag down to the $27 500 area would make perfect sense. If not, and if we get a lower bullish red closing on the daily (and ideally on the weekly too) and a break above the diagonal RSI resistance on the daily, then a steep B-wave should be initiated.

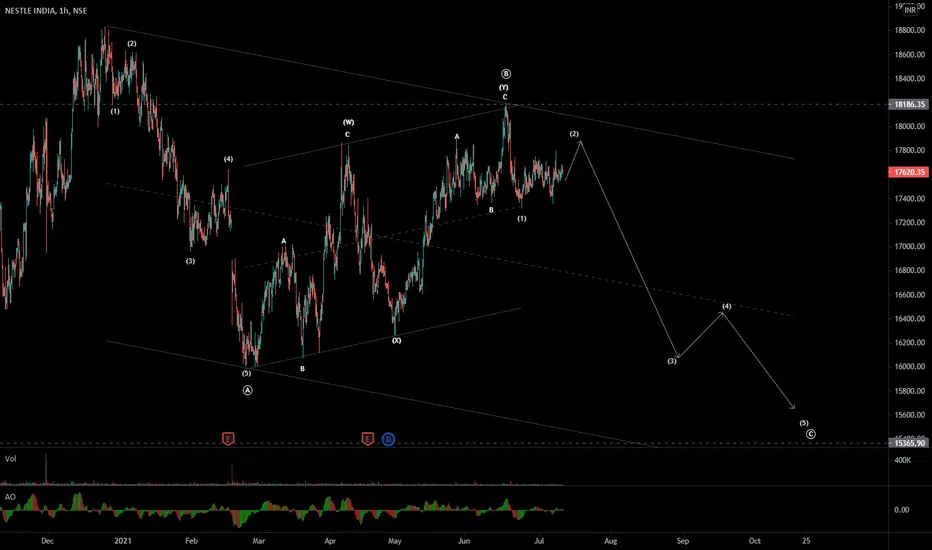
NestleInd - Elliott wave Analysis - C of ABC zigzag It is in2nd wave correction of C wave as in ABC zigzag bearish pattern.
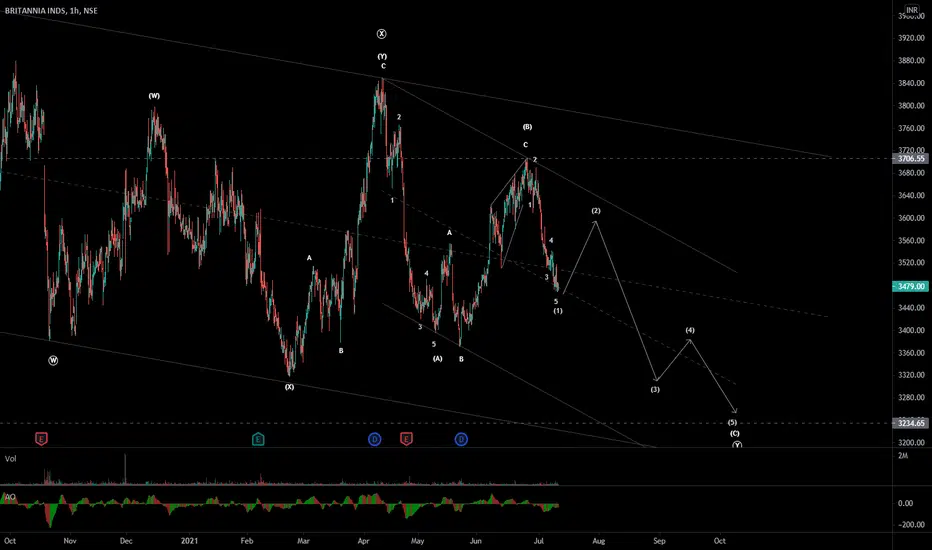
Britannia - Elliott wave Analysis - C of ABC zigzag It is in ABC zigzag pattern as (Y) wave. 2nd wave will start soon in C wave.
BRENT OIL - (USDBRO): more down coming?Im looking for this move as a C wave down to 1 on these 3 red paths.

EURUSD, Long possiblity that may last for weeks.Hello ladies and lads,
there is a good opportunity in EURUSD. I have described the situation briefly in the following lines:
1- Pattern:
5 wave pattern (motive) of C of Bigger ABC.
2- Fib zone:
1st wave projection from end point of 4th: 3.00
3rd wave projection from end point of 4th: 0.382
4th wave extension: 1.272
3- Indicators:
MACD : showing a Divergence that occurs mostly at the end of a motive wave.
DT Oscillator:
I have used 8.5.3.3. as the configuration for DT in EURUSD's chart.
both Daily and Weekly charts are in oversold position and their signal line has been crossed upward.
4- Trade Trigger:
2-5 pips above 1.18842
5- Invalidation and stop loss:
2-5 pips lower than 1.18060
6- Take Profit:
First tp can be 1.19753, but the potential is much more if conditions are met.
I will update this part later.
This is it. I would be glad if I could hear your thoughts on this.
You can ask me any question you have!
Thanks for your time,
hasta la vista!

Bitcoin - something for everyoneI think we will see that way.
This would drive people crazy again.
Around 37k-38k you can think about selling orders again.

LICHSGFIN - Elliott wave analysis - ABC correctionIt completed impulse cycle in 4 hr time frame and started correction. Wait for B wave bounce up to 500 level to short sell for C wave down for target around 400 zone.

CHFJPY - Elliott Wave ABC Long, touching fibonacci, confirmination is visible on 1hr and clear 61% on 15min to start wave C.

GBPCHF - Elliott WaveABC Short. I can see 61% retracement in wave C, and it's visible on the 1-hour timeframe which is my confirmation of entry

GBPJPY - Elliott WaveABC short could go to 1.61% of A or wave 1 as it reacted of 61% Fibonacci but the target is 100% to play safe.

USDCAD - Elliott WaveABC Short, 61% retracement can be seen at the start of the entry which is my confirmation of entry. Of course no guarantee this means it's starting.


GBPCHF - top of the range for possible sellsExpecting D1 to create another wave down before further continuation up
H4 - top of the consolidation zone
H1 multiple divergences.
Looking for convergence on H1 to validate bearish pressure.

USDJPY ShortHello ladies and lads, hope u all are doing great.
Based on Elliotwave theory, we probably are right at the end of B of ABC correction pattern. But yet still we do not have a sign of a reversal at the time, but i can see there is a high chance that we see reversal signs that confirm this story for our USDJPY.
I have left the tools that i have used to find a Time and Price PRZ, the square that is RED, on the chart itself so you can hover over and see what i think is happening here.
for the last thing, it is nice to mention that DT oscillator in Daily time frame is in Over Bought situation.
I would be glad to hear your ideas on this Idea of mine. and feel free to ask your questions.
thanks for your time.
Good luck

EURAUD - long setup - intradayD1 - holding a key support zone, no signs against, bullish hidden div
H4 - bullish div, false break, trend line breakout
Expecting continuation higher as long as the key support zone holds.

USDJPY - Expecting second leg downD1 - after the bullish impulsive structure i expect to see second wave down.
H4 - assumption here is that we are inside a pullback move (the up move). Looking for signs that this move is over and then i will start scanning for possible sell entries.

$DOGE ABC correctionWe saw the huge Doge move, Elliot Wave blow off through the roof,
Next step is to find loading zone,
And we can see it appears to be at perfect ABC correction (white line), after we touch it again, get ready to form new 1st wave of Elliot action

ETHERIIUM - ABC Consolidation? 65% move coming?!Etherium just did a -61% correction to the fib 0.618 zone and bounced up 60%! Here, in the 6H, it met resistance at the lower 55EMA threshold (blue line), signaling that it will NOT make a move to break the ATH ($4.3k), before making a lower-low first.
Therefore, ETH may be in an ABC consolidation.
Look for possible support ~$2.1K. A bounce here could go as high as $3.5K (65% move). Resistance here makes sense - this is the upper 55EMA threshold (blue line).
From here, a possible drop of -68% - consolidating to $1.35k. This happens to be fib 0.786 and AND old resistance line from Jan 2018!
Wherever this bottom falls, it will be the cheapest ETH will ever be. It only goes UP from here folks!
Note: This is just an opinion. Good luck in your trades!

ETH, first week of summerWe found some resistance around the 2900 usd area which is where the 34 Daily EMA is located and also the fib level of 55% from the swing lows. I am expecting an ABC move to the upside and the area between 3500-4000 usd area.
This is just an indication, please check my other analysis below and also other crypto traders in this platform so you get a full picture of the highest probability. But remember, when many people predict the same thing and targets, this may not happen. This is the reason i go for 4000 price target and not anything below or above.
If you are wondering what my retracement levels are, please check my previous publication.
Stay safe!

GET OUT OF MARKET NOW - sell off to come lacklustre bounce
I have decided to pull out of being long for the time being - seems like too much overhead
supply and not enough legs on this bear bounce, another leg down in strong capitulation style
should clear the weak hands out before the bull run could resume....BEWARE IT COULD BE
SURPRISINGLY SHOCKING
Its done a AB but no C leg down and it will probably extend further than wave A down
Get out and collect back in on the sell off

A Beautiful Bullish DivergenceOn the 4 Hourly chart, we have created a bullish divergence on the RSI. We have had a nice ABC correction after a nice pump and I now expect us to continue pumping and break out of this falling wedge. That lower 60 cent area would have been a great entry zone for anyone new to Skale. I have a good feeling about this coin.
