Still Bullish but ..LIVEN
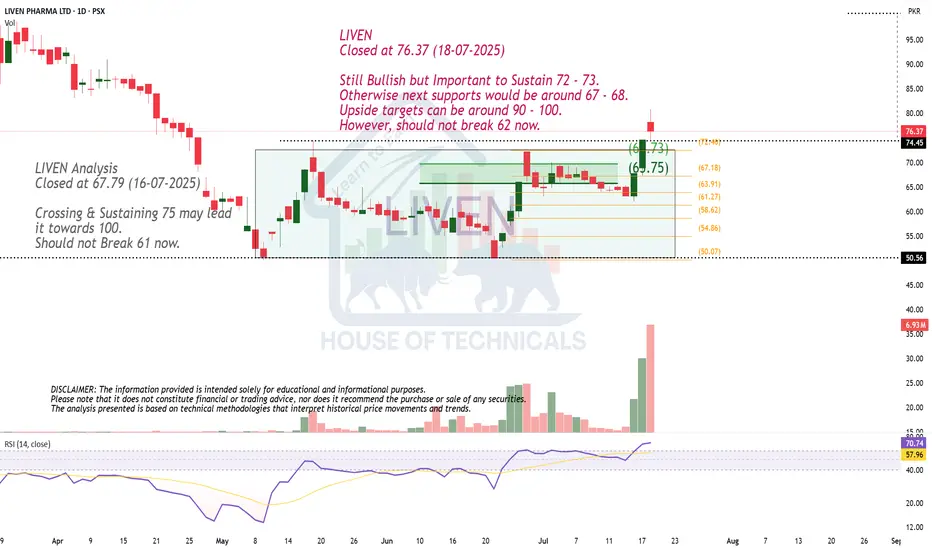
Closed at 76.37 (18-07-2025)
Still Bullish but Important to Sustain 72 - 73.
Otherwise next supports would be around 67 - 68.
Upside targets can be around 90 - 100.
However, should not break 62 now.
Abcdchartpattern
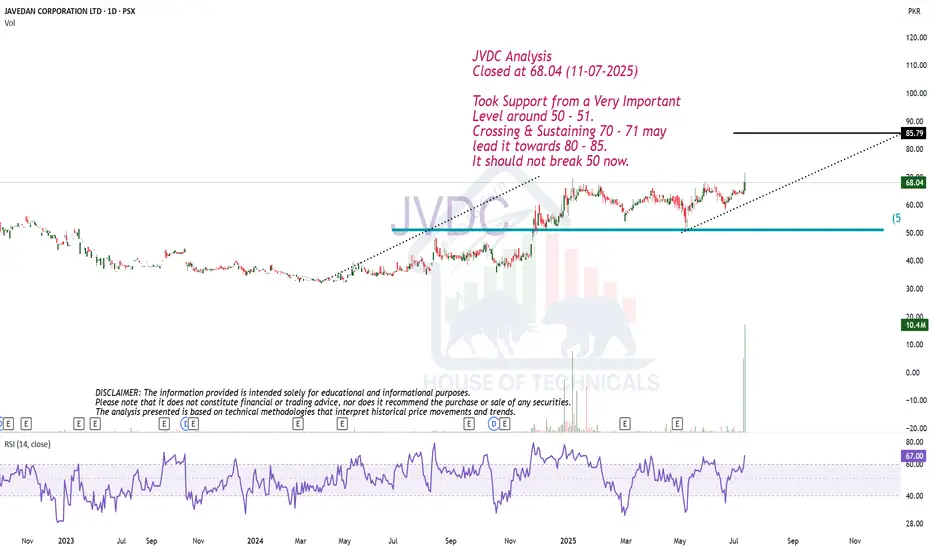
ABCD Possible.JVDC Analysis
Closed at 68.04 (11-07-2025)
Took Support from a Very Important
Level around 50 - 51.
Crossing & Sustaining 70 - 71 may
lead it towards 80 - 85.
It should not break 50 now.
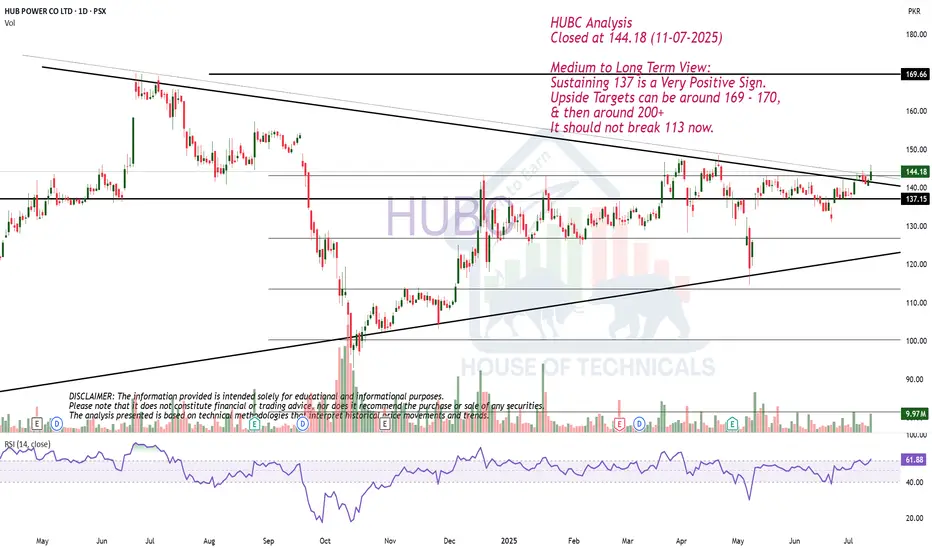
Medium to Long Term View.HUBC Analysis
Closed at 144.18 (11-07-2025)
Medium to Long Term View:
Sustaining 137 is a Very Positive Sign.
Upside Targets can be around 169 - 170,
& then around 200+
It should not break 113 now.
XAUUSD- Bearish AB=CD pattern at resistance zone!Timeframe:2H|Pattern: AB=CD| Bias: Bearish Reversal!
Gold (XAUUSD) has completed a precise AB=CD pattern aligning perfectly with a strong resistance zone near 3340-3350 the symmetry of the harmonic pattern combined with historical rejection levels gives a strong signal for a potential downside move
Trade setup idea:
Sell entry: 3340-3350
target:1: 3300
target:2: 3260
risk reward: Favorable setup with harmonic confirmation.

Running Flat FormationHere we have a Running Flat Formation. At point C it looks to me that price has broken the small upward trend it was in and has imprinted a H&S formation and broken to the downside. I'm waiting for a retest on the previous new structure low (NSL) before taking an entry.

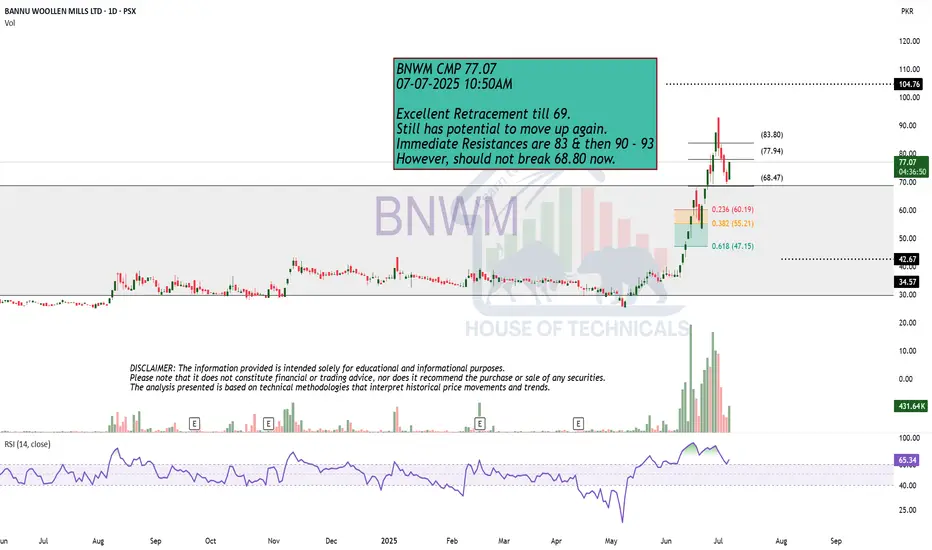
Excellent Retracement till 69.BNWM CMP 77.07
07-07-2025 10:50AM
Excellent Retracement till 69.
Still has potential to move up again.
Immediate Resistances are 83 & then 90 - 93
However, should not break 68.80 now.
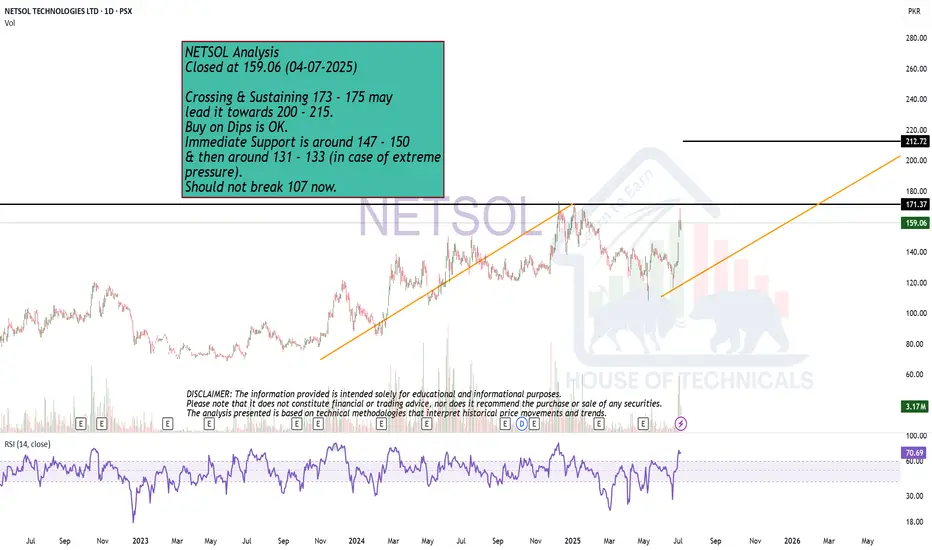
ABCD Pattern NETSOL Analysis
Closed at 159.06 (04-07-2025)
Crossing & Sustaining 173 - 175 may
lead it towards 200 - 215.
Buy on Dips is OK.
Immediate Support is around 147 - 150
& then around 131 - 133 (in case of extreme
pressure).
Should not break 107 now.
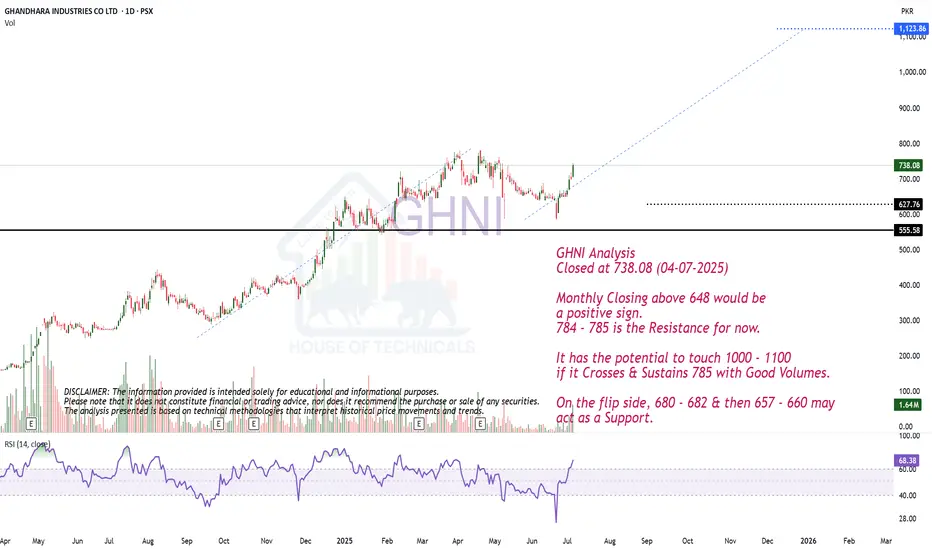
ABCD PatternGHNI Analysis
Closed at 738.08 (04-07-2025)
Monthly Closing above 648 would be
a positive sign.
784 - 785 is the Resistance for now.
It has the potential to touch 1000 - 1100
if it Crosses & Sustains 785 with Good Volumes.
On the flip side, 680 - 682 & then 657 - 660 may
act as a Support.
GBPUSD LongLooking to the upside got BoS pull back into FVG with the second retest. Looking for the bullish extension to the upside.

Beautiful ABCD pattern appearing on bigger tf.Beautiful ABCD pattern appearing on
bigger tf.
Crossing 101 - 102 with Good Volumes may
trigger new highs towards 120 atleast.
78 - 80 is an Immediate Resistance area.
On the flip side, a Very Strong Support is
around 68 - 70 & then around 62 - 63

EURUSD shortThe Setup:
1. A-B: Strong impulsive drop on increasing volume → clear evidence of real selling pressure.
2. B-C: Pullback forms on decreasing volume → classic corrective behavior, not buyer aggression.
3. C-D: Entry just below point C as new volume confirms sellers stepping back in.
4. Targeting >3R with stop tucked above C — logical structure, clean invalidation.
✅ Volume confirms the trend
✅ Structure is tight, no randomness
✅ Timing aligns with volatility spike (news at the bottom?)
✅ Clear bearish continuation pattern
what do you think of this a head of cpi?

AUDJPY pull back to FVG then LongAUDJPY Long Setup (Preliminary Plan)
Target Levels:
First Target: 94.300
Second Target: 94.800
Strategy:
Looking for bullish price action (PA) confirmation around the highlighted Fair Value Gap (FVG).
Expecting a possible breach of minor resistance on open, which may lead to a push toward the first target at 94.300.
A pullback may follow after the first target is hit.
Notes:
This setup is preliminary and subject to adjustment.
Live price action will be monitored before executing the trade.

A Harmonic Pattern Entry Into A Potential Continuation TradeI don't look at Bitcoin often but when answering a question for another trader this weekend I stumbled across an interesting opportunity.
Higher timeframe we've recently broken and closed above a previous high, allowing me to project that price is likely to continue higher.
We've already started to retracement in the form of a complex pullback and if you look carefully on the lower timeframe this complex pullback as also created a bullish bat pattern which could be used as an entry.
Please leave any questions or comments below
Akil

2 Bullish Patterns under Construction ;-)APL Analysis
Closed at 460.36 (29-05-2025)
2 Bullish Patterns under Construction ;-)
Imemdiate Resistance is around 468 - 470
which needs to Cross & Sustain on Weekly basis.
It may then easily touch 550.
On the flip side, 441 - 445 may act as a Good Support.
& breaking 440 will bring more selling pressure towards
410 - 415.

Hidden Bullish Divergence on Bigger tf.IMAGE
Closed at 21.94 (27-05-2025)
Hidden Bullish Divergence on Bigger tf.
Monthly Closing above 20.70 will be a
positive sign.
Upside Targets can be around 26 - 26.50
On the flip side, 20.50 - 20.68 is a Good
Support zone and then around 19.
Should not break 17.30, otherwise we may
witness nd Reversal.

HH HL intact.FLYNG Closed at 50.80 (25-05-2025)
HH HL intact.
No Bearish Divergence yet on bigger tf.
54- 56 is the resistance for now.
If this level is crossed with Good Volumes,
we may witness further New Highs around 60+
On the flip side, 49 - 49.50 & then 47 - 47.50
may act as Good Support Levels.
However, breaking 45 will bring more Selling Pressure
towards 42 - 44

Though Bullish but..
Though Bullish but Bearish Divergence has appeared
on bigger TF.
ABCD Pattern intac but only if 155 is Crossed & Sustained
with Good Volumes.
Upside Targets can be 200+
Good Support levels are 136 - 138 and then around 123 - 125

ABCD still intact..Couple of Green candles above 20
would trigger more positivity.
Upside targets are intact 27-28 &
then 30+
Should not break 17 now.

Buy with SLCan buy with SL 0.03454
TP 0.03480
Crossing & Sustaining 0.03509
may lead it towards 0.0565

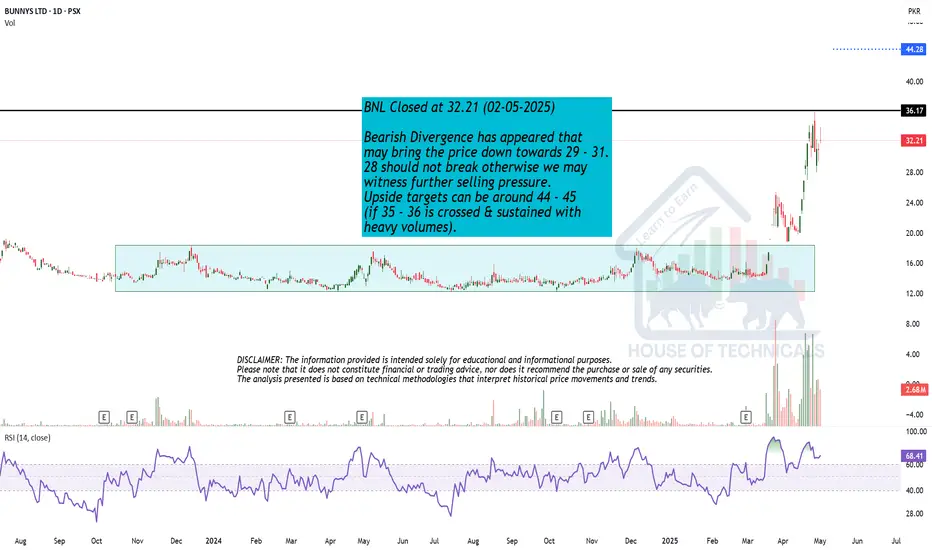
Bearish Divergence has appeared.
Bearish Divergence has appeared that
may bring the price down towards 31 - 32.
28 should not break otherwise we may
witness further selling pressure.
Upside targets can be around 44 - 45
(if 35 - 36 is crossed & sustained with
heavy volumes).
Approaching important Support Zone..Important to take Support from
this Level ( 21.30 - 22.50).
Otherwise more selling pressure
will be observed.

Breakout re-tested.Breakout re-tested.
Morning Star formation.
The only concerning thing is Bearish
Divergence appearing on Weekly TF.
Crossing & Sustaining 140 may lead it
towards 160.
However, breaking 120 may bring further
selling pressure.

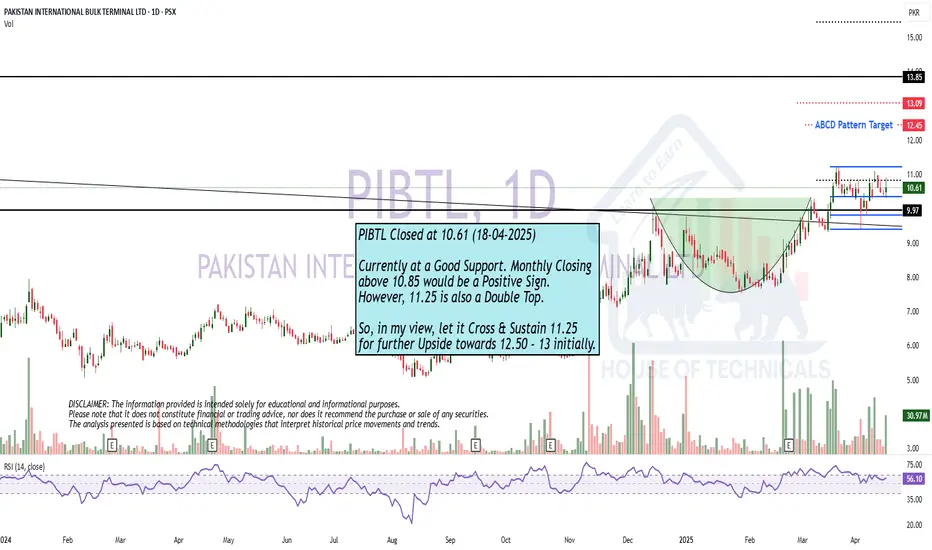
Monthly Closing MattersCurrently at a Good Support. Monthly Closing
above 10.85 would be a Positive Sign.
However, 11.25 is also a Double Top.
So, in my view, let it Cross & Sustain 11.25
for further Upside towards 12.50 - 13 initially.