EURUSD | ABCD Chart PatternBullish AB=CD pattern is formed on currency pair EURUSD and now the trend will be reverseded from from D to bullish if green candle pattern formed.
Abcdchartpattern

Perfect automated detection of AB=CD pattern & 3Drive PRZ -ShortAfter A Bearish-type AB=CD pattern occurs and rebounds, 3Drive pattern is expected to occur when the price rises again to 1.5229.
There is also a resistance zone of 1.522-1.525.
Short after 3Drive pattern generation and seeing the rebound.
*Harmonic patterns and support/resistance zones are automatically detected using the indicators below.
- Harmonic auto-detect PRO
- Support/Resistance Zone Auto PRO

Ninja!!All the way to $143.xx. FIBO on 1D Time frame.. ABCD pattern to the $143.xx Mark.
"not a fin advisor"

ETHEREUM - 2000 or 700?COINBASE:ETHUSD seems to be in the final stages of this correction.
It mightve already topped out if we look at the Monthly AI or there could be one more high up towards 2000 to complete multiple patterns and the 382 from the April 3 High.
Weekly AI has a High/Low late on the 9th of August. Keep an eye out for this to play out. If we are at a high then we will look for short opportunities and if its a low we will look for longs.
A different look at the market. I hope this helps. Enjoy the week. 👍👍

BTC ab=cd will complete around $26700#BTC/USDT
$BTC broke out from descending trend line and confirmed the support zone as resistance.
🐮 The next resistance zone is between $24100 and $24700, and if price going to complete AB=CD pattern it will increase more toward ascending trend line around $26700.
🐻 break down from support zone and descending trend line will invalid this scenario.

GBPJPY: AB=CD Harmonic Possible?GBPJPY: Market is reacting off a resisting zone and hitting 61.8 fib level, we could be looking at a potential AB=CD harmonic structure forming, I'm expecting a push to the downside since we got a break of local bullish structure.

ETH/USD - 1H - SetupETH/USD is in a bullish trend on 1H and bearish trend on 1D . The price action is currently testing an important resistance zone with a confluence of:
Falling Resistance (1D)
Horizontal Resistance (1D & 1H)
Bearish Candlestick pattern
AB=BC harmonic pattern
Fib being respected between 23% and 50%
Expecting bears to push prices lower towards 50% Fib.

USDTRY | ABCD Chart PatternBearish AB=CD pattern is formed on currency pair USDTRY 4hr frame and now the trend will be reversed from D to bearish pattern .

EURJPY | ABCD Chart PatternBullish AB=CD pattern is formed on currency pair EURJPY 4hr frame and now the trend will be reversed from D to bullish pattern.

EUR USD Bullish Idea based on three patternsEUR/USD
Bull Run seems coming as the following three patterns are all inclined towards a bull run:
1- Cup and Handle.
2- Bullish Flag.
3- ABCD.
The take Profit has been set on the lowest of the projections of all of the three patterns to remain at a safer size while the Stop Loss has been set according to the Dow's Higher low.

Week07 - EURJPY | ABCD Chart PatternBullish AB=CD pattern is formed on currency pair EURJPY 1hr frame and now the trend will be reverseded from from D to bullish if green candle pattern formed.

Week07 - EURAUD | ABCD Chart PatternsAB=CD pattern is formed on currency pair EURAUD 1hr frame and now the trend moving towards point D at bottom and from there trend will be reversed.

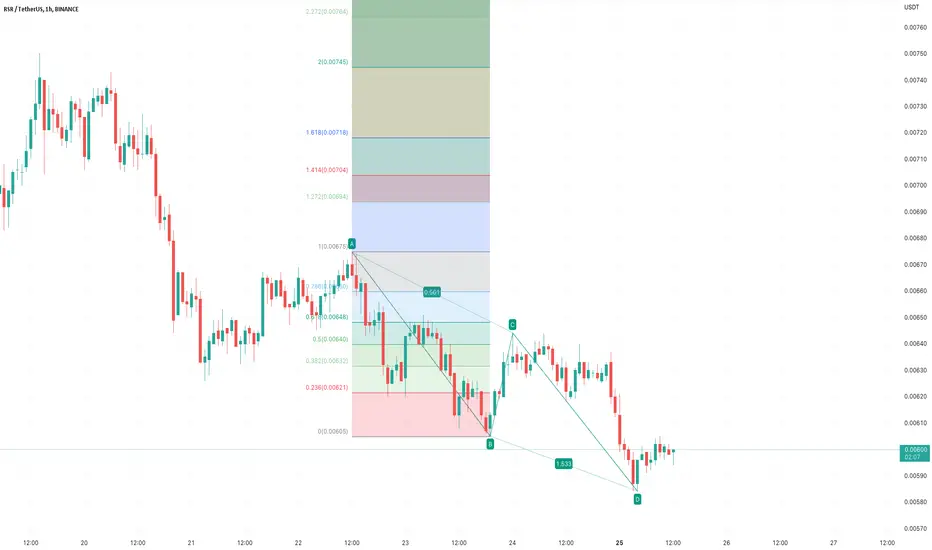
Week07 - RSRUSDT | Bullish ABCD Chart PatternsBullish AB=CD pattern is formed on crypto pair RSRUSDT 1hr fame and now the trend is reverse after forming point D at bottom.
GlenmarkHello and welcome to this analysis
Glenmark after consolidating near its monthly support attempted a fresh upmove from 350 to 400, Post that it has made a sideways corrective forming a Bullish Harmonic ABCD.
The current reversal from 375 could be a higher low of the new uptrend in it and it could rally till 410-425-450 as long as it does not breach 374. Confirmation if it sustains above 390.
Good risk reward set up scenario of a higher low formation which could lead to a higher high thereon till its falling trendline

Ultimate lowrisk EURUSD Shortsetup Keep it simple. Using Harmonic patterns.
The 1.02 mark is an absolutly strong resistance area, look at all the harmonic legs that are leading to the 1.02 mark. Because of this, this is a low risk profile short setup. There are different scenarios. For instance It can go immediately to that mark and create a wick, -or it can trade in a trading range above the mark and then fall back below and retrace from that level, before a potential pullback or reversal. Harmonic moves can be beautiful folks,
This is a beautiful low risk short setup!
𝘼 𝙡𝙞𝙠𝙚 𝙖𝙣𝙙 follow 𝙬𝙤𝙪𝙡𝙙 𝙗𝙚 𝙖𝙥𝙥𝙧𝙚𝙘𝙞𝙖𝙩𝙚𝙙!
Thank you and have a good one

USD/ZAR at Resistance and Bearish AB=CD & Butterfly PatternSell Now Or Sell After Bearish Candlestick Pattern.
Always Use Risk Management And BreakEven Technique To Your Ideas.
SL = 18.23000
TP1 = 15.78000
TP2 = 14.86000
Are You Agree With My Trading Plan?
Good Luck & Trade With Care.
ForexCityPK

WOO broke out potential to increase more than 60%#WOO/USDT
$WOO broke out from long term descending trend line and confirmed it as support.
🐮 holding above this support will increase price to $0.3 to complete AB=CD pattern.

ETHEREUM | BULLISH REVERSALEth has completed its harmonic pattern of AB=CD at the 850 - 900 region. The price immediately bounced from the level and is holding above it.
According to the pattern, Eth has completed its downside and the bottom has been defined. A bullish reversal from here is insight.
Trade your levels accordingly.

Bullish ab = cd NZDUSDAlthough price is on a heavy down trend, I've noticed that price is holding down the low. Upon this level of support, I've spotted a bullish ab = cd pattern, one that may reset the trend.

DOGE fib levels #DOGE/USDT
$DOGE touched the 0.5 fib level of last swing high, and price is above ascending trend line.
🐮 holding the ascending trend line as support can increase price to 2 fib level to complete AB=CD pattern.
🐻 break down from ascending trend line will drop price to 0.618 and maybe lower fib levels.

TATA STEELHello and welcome to this analysis on TATASTEEL
After a v sharp decline in MAY-JUNE the stock has now formed and reversed from the PRZ of a Bullish Harmonic ABCD
As long as it sustains above 840 it can do a pullback to 925 and 1000
Risk Reward good for longs

GBPUSD > Strong Key Level for Short.Analysis of #GBPUSD
GBPUSD has a strong structure resistance level near 1.65500-1.2700 which will represent a strong place to sell GBPUSD.
if the market actually comes and tests my structure resistance zone it will also complete AB=CD bearish harmonic pattern which can be used to enter sell if the rules for entry are met
________________________________________
💭 | Comment your thoughts below, I always answer.
📥 | Feel free to message me if you have any questions.
Thanks for your continued support!

