The level to sell JPN225 is33,300 based on our charts.
Big picture:
1) Daily Trend is down
2) H4 is down
3) Trend Line hitting on H4
There is a M5 pattern to sell this pair. It is currently showing weakness and we will monitor for an entry close to 33,000
Abcdchartpattern

Bullish on All Time Frames.Bullish on All Time Frames.
Monthly Closing above 211 - 212 would
be very positive for OGDC.
Retested the Previous Breakout Level
around 194 - 195.
Hidden Bullish Divergence on Daily Tf.
227 - 228 is the Weekly Resistance that
seems to break this time.
If this level is Sustained, we may witness
250+ initially.

What Is an ABCD Pattern, and How Can You Use It in Trading?What Is an ABCD Pattern, and How Can You Use It in Trading?
Are you looking to improve your trading strategy and technical analysis skills? The ABCD trading pattern may be just what you need. This tool may help you identify potential market reversals and decide when to enter a trade. Keep reading to learn more about the ABCD pattern and how to apply it to your trading strategy.
What Is an ABCD Pattern?
The ABCD pattern is one of the basic harmonic patterns. It gives traders an idea of where the market might reverse. Therefore, when combined with other forms of technical analysis, it may be a great addition to your trading arsenal.
The ABCD pattern comprises two legs, AB and CD, and one retracement, BC, with D as an entry point. More specifically, an ABCD can be identified by:
- AB Leg: A trend starts at A and makes a high or low at B.
- BC Retracement: The price retraces from B to C.
- CD Leg: The trend continues from C to D.
- D Entry Point: Once another high or low forms and traders enter at D.
These price movements create the “zig-zag” or “lightning bolt” shapes.
In fact, ABCD patterns are present across every market and every timeframe. The up-down movements in financial assets represent opportunities to identify and trade ABCD patterns.
Why Use the ABCD Pattern in Your Trading Strategy?
Before we move on to identifying and trading the ABCD pattern, it’s worth explaining why you might want to consider using it. Here are a few reasons traders favour the ABCD pattern:
- It’s one of the harmonic patterns suitable for traders of all experience levels.
- It’s versatile and works for stocks, commodities, and cryptocurrencies*, not just forex trading.
- Traders use ABCD patterns to make informed decisions about potential turning points in the market.
- It can form the basis of a working trading strategy if used correctly alongside other forms of technical analysis.
- It provides quite an effective risk/reward ratio if reversals are caught.
How Traders Identify an ABCD Trading Pattern
The first step in finding ABCDs is to look for that classic zig-zag shape. Once you’ve found one, it’s time to apply Fibonacci ratios to confirm the pattern. If you’re struggling, you can consider using pre-made ABCD pattern indicators or scanners to help your eyes get used to spotting them.
The ABCD pattern requires that the BC leg is between a 38.2% to 78.6% retracement of AB, ideally between 61.8% and 78.6%. This means that if you put a Fibonacci retracement tool at A and B, C should be between 0.382 and 0.786.
The second CD leg should be a 127.2% to 161.8% extension of the BC retracement. For extra confirmation, consider specifying that AB is equal to the same length as CD.
While it can be tempting to start trading based on these conditions, you’ll find that, in practice, identifying point D can be trickier than it seems. That’s why traders typically use Fibonacci ratios, key levels, candlestick patterns, and higher timeframe convergence to confirm their entries, which we will touch on shortly.
ABCD Pattern Examples
Now that we understand how to identify the ABCD pattern, we can start applying it to real price action.
Note that the ratios won’t always be perfect, so allowing for slight variability above or below the defined ratios is acceptable.
Bullish ABCD Pattern
For a bullish formation, the following must be present:
- The AB leg should be between the high A and low B.
- The BC bullish retracement should be between the low B and high C, which is below the high A.
- The CD leg should be between the high C and low D.
- BC is a 38.2% to 78.6% retracement of AB, preferably between 61.8% and 78.6%.
- CD is a 127.2% to 161.8% extension of BC.
Additionally, you may look for AB to be an identical or similar length to CD.
Entry: Traders set a buy order at D.
Stop Loss: The theory suggests traders place a stop below a nearby support level or use a set number of pips.
Take profit: Traders place take-profit orders at the 38.2%, 50%, or 61.8% retracement of CD or hold for higher prices if they believe there’s the potential for further bullishness.
Bearish ABCD Pattern
The bearish ABCD chart pattern is essentially the same, just with the reversed highs and lows. As such:
- The AB leg should be between the low A and high B.
- The BC bullish retracement should be between the high B and low C.
- The CD leg should be between the low C and high D.
- BC is a 38.2% to 78.6% retracement of AB, preferably between 61.8% and 78.6%.
- CD is a 127.2% to 161.8% extension of BC.
You can choose to apply the same AB = CD rules in a bearish ABCD pattern if desired.
Entry: Traders typically place a sell order at D.
Stop Loss: A stop may be placed above a nearby resistance level or at a set number of pips.
Take profit: Traders often take profits at the 38.2%, 50%, or 61.8% retracement of CD or hold for lower prices if there’s a bearish trend on a higher timeframe.
ABCD Pattern Strategy
A momentum-based ABCD trading strategy can help traders confirm potential reversals by incorporating indicators like the RSI (Relative Strength Index). This approach often adds an extra layer of confluence.
Entry
- Traders may wait for point D to form and for the RSI to indicate overbought or oversold conditions, typically above 80 or below 20.
- Additional confirmation can be sought if there is a divergence between price and RSI, signalling weakening momentum.
- Once the RSI crosses back into normal territory, it can suggest a reversal, providing an opportunity to enter the market.
Stop Loss
- A stop loss is often placed slightly above or below point D, depending on whether the formation is bearish or bullish, respectively. This helps potentially manage risk in case the reversal doesn’t hold.
Take Profit
- Traders can consider taking profits at Fibonacci retracement levels of leg CD, such as 38.2%, 50%, or 61.8%.
- Another common target is point C, but traders may also hold the position for longer if further price movement is anticipated.
Looking for Additional Confluence
Given that trading the ABCDs usually relies on setting orders at specific reversal points, consider looking for extra confirmation to filter potential losing trades. Below, you’ll find three factors of confluence you can use to confirm your entries.
Key Levels
If your analysis shows that D is projected to be in an area of significant support or resistance, there’s a greater chance that the level will hold and the price will reverse in the way you expect.
ABCD Timeframe Convergence
One technique to potentially enhance the reliability of ABCD chart patterns is to check for multiple timeframes. When you identify the formation on a lower timeframe—say, the 5-minute chart—you can then look to a higher timeframe chart, such as the 30-minute or 1-hour chart to see the overall trend.
If the pattern converges with the longer-term trend, it strengthens the analysis and increases the likelihood of an effective trade.
Candlestick Patterns
Some traders look for particular candlestick patterns to appear. The hammer and shooting star patterns are commonly used by ABCD traders for extra confirmation, as are tweezer tops/bottoms and engulfing candles. You could choose to wait for one of these candlesticks to form before entering with a market order.
Common Mistakes to Avoid When Identifying an ABCD Chart Pattern
Of course, ABCD patterns aren’t a silver bullet when it comes to effective trading. There are several common mistakes made by inexperienced traders when trading these types of patterns, such as:
- Confusing the ABCD with other harmonic patterns, like the Gartley or three-drive pattern.
- Trading every potential ABCD formation they see. It’s preferable to be selective with entries and look for confirmation.
- Not being patient. ABCDs on higher timeframes can take days, even weeks, to play out.
Experienced traders wait for the pattern to develop before making a trading decision.
- Ignoring key levels. Instead, you could allow them to guide your trades and look for the ABCD pattern in these areas.
The Bottom Line
The ABCD pattern is a versatile tool that can enhance a trader’s ability to identify potential market reversals and refine their overall strategy. When combined with other forms of technical analysis, such as momentum indicators, an ABCD trading strategy can be an invaluable addition to your trading arsenal.
For traders looking to apply the ABCD pattern in forex, stock, commodity, and crypto* markets, consider opening an FXOpen account and take advantage of low-cost, high-speed trading across more than 600 assets. Good luck!
FAQ
What Is an ABCD Trading Pattern?
The ABCD trading pattern is a simple harmonic pattern used by traders to identify potential market reversals. It consists of three price movements: the AB leg, BC retracement, and CD leg, with point D marking a potential entry for a reversal trade. It helps identify changes in trend direction.
How Can You Use the ABCD Pattern in Trading?
Traders identify the ABCD pattern by finding the characteristic zig-zag shape and using Fibonacci ratios to confirm it. Entry points are typically placed at point D, with stop losses and profit targets based on the formation’s structure. Confluence with other technical analysis tools improves its reliability.
Is the ABCD Pattern Bearish or Bullish?
The ABCD pattern can be either bearish or bullish. A bullish ABCD indicates a potential upward reversal, while a bearish ABCD suggests a downward reversal. The structure remains the same, but the highs and lows are reversed.
What Is the ABCD Strategy?
The ABCD strategy revolves around identifying trend reversals using the formation and confirming entry points through tools like Fibonacci retracements or momentum indicators like the RSI for added accuracy.
*At FXOpen UK, Cryptocurrency CFDs are only available for trading by those clients categorised as Professional clients under FCA Rules. They are not available for trading by Retail clients.
This article represents the opinion of the Companies operating under the FXOpen brand only. It is not to be construed as an offer, solicitation, or recommendation with respect to products and services provided by the Companies operating under the FXOpen brand, nor is it to be considered financial advice.

No Bearish Divergence so far.No Bearish Divergence so far.
Monthly Closing above 392 would be
a Healthy sign.
It will close as a Morning Star.
On Daily TF, 430 - 435 can be touched easily.
but the real story will start once 465 is
Crossed & Sustained; it may then 500+

Bullish on Bigger Time Frames.Bullish on Bigger Time Frames.
Immediate Resistance is around 126 - 127.
Potential to touch 200 is 127 is Sustain on
Monthly Basis.
On the flip side, 101 - 111 is the Support level
(if it takes pressure now.
Now it should not Break 89.

Still BullishRetested the Previous Breakout Level
around 37 - 38.
Immediate Support is around 46 - 46.50 now.
Monthly Closing above 48.20 would be
very healthy sign; targeting around 55.
& then around 60.

Bearish Divergence has started appearing but...Bearish Divergence has started appearing
on Weekly TF but not yet on Monthly, so
a pressure might be seen around 116 - 117.
& Sustaining this level will expose 135 - 138 targets.
On the flip side, 101 - 109 may act as a Good
Support zone in case of pressure.

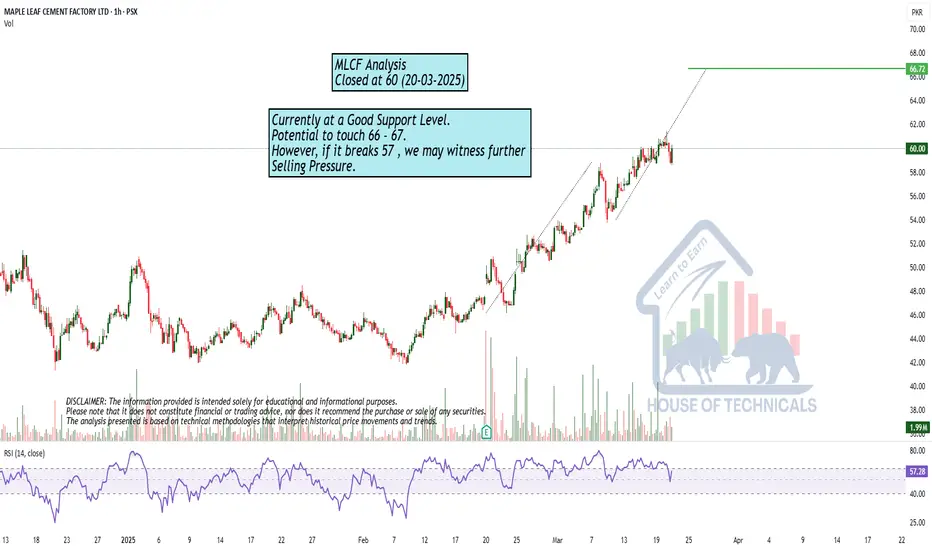
at Important Support LevelCurrently at a Good Support Level.
Potential to touch 66 - 67.
However, if it breaks 57 , we may witness further
Selling Pressure.
BTC time cycle analysis for the next cycle topBTC time cycle analysis for the next cycle top
1. Blue line is the time period in which the previous cycle top breaks ( appox 1050 days )
2. Red line is the time period in which btc make a new top after that breakout ( appox 350 days )
3. White line is the time period of the cycle low to the top ( appox 1010 to 1060 days )
4. Yellow line is the time period after the halving btc defines the top ( appox 525 days )
5. Fib extension tool level 1.618
6. AB=CD pathern
As we can see history repeats itself btc is following this time cycle analysis over the past cycles, So if the history repeats again we can expect the level of (110,000)

CADCHF - Bullish Signals - 99 Percent successful Hit chancesCADCHF Shows Bullish Weights More than Bears !!!!
Bullish Confluences:
1- Bullish Divergence
2- Major Support Level Testing and Breaking
3- LH Broken
4- Bearish Wedge Pattern
5- Sentiments of Long are > 90 percent
6- Completion of AB=CD pattern
TRADE PLAN :
Enter into the market at Current market price and take profit on defined FIB level as TP1 TP2 and TP3
STOP LOSS below LL

ABCD Pattern appearingImportant fib level tested.
ABCD pattern appearing but not
yet confirmed.
Should not break 15 on Closing basis.

Recently made LL on Shorter TF, but..Recently made LL on Shorter TF,
but also it is a Support level with Double Bottom.
Hidden Bullish Divergence on Daily TF.
Immediate Support lies around 86 - 89
& Immediate Resistance is around 91 - 92.
Sustaining 91 - 92 on Weekly TF, would
lead it towards 98 - 99.
Ultimate Target (if 109-110) is Sustained,
is around 128 - 130.
Should not break 81 now.

Monthly + Weekly View
If Monthly Candle closes above 95, it would
confirm a Morning Star Formation which is a
Positive Sign.

Important Support level159 - 163 would be a Very Good Support Level
as this Support is of Monthly TF. So Patient Traders /
Investors may wait for this level; which seems bit
difficult (as of now) due to Bullish Divergence on
Shorter TF.
180 - 185 is an Important Resistance.

Good Financial Results.169 - 175 can be a Good Support Area.
Better Financial Results.
Should not Break 162 even in Worst Cases.
Crossing 180 may lead it towards 190 - 193.

Perfect ABCD Pattern on Weekly TF.Perfect ABCD Pattern on Weekly TF.
161 - 165 is a Good Support now.
Next Important Support level is around 143 - 145.
Company Directors' are themselves buying this
share @ around 171.

XAUUSD SellTrade Analysis
Harmonic Pattern: ABCD is forming. C point retracement is 0.641, which is near 0.618.
Divergence: Confirmed.
Key Level: Currently at 1H resistance.
Trade Plan
📌 Entry: 2877.320
🛑 Stop Loss (SL): 2898.080
✅ Take Profit (TP): 2856.460

Weekly & Monthly Closing on a Positive Note is Important.Immediate Support is around 355 - 357,
if this level is Sustained on Monthly basis,
we may witness further upside around 400.
However, the monthly candle is not yet closed.
Weekly candle closing above 357 - 360 may confirm
a Morning Star Formation which will be a Positive Sign.
Strong Resistance is around 400 - 415.
Crossing & Sustaining 490, may lead it towards 600.

$GBPUSD Potential Retracement Following Symmetrical AB=CDPEPPERSTONE:USDCAD
The pound has just completed the AB=CD pattern on the 4-hour chart, precisely at 1.2671, a level I highlighted back on February 13. With this textbook pattern now fulfilled, a retracement could be in play, potentially sending the pair lower toward key Fibonacci retracement zones below 1.2541.
This move also aligns with a possible retest of the broken daily fractal resistance at 1.2550 , a level that played a key role earlier this week. If sellers step in with conviction, the cable could face a broader pullback, but sustained downside pressure will depend on the market’s reaction at these critical support levels.
📉 Key Technical Takeaways:
✅ AB=CD pattern completed at 1.2671, signaling potential exhaustion of bullish momentum.
🔄 Possible retracement targeting Fibonacci levels below 1.2541.
⚠️ 1.2550 daily fractal resistance, which was broken earlier this week, could be retested as new support or fail to hold.
Will GBP/USD follow through with a correction, or will buyers defend these zones? Let’s see how this plays out! Drop your thoughts below. 👇
Happy Trading,
André Cardoso
Risk Warning: Trading financial assets carries a high level of risk and may result in the loss of all your capital. Make sure to fully understand the risks involved before you start trading and carefully consider your investment objectives, level of experience, and risk tolerance. The data and information provided in this content do not constitute financial or investment advice and should not be considered as such. Only invest what you can afford to lose, and be aware of the risks associated with trading financial assets.

A quick buy on FTSE right nowWe are seeing the following on the FTSE
1) H4 is oversold
2) There is H1 divergence
3) 2 patterns at the same level
4) Yesterdays low at 8648
5) Daily trend is up
This is likely to be a quick trade as there is huge resistance at 8685. We may turn short if needed.

Beautifully making HH HL on Monthly TF.Beautifully making HH HL on Monthly TF.
However, Bearish on Daily TF.
a Perfect Example of Bearish ABCD Reversal Pattern,
Touched Point D & Reversed.
Now, either it should close above 1520 on Monthly basis
for a positive move probably upto 1600+
else,
the selling pressure may bring it to the Next Support
around 1300 - 1365.
In worst case, it may touch 1140 - 1145.

ABC Correction perfection A Beautiful ABC pattern
Lines up perfectly with :
- Previous range Point Of Control
- Previous month Value Area Low
- A Daily Naked
- The 1 to 1
- Global Swing Low Avwap
Elliot wave theory
I expect early next week being hit. Then target the highs for a wyckoff distribution pattern.
People are already positioning EU swing longs, without a spring.
We need to punish dem early bulls 🏌️♀️
CAPITALCOM:DXY OANDA:EURUSD CME:6E1! ICEUS:DX1!

S&P 500Hello & welcome to this analysis
The index has entered into the potential reversal zone (PRZ) of a Bearish Harmonic ABCD pattern suggesting a higher probability of completion of an uptrend and likely reversal.
The likelihood of reversal confirmation would require it to start sustaining below 5900 on weekly basis since this is a pattern formed in the monthly time frame.
Harmonic Patterns are based on unique structures backed by specific Fibonacci ratios.
Regards
