#USDCAD: Two Major Buying Zones, Patience Pays! As previously analysed, USDCAD is expected to decline towards our predetermined entry point. We anticipate a bearish US Dollar for the remainder of the week, which will ultimately lead USDCAD to reach the entry zone. Three distinct target areas exist, collectively worth over 1100 pips. Each entry point, stop loss, and take profit is clearly defined.
We wish you the best of luck and safe trading.
Thank you for your support.
If you wish to assist us, we encourage you to consider the following actions:
- Like our ideas
- Provide comments on our ideas
- Share our ideas
Kind Regards,
Team Setupsfx_
Much Love ❤️🚀
AB=CD

SYRUP Bounces from Confluence Zone – Bullish Continuation?SYRUP bounced cleanly from the confluence zone — where trendline and support aligned. Bulls stepped in fast.
As long as it holds above trendline, upside continuation is likely.
Wait for retest or structure before chasing.
DYOR, NFA

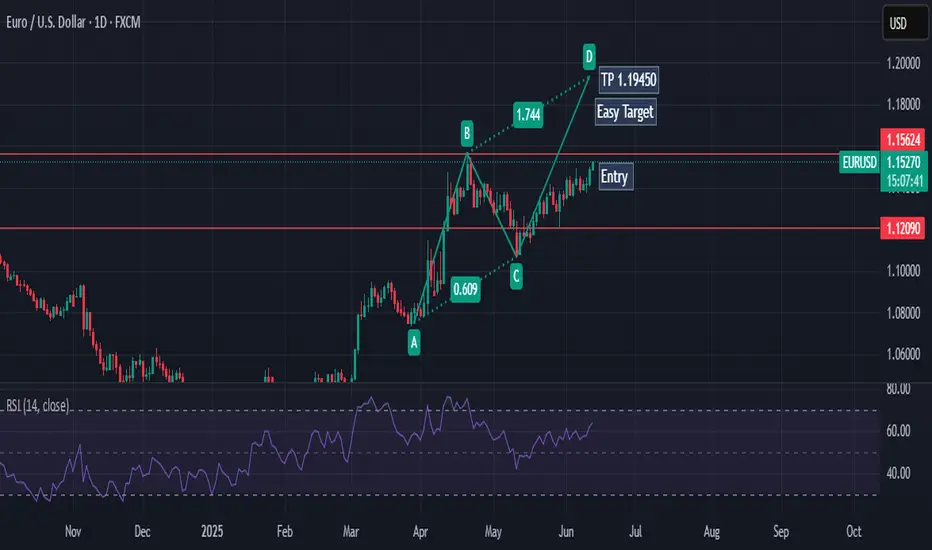
#EURAUD: Two Swing Bullish Entry Worth Thousands Pips! EURAUD is currently at a critical level, and the price isn’t yet decided for the next move. However, the current price behaviour suggests strong bullish volume presence in the market. There are two areas to buy from. The first is activated, and we think price could just be starting the next bull run from this point. The second entry is a safe point if price does decide to drop further and fill up the daily Fair Value Gap.
We wish you the best in trading.
If you want to support us, you can do the following:
- Like the idea
- Comment on the idea
- Share the idea
If you have any questions or concerns about the analysis or trading in general, please let us know in the comment box.
Team Setupsfx_
❤️🚀

S&P 500 (SPX) 1M next week?The S&P 500 is pulling back from a key resistance after completing a bearish AB=CD pattern on the monthly chart. Price action suggests a potential correction toward the 4662–4700 zone, aligning with the 0.618 Fibonacci retracement level, which may serve as a key area for bullish reaccumulation. Momentum indicators show bearish divergence, hinting at a cooling rally.
Fundamentally, the index remains supported by strong earnings in tech and AI sectors, but risks persist from elevated interest rates, sticky inflation, and potential Fed policy shifts. A pullback into the 4662–4700 zone may offer a medium-term setup for continuation toward 5198 and potentially 5338. A breakdown below 4662 would invalidate the bullish structure and shift focus to lower Fibonacci levels.

EURJPY: A Big Move In Making, Please Share Your Views! Date: 22/06/2025
Hello everyone,
I hope you’re all having a good weekend. As we previously discussed, we expected a sharp decline in Europe/JPY, but unfortunately, it didn’t work out in our favour due to the extremely bullish US dollar. This led to the crossing and invalidation of our two selling zones.
Looking at next week’s price projection, we can confirm that the price is heading towards 170.50 and may be selling at this level. Therefore, we will be keeping a stop loss at 171.50.
Once the trade is activated, we can set our target at 166.0, 163.50, and the final target will be placed at 158.50.
If you like our work, please like our idea.
Good luck and trade safely next week.

Impact on the Dollar and Forex — Artavion AnalyticsThe development of central bank digital currencies (CBDCs) — especially the digital yuan (e-CNY) — is becoming a key factor in transforming global currency flows. While the US dollar still dominates, the architecture of global liquidity is beginning to shift.
At Artavion, we see the e-CNY not just as a technological experiment but as a tool of China’s currency policy. Its goal is to strengthen the yuan’s role in international settlements and reduce dependence on the dollar, particularly in developing regions.
Why the Digital Yuan Matters
The e-CNY is already being used in China for retail payments and is being tested in cross-border transactions (e.g., in the mBridge project with the UAE and Thailand). This enables the creation of alternative payment systems not tied to SWIFT.
If the digital yuan gains broader acceptance, especially for commodity and energy settlements, its role in forex will grow, potentially weakening the dollar’s monopoly in certain regions.
CBDCs and Forex Structure
CBDCs won’t displace the dollar in the near term, but they are already influencing the structure of currency trading:
New currency pairs are emerging, especially in Asia;
Transactions are becoming faster and cheaper, particularly in the B2B segment;
Market participants are adjusting strategies to real-time settlements and the potential programmability of currencies.
Risks and Limitations
Privacy: CBDCs are under full state control;
Fragmentation: There is no unified technical standard across different countries’ CBDCs;
Geopolitics: The rise of the e-CNY could intensify currency competition with the dollar.
Artavion’s Conclusion
The digital yuan will not replace the dollar, but it is creating an alternative — especially in regions seeking autonomy from Western financial infrastructure. For traders and investors, this means reassessing currency risks and exploring new opportunities in decentralized settlement channels.

ETH Forming Bullish AB=CD Pattern | Eyes on Breakout #Ethereum (ETH) is showing strong bullish momentum on the 4H timeframe and is currently developing a classic AB=CD harmonic pattern, which often precedes a continuation of trend.
✅ Key Observations:
#ETH is holding within a solid uptrend structure
No signs of bearish divergence or reversal patterns yet
Momentum remains healthy, with buyers in control
🔍 What to Watch For:
We are closely watching the previous Higher High (HH) — currently acting as a key resistance level. A 4H candle close above this level will serve as confirmation for the continuation of the bullish trend.
📈 Trading Plan:
Once #ETH breaks above the resistance and confirms with a close, we’ll look to enter a long position with proper risk management and stop-loss placement below recent structure.
💬 What’s your bias on #ETH in the short term? Are you already long, or waiting for the breakout too?
📌 Don’t forget to Like, Comment, and Follow for more clean setups and strategy-based analysis!
#ETH #Ethereum #CryptoTrading #ABCDPattern #TechnicalAnalysis #Harmonics #TradingSetup #Breakout #PriceAction

KAITO Waiting For ExtremesBINANCE:KAITOUSDT The bounce from $1.50 didn’t deliver the upside follow-through — now price is heading toward the equal legs zone at $0.97–$0.77.
As long as the April low holds, this area could attract buyers for another attempt higher. But if it breaks, we may be looking at a deeper correction.

Bittensor Step-by-Step Process🧠 BINANCE:TAOUSD has entered the #BlueBox buying area at $302–$214, where the bottoming process is expected to begin. This zone aligns with the typical equal legs fib cluster setup is a high-probability region for bulls to step in.
Now it’s all about strategy:
🔹 Aggressive bulls might start scaling in here
🔹 Conservative traders may wait for reversal confirmation — like a break of internal trendlines or bullish divergence on lower timeframes
Either way, the groundwork for the next rally could be forming.

Solana Next Buying Zone on WatchCRYPTO:SOLUSD is correcting the 5 waves advance from April low within a 3 waves ZigZag structure and as price slipped to a new marginal low beneath last week’s support, signaling potential weakness toward equal legs area$122 - $111 before buyers look to step in again.
Keeping an eye on reactions in this zone—could set up for a bullish reversal once demand kicks in!

FARTCOIN Loading The BeansCRYPTO:FARTCOINUSD after the initial bounce failed, the correction against the March low is still unfolding within a 3-swing Zigzag, targeting the equal legs zone at $0.75–$0.57 — where bulls are expected to step in for the next blast higher.
Load the beans!! Time to fart!! 💨

VADER Enters Buying AreaDon’t Sleep on MEXC:VADERUSDT
It's currently in the process of doing a 3 waves pullback to correct the previous cycle and it reached the $0.044–$0.032 equal legs zone.
A bullish reaction could kick in next week — eyes open, structure’s still in play.

BTC is expected to give move by mid or end of July 2025BTC is expected to make a move by mid or end of July 2025
BTC is forming a Bullish Flag Pattern, and it is expected to give a breakout from this flag, by mid or end of July.


Boeing (BA): Watching for a Break Above 218.80NYSE:BA has a strong chance of breaking above the 218.80 level , with a potential move toward 221.98 .
I plan to enter 1 tick above 218.80, with a stop-loss based on the 5-minute ATR (period 10).
🔍 Technical Outlook:
BA is currently moving within an upward ABCD channel. The projected upside is capped by a strong resistance zone at 221.98 – a level derived from the daily chart and previous price action. The market may or may not react to it, but it’s a logical target within a solid risk-to-reward setup.
One aspect I particularly like about this setup is the market’s inability to close significantly below the previous pivot high at 215.80. This suggests underlying strength. If we see a confident move above resistance, the trade could be triggered with momentum.

AMZN: Watch for a Break Above 218.00If NASDAQ:AMZN manages to push above 217.85 , there's a strong chance we’ll see a move toward 219.96 . However, caution is advised around the 218.00 level – both premarket and postmarket sessions showed hesitation and failed to hold above that resistance.
A more conservative approach would be to wait for a clean break above 218.00 before entering.
🔍 Context:
We’re currently in a solid uptrend. On the daily chart, we’ve seen a rejection of the downside, marked by an inside bullish candle with a notable wick – suggesting upward pressure that the market may try to release. Given recent premarket activity, the 218.00 area remains a key battleground for bulls and bears alike.

Pudgy Penguins PENGU Gearing Up for a +100% Move! 🐧 BINANCE:PENGUUSDT has completed its 5-wave advance from the April low (wave 1) and corrected with a 3-wave Zigzag structure in wave (2), reaching the buying area at equal legs $0.009 - $0.008.
🚀 Now, it's setting up for wave (3) higher, with an initial target at $0.022.
🌊 Are you positioned to catch the next wave higher?

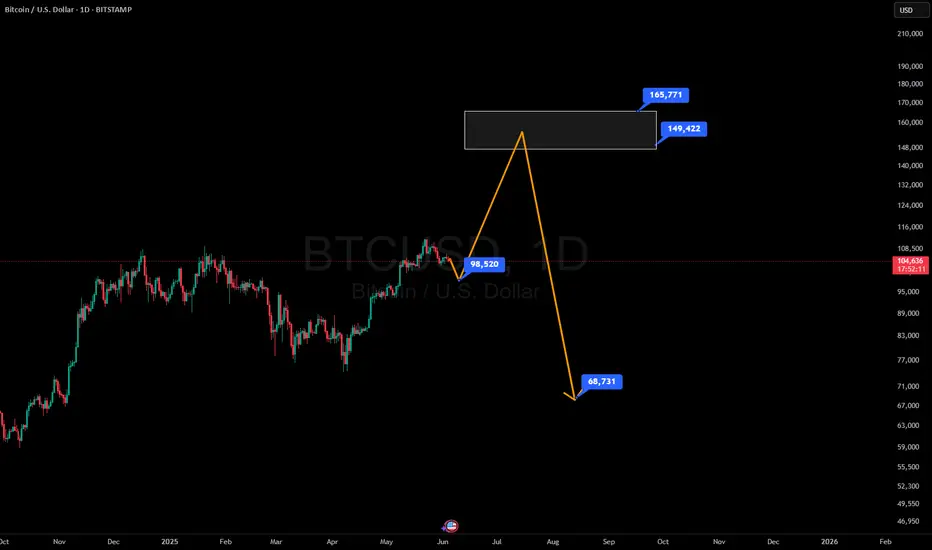
BTCUSD analysis for this cycle TopBTCUSD analysis for this cycle Top
1. According to the Elliot wave it is the 5th wave of elliot theory
2. As per the time cycles Btc should define the top in the last quarter of this year possibility in (oct or nov)
3. And for the projection as always the Btc favourite patthen AB=CB is also in play.
4. Fib extension tool level 1.618
So as we can see if btc will play according to this analysis. As its always follows this same things again & again in all cycle. So we can expect the top somewhere around (165,000).

#USDCAD: 500+ Pips Big Buy Opportunity!Dear Traders
Hope you are doing great, we have a great buying opportunity on USDCAD, our first entry is in profit of 250+ pips, however, we expect price to grow steadily after reconfirming the same area. USDCAD tends to reconfirm the order block area many times before a big bull move. Good luck.

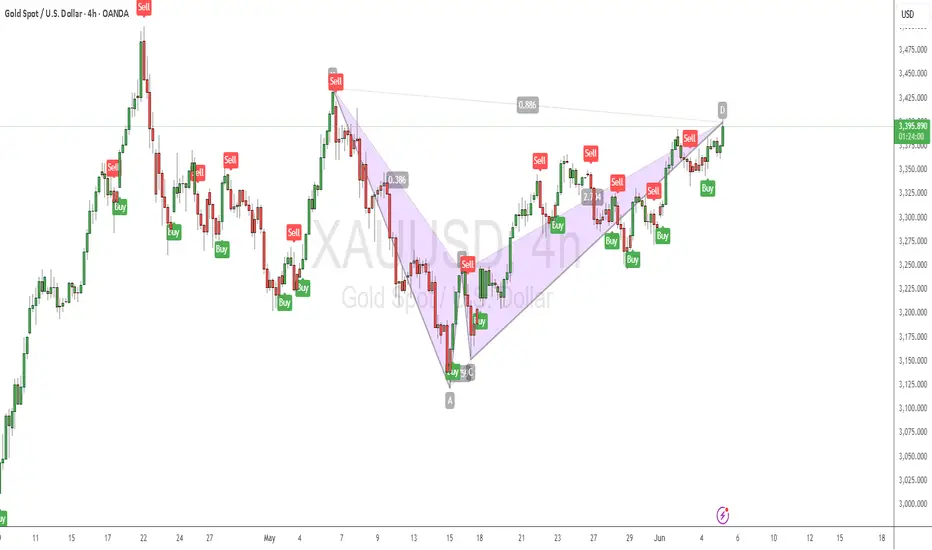
Gold Bearish BAT Pattern?As shown in the chart, Bearish BAT pattern formed
Also in the smaller timeframe, AB=CD formed
I would suggest that you wait for the closing of the H4 Candle first.
I am looking for a liquidity sweep here in the smaller time frames to enter
for more info, slide to my DM's
#GoodLuck
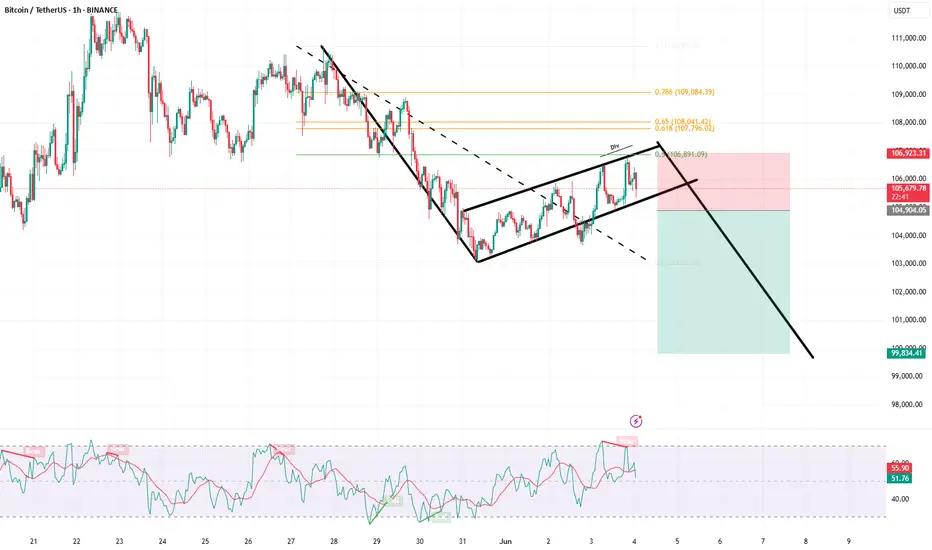
BTCUSDT is following flag PatternBTCUSDT is following a flag Pattern, it has also given a retracement of the 0.5 fib level.