EURNZD: Second Entry Worth Possible 500 Pips: what do you think?Hey Everyone,
EURNZD with our first buying entry that we had posted that turned out to hitting our Take Profit area, now we are expecting the same similar movement. Price has formed AB=CD pattern. In this scenario, price most of the time create a opposite big movement in our case it can give us a nice bullish impulse, helping us to gain 500 pips at least. There are two entries, first one with a greater risk and second entry is much safer, it is up to you which one to take.
AB=CD

Potential Spring (tight ABCD) in FTSETIght ABCD which I call a Spring happens from a previous support level.
Also, the level of the reaction we observe is a small gap which is an area of interest where price tends to go.
Weekly is above 20 EMA, Daily as well. Stochastics is in the overbought zone as well.
Now a positive entry bar is needed to confirm the entry.

#EURNZD: Update 26/02/2024EURNZD as we explained in our first chart that AB=CD pattern is in process, that turn out to be true. Price rejected and bounce back from POINT 'D' now that price has rejected and breakthrough a consolidated region. We expect price to grow steadily with enough volume coming in New York session. Use the stop loss as described in the chart.
Good Luck and Happy Trading.

GBPJPY - Sell StopBearish Divergence shows the momentum of Bulls is getting low and a possible downward trend is expected.
Bearish Divergence plus an AB=CD pattern formation will reverse the trend.
I have taken two trades of 0.5% each. In this case, if I lose, I'll lose 1% max and if both trades TPs are hit, I'll make 1.5% so the overall reward is higher while at the same time booking the profit with one trade.

BTCUSDT targeting 78500 Hello all
my thought about bitcoin ,, as you see in the chart there is high possibility to go to the target > 78500 .
if we didn't break 54500 .
boost it if you like it .
good luck :)

ICP technical analysis, buy here for the long term!ICP looks very strong from a technical perspective. We can see that we have started this whole uptrend with an impulse wave 12345, which is very good to see if you are an Elliott Wave trader. We are now in a corrective phase, and usually we want to see a liquidity sweep below the previous wave (4). In this case, below 8.5 USDT - that would be a great level to buy ICP for the long term!
What is the Internet Computer and ICP?
The Internet Computer blockchain incorporates a radical rethink of blockchain design, powered by innovations in cryptography. It provides the first “World Computer” blockchain that can be used to build almost any online system or service, including demanding web social media, without need for traditional IT such as cloud computing services. As such it can enable full end-to-end decentralization.
Why Does the ICP token have value?
The ICP token has three main utilities. Firstly, ICP provides a source of “cycles” that are burned to power computation (thus when ICP is converted to cycles, it disappears, creating deflationary pressure). Secondly, ICP can be staked in the permissionless Network Nervous System DAO that governs the Internet Computer blockchain, creating voting neurons that generate voting rewards. Thirdly, ICP plays the role of a store of value, for example allowing users to invest in decentralization sales run by web3 services.

BomeUSDT to 0.04? BOOK OF MEME the new Dogecoin or a Scam? This coin could become a new meme for the future, there will be a sell-off, my assessment is that it still has a lot of potential in a few weeks if not years, no investment advice!
It dumps because people get scared, I'll keep it regardless if it reaches a value of 0.

Tow-Legged, ABCD, Elliott WavesFigure 1.1 has two extreme trends and one extreme trading range. This day began with a strong bear trend down to bar 1, then entered an unusually tight trading range until it broke out to the upside by one tick at bar 2, and then reversed to a downside breakout into an exceptionally strong trend down to bar 3.
Two-legged moves are common, but unfortunately the traditional nomenclature is confusing. When one occurs as a pullback in a trend, it is often called an ABC move. When the two legs are the first two legs of a trend, Elliott Wave technicians instead refer to the legs as waves 1 and 3, with the pullback between them as wave 2. Some traders who are looking for a measured move will look for a reversal back up after the second leg reaches about the same size as the first leg. These technicians often call the pattern an AB = CD move. The first leg down begins with point A and ends with point B (bar 1 in Figure 1.1, which is also A in the ABC move), and the second leg begins with point C (bar 2 in Figure 1.1, which is also B in the ABC move) and ends with point D (bar 3 in Figure 1.1, which is also C in the ABC move).

EWZ May Fall Down to 30.75 - 30.45 in the Medium TermAfter breaking bellow a bearish flag-like consolidation, EWZ reached the contracted objective point at 32.00 in an agreement support zone. Market is now testing the broken line from the downside in a pull back movement. If the broken line can hold the market, EWZ tends to reach the next target in the objective point area at 30.75 - 30.45, which is also an agreement support.

FCPO in uptrend channellooks like the price is following the uptrend channel.
i'm trying to follow the price using elliott wave and abcd pattern.

QKC - 1400% profit in 2024, best time to buy!I am giving you this information in advance! Just before a huge pump that is going to happen very soon. Why? We have a very long accumulation phase by whales on the weekly chart (670-day). Usually, after such a long time, there is a great expectation for such a move. From the Elliott Wave perspective, we have a bullish (1)(2)(1)(2) combo (nest) which is pretty much the dream of every Elliott Wave trader. This coin is definitely something you want to consider, you still have time to do your own research as the price is still inside the accumulation phase. I provide you with 3 profit targets; now it's up to you which one you choose and how long you want to wait for it! Let me know what you think about my analysis, and please hit boost and follow for more ideas. Trading is not hard if you have a good coach! Thank you, and I wish you successful trades.
About QuarkChain
The QuarkChain Network is a permissionless blockchain architecture that aims to meet global commercial standards. It aims to provide a secure, decentralized, and scalable blockchain solution to deliver 100,000+ on-chain TPS. The main features of the QuarkChain Network are:
Flexibility: QuarkChain is a public chain that can support multiple consensuses, multiple transaction models ( including virtual machines VMs), ledger, and token economics in one network. It can reportedly adapt to blockchain innovations by customizing consensus, transaction model (including VM), ledger, and token economics in each shard so that to satisfy different requirements of different industries/enterprises/DApps. The network supports two consensus algorithms, PoW and PoSW ( a combination of PoS+ PoW). More consensus algorithms (DPoS, PoS and etc) will be added into different shards in the future. It is EVM-compatible - every DApp deployed on Ethereum can be deployed in QuarkChain. The team plans to add more virtual machines (e.g. EOS VM) in different shards so that developers have more choices.
Scalability: QuarkChain aims to deliver 100,000+ on-chain TPS. Currently, 55000+ peak TPS has already been achieved in TPS competition held within the community
Decentralization: QuarkChain has a two-layered structure and encourages individual miners with different levels of capability to mine directly without joining mining pools. People can choose to mine either in the root chain or in the shard.
Great Usability: QuarkChain supports Native token which enables each shard to have its own tokeneconomics. It also supports scalable cross-shard transactions. Only one account is required to access entire resources in all shards, and smart wallets simplify the management.
Let me know what you think about my analysis, and please hit boost and follow for more ideas. Trading is not hard if you have a good coach! Thank you, and I wish you successful trades.

Selling EURUSDFollowing market structure
Overall market structure is bullish, however a short term sell opportunities presents itself.

Selling EURUSDFollowing market structure
Overall market structure is bullish, however a short term sell opportunities presents itself.
#BTCUSDT: Heading towards $90,000?Dear Traders,
Our first entry turn out to be successful, now we are eying for second possible entry. Price is extremely bullish and there is very much likelihood that price might not come to area. If it does then it become really a great opportunity to buy swing holding. What is your opinion on this?
comment down below!

Shiba to 0.00004807???? FibIntroduction:
Shiba Inu (SHIB) has captured the attention of cryptocurrency enthusiasts with its recent price movements. In this technical analysis, we'll explore the potential for SHIB to reach the level of 0.00004807 against its trading pair. Utilizing key technical indicators, we aim to provide insights into the possible direction of SHIB's price action.
Analysis:
Support and Resistance Levels: Upon examining the historical price data, we identify significant support at 0.00004200 and resistance at 0.00005000. These levels are crucial in determining the potential movement of SHIB towards 0.00004807.
Moving Averages: The 50-day and 200-day moving averages indicate a bullish sentiment for SHIB, with the shorter-term average trending above the longer-term average. This suggests positive momentum in the short to medium term.
Relative Strength Index (RSI): The RSI currently stands at 60, indicating a neutral stance. However, the RSI has been trending upwards, suggesting increasing buying pressure and potential for further price appreciation.
Fibonacci Retracement: Applying Fibonacci retracement levels to SHIB's recent price action reveals that the 0.00004807 level aligns closely with the 38.2% retracement level. Historically, this level has acted as both support and resistance, adding significance to its potential impact on SHIB's price movement.
Conclusion:
Based on our technical analysis, there is a compelling case for Shiba Inu (SHIB) to reach the level of 0.00004807 against its trading pair. Key indicators such as moving averages, support/resistance levels, RSI, and Fibonacci retracement suggest a bullish outlook for SHIB in the near term. However, traders should exercise caution and conduct their own analysis before making any investment decisions.
Made by AI

33300$ is a IdeaI think it can still lead to a Crash of Blackrock side in 3 month
What is a Crash and then an ascending, it would be the best for people who want to make money

Total Crypto Market Cap up to 3.4T$ ? or 15T???A Future-Oriented Scenario: The Cryptocurrency Market’s Path to $15 Trillion
In a world where the boundaries between the traditional financial realm and digital assets are increasingly blurred, the market capitalization of the cryptocurrency market could first reach a significant milestone of $4 trillion. This landmark could serve as a springboard for further growth spurts, particularly through the integration and backing of established financial giants like BlackRock and their extensive portfolio of iShares ETFs, along with innovative crypto ETFs listed on platforms like CoinMarketCap.
The Role of BlackRock and iShares ETFs
The involvement of BlackRock, the world's largest asset manager, could be a pivotal catalyst for the growth of the cryptocurrency market. By incorporating cryptocurrencies into iShares ETFs, BlackRock would not only appeal to institutional investors but also facilitate access to digital assets for individual investors. These steps would increase liquidity, bolster confidence in cryptocurrencies, and lead to wider acceptance.
Impact of Specialized Crypto ETFs
Specialized crypto ETFs like the ARK 21Shares Bitcoin ETF provide a bridge between the traditional financial system and the crypto world by offering a regulated, transparent, and easily accessible way to invest in cryptocurrencies. Such ETFs could play a crucial role in democratizing access to cryptocurrencies while also boosting the market capitalization through new capital inflows.
A Scenario of Exponential Growth
With backing from leading financial institutions and the introduction of crypto ETFs, the cryptocurrency market could experience exponential growth, potentially reaching the $15 trillion mark. This growth would be driven not just by increased capital but also by technological advancements, enhanced regulatory clarity, and the ongoing integration of cryptocurrencies into everyday financial transactions and services.
Summary
While this scenario highlights the immense growth potentials that could arise from the synergy between traditional financial actors and the cryptocurrency world, it remains speculative and subject to a wide array of risks and uncertainties. The actual development of the cryptocurrency market will be influenced by numerous factors, including regulatory decisions, market sentiment, and technological breakthroughs. Investors should therefore always conduct comprehensive research and seek professional advice before investing in the dynamic and volatile cryptocurrency market.
Made by KI

Shiba to 0.00005222Introduction:
Shiba Inu (SHIB) has captured the attention of cryptocurrency enthusiasts with its recent price movements. In this technical analysis, we'll explore the potential for SHIB to reach the level of 0.00004807 against its trading pair. Utilizing key technical indicators, we aim to provide insights into the possible direction of SHIB's price action.
Analysis:
Support and Resistance Levels: Upon examining the historical price data, we identify significant support at 0.00004200 and resistance at 0.00005000. These levels are crucial in determining the potential movement of SHIB towards 0.00004807.
Moving Averages: The 50-day and 200-day moving averages indicate a bullish sentiment for SHIB, with the shorter-term average trending above the longer-term average. This suggests positive momentum in the short to medium term.
Relative Strength Index (RSI): The RSI currently stands at 60, indicating a neutral stance. However, the RSI has been trending upwards, suggesting increasing buying pressure and potential for further price appreciation.
Fibonacci Retracement: Applying Fibonacci retracement levels to SHIB's recent price action reveals that the 0.00004807 level aligns closely with the 38.2% retracement level. Historically, this level has acted as both support and resistance, adding significance to its potential impact on SHIB's price movement.
Conclusion:
Based on our technical analysis, there is a compelling case for Shiba Inu (SHIB) to reach the level of 0.00004807 against its trading pair. Key indicators such as moving averages, support/resistance levels, RSI, and Fibonacci retracement suggest a bullish outlook for SHIB in the near term. However, traders should exercise caution and conduct their own analysis before making any investment decisions.
Made by AI

‘Alternate’ AB=CD Bullish Pattern on the DowMajor US equity benchmarks continue to outperform, recording fresh all-time highs. However, in recent moves, a mild correction is seen taking shape, one that has opened the door to a particularly interesting bullish formation on the Dow Jones Industrial Average (Dow).
As evident from the daily timeframe, price is closing in on an ‘alternate’ AB=CD bullish formation, depicted by a 1.272% Fibonacci projection ratio at 38,421—one of the simpler harmonic patterns. Should a test of this level come to fruition, buyers tend to target the 38.2% and 61.8% Fibonacci retracement ratios of legs A-D. But, in light of the uptrend in play, buyers from this level will likely target beyond these ratios in anticipation of fresh record highs unfolding.

Multiple patterns formation {ABCD+CUP HANDLE+FLAG)Mphasis is forming ABCD pattern on long time frame
Cup and handle on weekly
and flag on daily time frame
EXPECTING 17 TO 65 % move in this counter
keep stoploss of 2650 on day close basis

ABCD pattern in RILRIL is bullish in daily chart and forming an AB=CD pattern
Expecting a return of 9 to 25% this year
wait to cross above 2626 on day close basis for a target of 2877 and max 3277

ES has measured moves to 6150?ES has measured move AB=CD targets in the 5250 to 5425 and 6000 to 6150 areas.

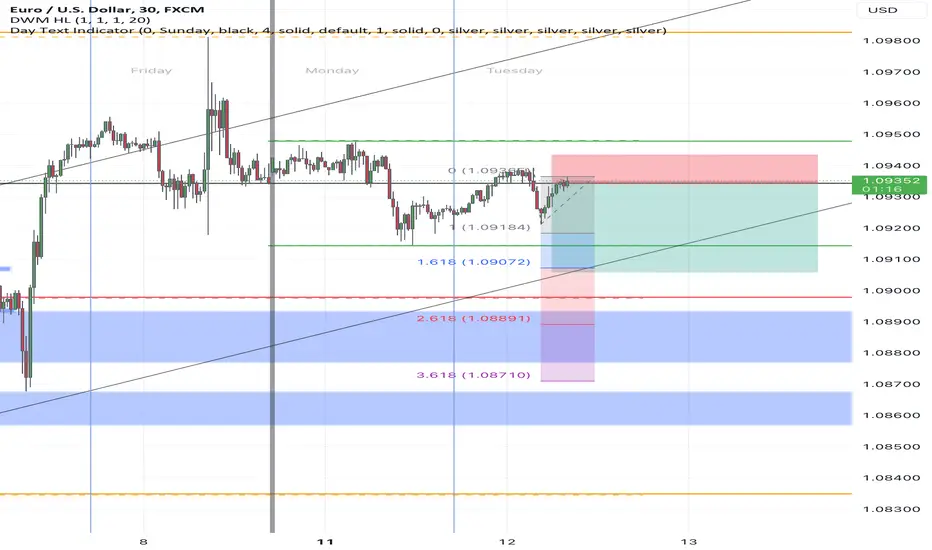
EURUSDEURUSD Is potentially setting up an ABCD move, PCE data came in and met expectations, with this being a major factor as to when the rate cuts begin, as the FED stated they needed more confidence, perhaps this is the start of a bullish move in the USD crosses, On Friday we saw massive momentum in the Indices and XAU, Maybe we see that move develop more next week.
